| Param | Original file | Final file |
|---|---|---|
| Filename | modeM0/AS1A07_148T02_9000003444_23479cztM0_level2.evt | modeM0/AS1A07_148T02_9000003444_23479cztM0_level2_quad_clean.evt |
| Size (bytes) | 107,795,520 | 27,777,600 |
| Size | 102.8 MB | 26.5 MB |
| Events in quadrant A | 790,371 | 188,429 |
| Events in quadrant B | 816,995 | 189,771 |
| Events in quadrant C | 783,516 | 179,168 |
| Events in quadrant D | 777,635 | 180,986 |
| Mode M9 | |||
|---|---|---|---|
| Quadrant | BADHDUFLAG | Total packets | Discarded packets |
| A | 0 | 12 | 2 |
| B | 0 | 12 | 3 |
| C | 0 | 12 | 2 |
| D | 0 | 12 | 3 |
| Mode SS | |||
|---|---|---|---|
| Quadrant | BADHDUFLAG | Total packets | Discarded packets |
| A | 0 | 34 | 6 |
| B | 0 | 34 | 6 |
| C | 0 | 34 | 4 |
| D | 0 | 34 | 6 |
| Mode M0 | |||
|---|---|---|---|
| Quadrant | BADHDUFLAG | Total packets | Discarded packets |
| A | 0 | 3558 | 437 |
| B | 0 | 3767 | 508 |
| C | 0 | 3670 | 543 |
| D | 0 | 3532 | 450 |
| Quadrant | Total seconds | Saturated seconds | Saturation percentage |
|---|---|---|---|
| A | 1383 | 26 | 1.879971% |
| B | 1362 | 31 | 2.276065% |
| C | 1347 | 39 | 2.895323% |
| D | 1380 | 23 | 1.666667% |
Noise dominated data is calculated using 1-second bins in cleaned event files. If a bin has >2000 counts, and if more than 50% of those come from <1% of pixels, then it is considered to be noise-dominated and hence unusable.
| Quadrant | # 1 sec bins | Bins with >0 counts | Bins with >2000 counts | High rate bins dominated by noise | Noise dominated (total time) | Noise dominated (detector-on time) | Marked lightcurve |
|---|---|---|---|---|---|---|---|
| A | 2793 | 1456 | 0 | 0 | 0.00% | 0.00% | 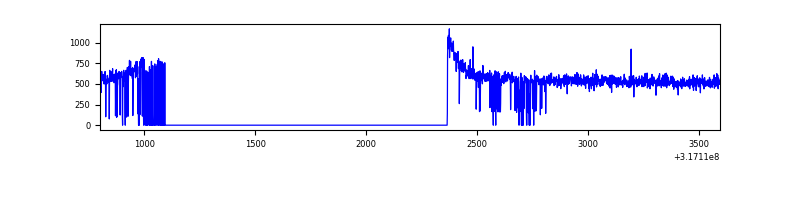 |
| B | 2793 | 1437 | 0 | 0 | 0.00% | 0.00% | 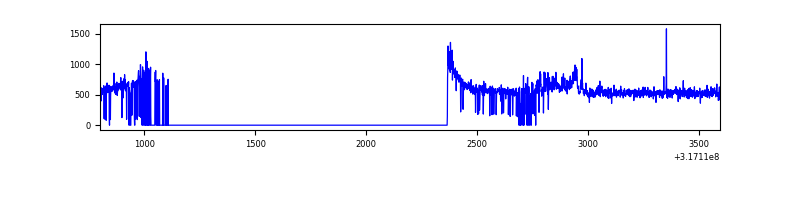 |
| C | 2793 | 1427 | 0 | 0 | 0.00% | 0.00% | 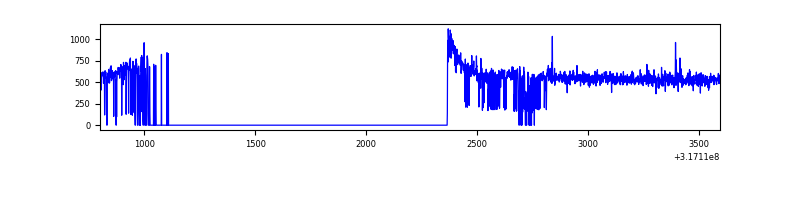 |
| D | 2793 | 1447 | 0 | 0 | 0.00% | 0.00% | 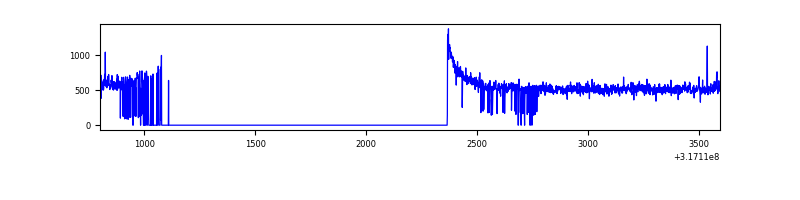 |
Top three noisy pixels from each quadrant. If the there are fewer than three noisy pixels in the level2.evt file, extra rows are filled as -1
| Pixel properties | Quadrant properties | ||||||
|---|---|---|---|---|---|---|---|
| Quadrant | DetID | PixID | Counts | Sigma | Mean | Median | Sigma |
| A | 13 | 254 | 2074 | 44.66 | 204 | 200 | 42.0 |
| A | 0 | 226 | 1783 | 37.72 | 204 | 200 | 42.0 |
| A | 3 | 137 | 1645 | 34.43 | 204 | 200 | 42.0 |
| B | 0 | 189 | 43839 | 1108.15 | 196 | 191 | 39.4 |
| B | 0 | 230 | 6068 | 149.21 | 196 | 191 | 39.4 |
| B | 12 | 111 | 4440 | 107.88 | 196 | 191 | 39.4 |
| C | 14 | 238 | 29514 | 628.68 | 191 | 192 | 46.6 |
| C | 7 | 247 | 5256 | 108.58 | 191 | 192 | 46.6 |
| C | 5 | 4 | 1906 | 36.75 | 191 | 192 | 46.6 |
| D | 13 | 172 | 10124 | 200.92 | 200 | 195 | 49.4 |
| D | 2 | 234 | 5067 | 98.59 | 200 | 195 | 49.4 |
| D | 12 | 227 | 3931 | 75.6 | 200 | 195 | 49.4 |
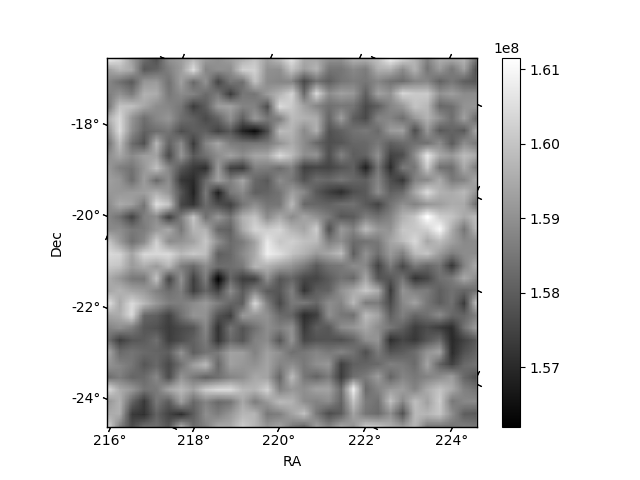
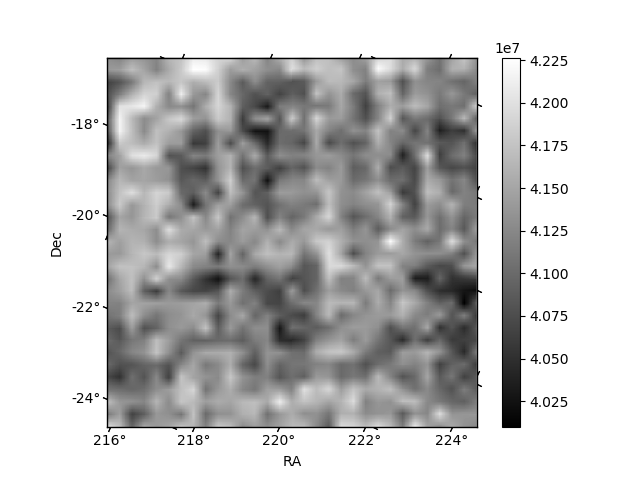
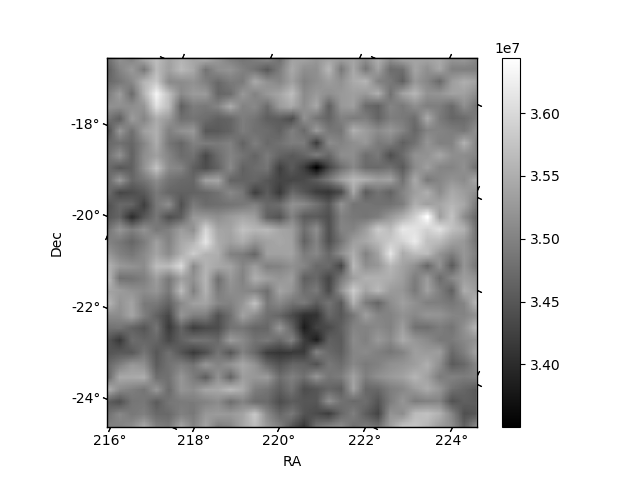
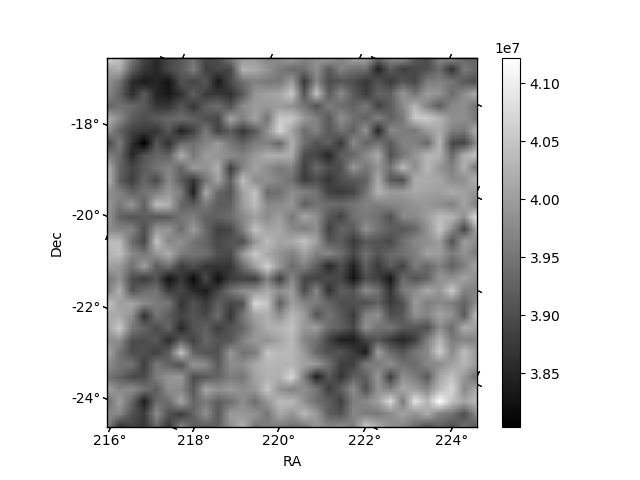
Histogram calculated using DETX and DETY for each event in the final _common_clean file
| Quadrant A | 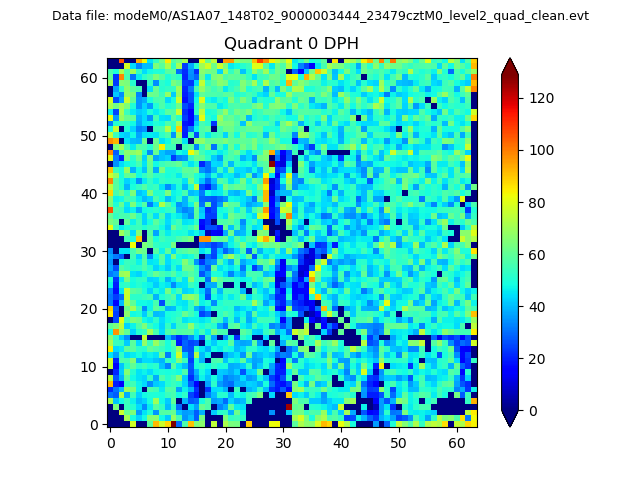 |
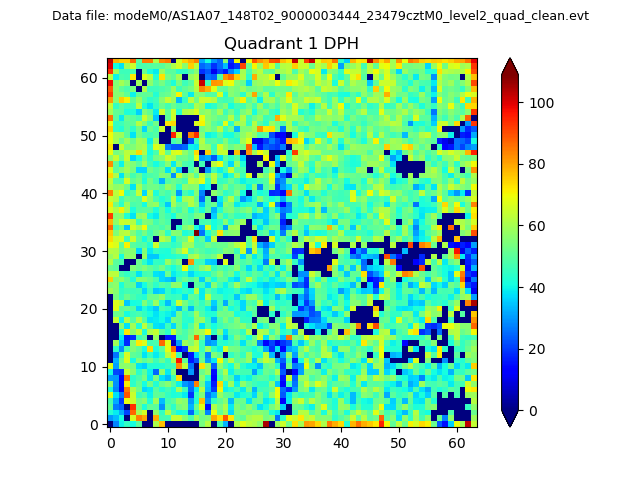 |
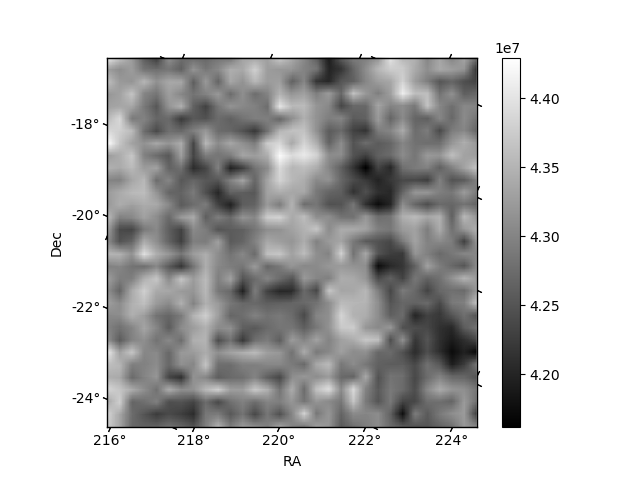
Quadrant B |
|---|---|---|---|
| Quadrant D | 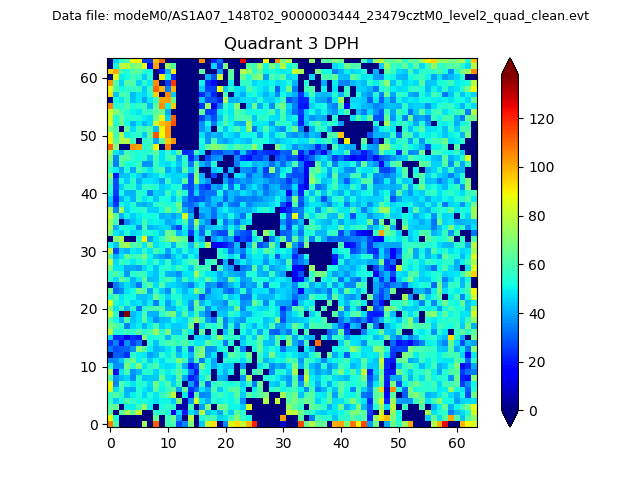 |
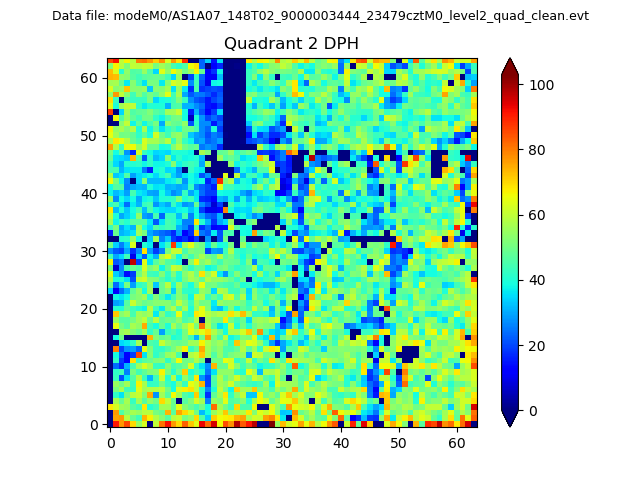 |
Quadrant C |
| Plot type | Count rate plots | Images |
|---|---|---|
| Comparison with Poisson distribution Blue bars denote a histogram of data divided into 1 sec bins. Red curve is a Poisson curve with rate = median count rate of data. |
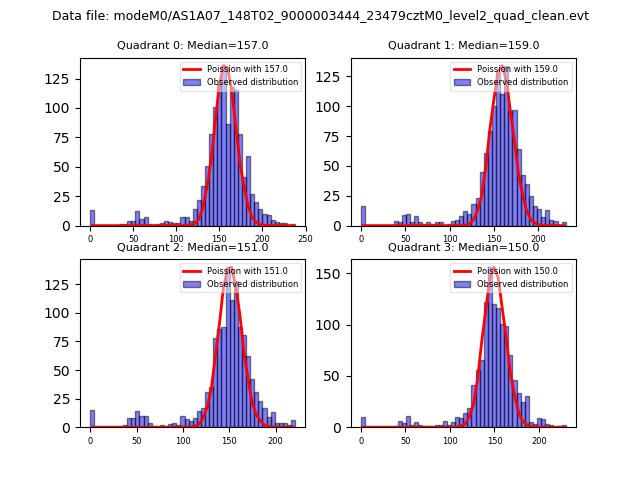 |
 |
| Quadrant-wise count rates Data is divided into 100 sec bins |
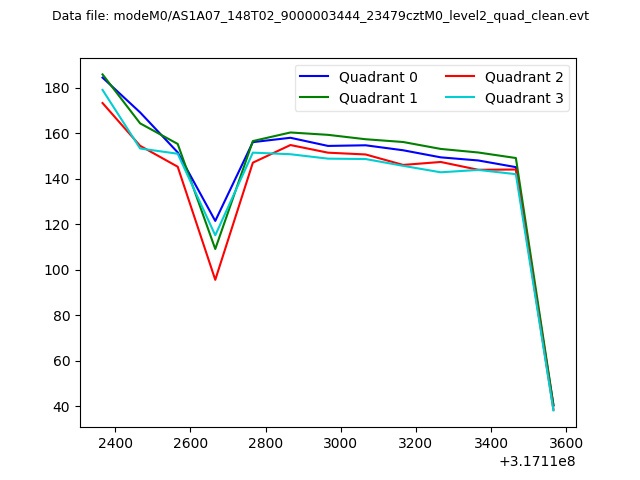 |
|
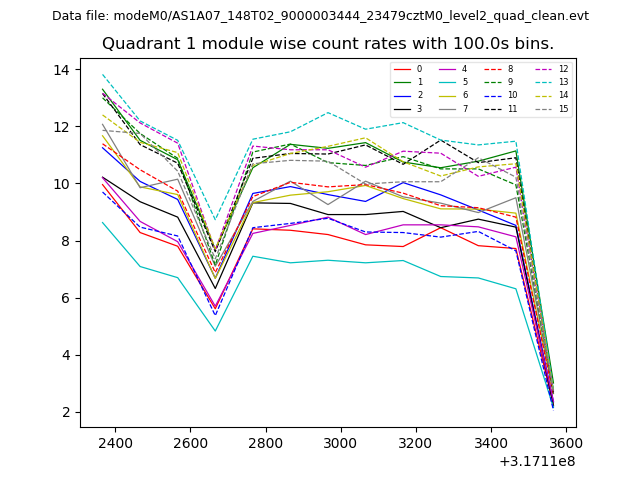
| Module-wise count rates for Quadrant A Data is divided into 100 sec bins |
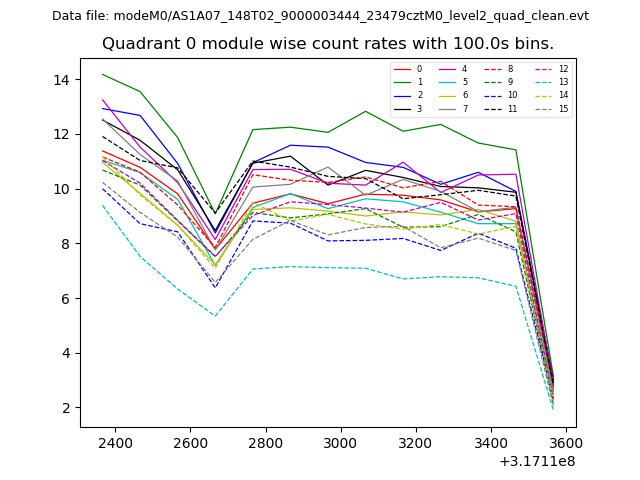 |
 |
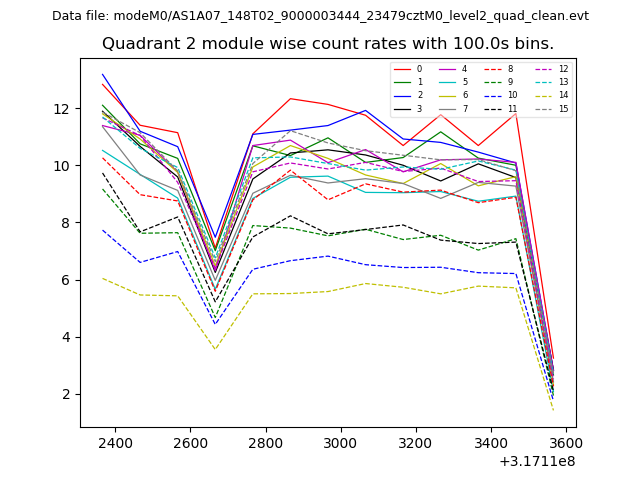
| Module-wise count rates for Quadrant B Data is divided into 100 sec bins |
 |
 |
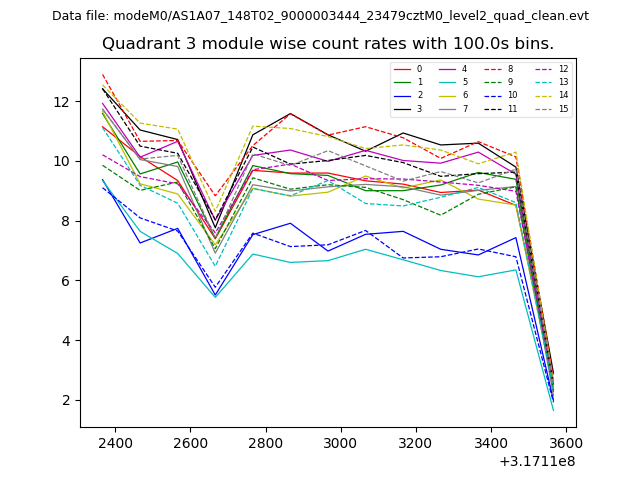
| Module-wise count rates for Quadrant C Data is divided into 100 sec bins |
 |
 |
| Module-wise count rates for Quadrant D Data is divided into 100 sec bins |
 |
 |
| Parameter | Plot |
|---|---|
| CZT HV Monitor | 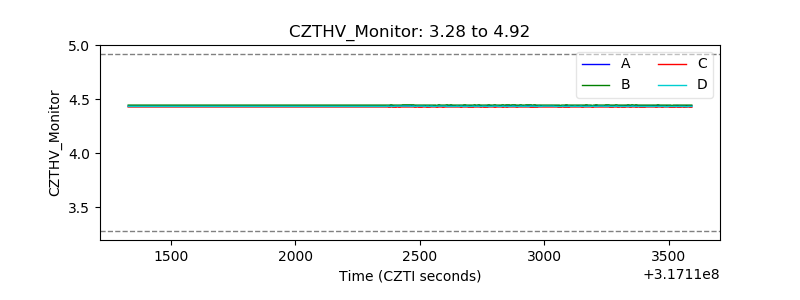 |
| D_VDD | 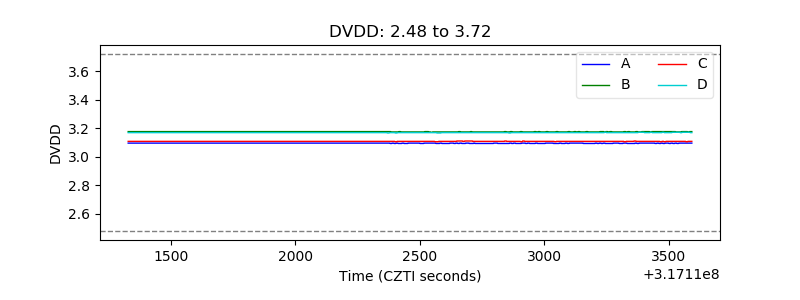 |
| Temperature 1 | 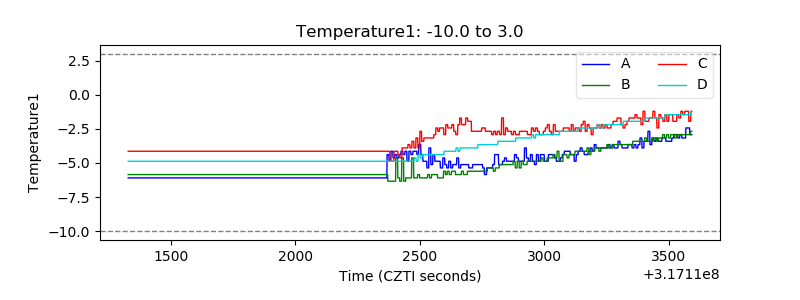 |
| Veto HV Monitor | 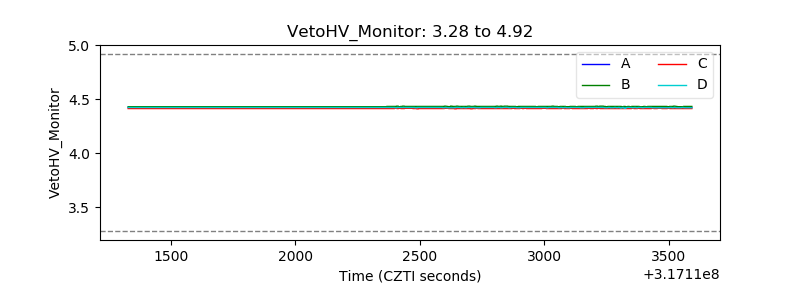 |
| Veto LLD | 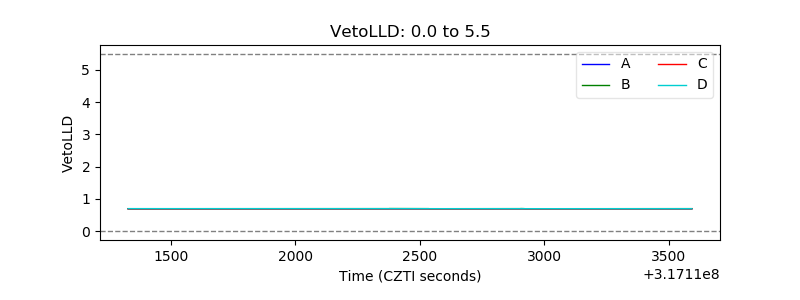 |
| Alpha Counter | 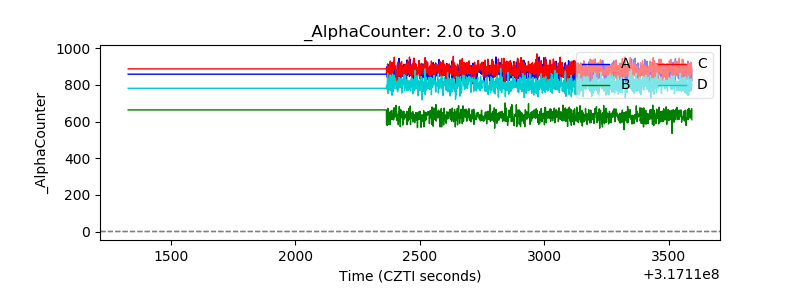 |
| _CPM_Rate |  |
| CZT Counter | 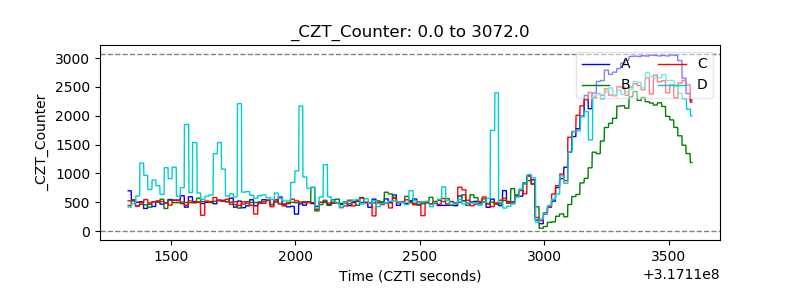 |
| +2.5 Volts monitor |  |
| +5 Volts monitor |  |
| _ROLL_ROT | 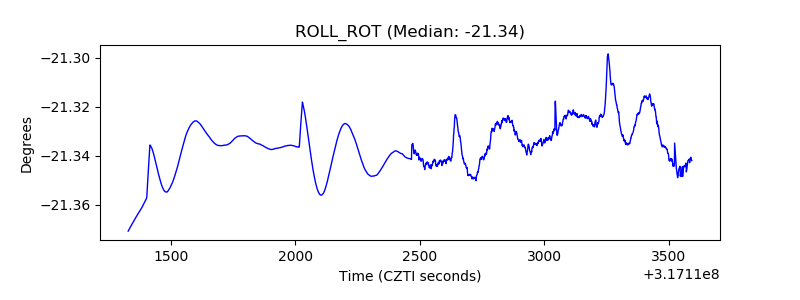 |
| _Roll_DEC | 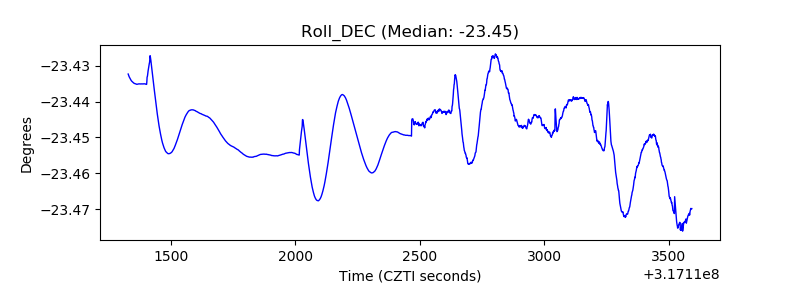 |
| _Roll_RA | 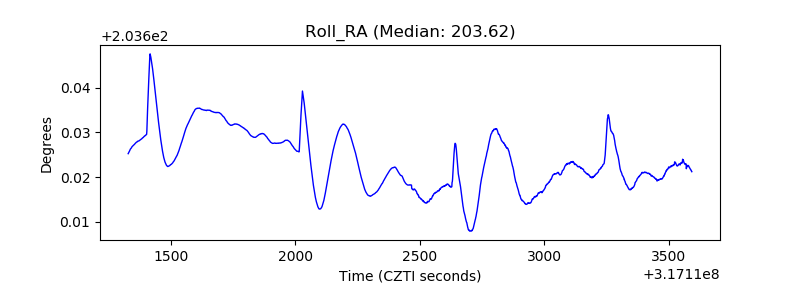 |
| Veto Counter | 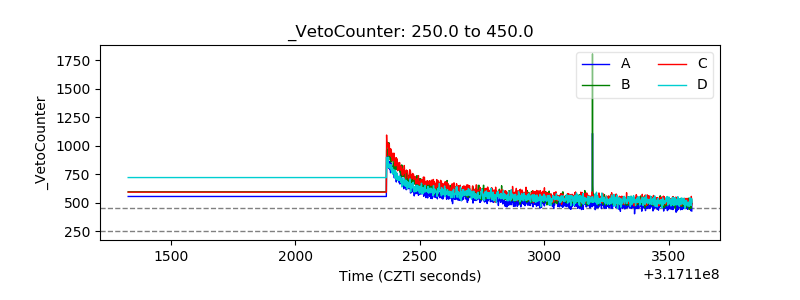 |