| Param | Original file | Final file |
|---|---|---|
| Filename | modeM0/AS1A07_148T05_9000003446cztM0_level2.fits | modeM0/AS1A07_148T05_9000003446cztM0_level2_quad_clean.evt |
| Size (bytes) | 675,040,320 | 586,431,360 |
| Size | 643.8 MB | 559.3 MB |
| Events in quadrant A | 4,270,254 | 3,497,081 |
| Events in quadrant B | 4,071,850 | 3,515,173 |
| Events in quadrant C | 4,123,812 | 3,327,333 |
| Events in quadrant D | 3,345,924 | 2,792,260 |
| Mode M0 | |||
|---|---|---|---|
| Quadrant | BADHDUFLAG | Total packets | Discarded packets |
| A | 0 | 146620 | 0 |
| B | 0 | 143262 | 0 |
| C | 0 | 154683 | 0 |
| D | 0 | 241684 | 0 |
| Mode SS | |||
|---|---|---|---|
| Quadrant | BADHDUFLAG | Total packets | Discarded packets |
| A | 0 | 1372 | 0 |
| B | 0 | 1372 | 0 |
| C | 0 | 1372 | 0 |
| D | 0 | 1372 | 0 |
| Mode M9 | |||
|---|---|---|---|
| Quadrant | BADHDUFLAG | Total packets | Discarded packets |
| A | 0 | 107 | 0 |
| B | 0 | 107 | 0 |
| C | 0 | 107 | 0 |
| D | 0 | 107 | 0 |
| Quadrant | Total seconds | Saturated seconds | Saturation percentage |
|---|---|---|---|
| A | 67475 | 946 | 1.402001% |
| B | 67475 | 888 | 1.316043% |
| C | 67475 | 1626 | 2.409781% |
| D | 67475 | 11517 | 17.068544% |
Noise dominated data is calculated using 1-second bins in cleaned event files. If a bin has >2000 counts, and if more than 50% of those come from <1% of pixels, then it is considered to be noise-dominated and hence unusable.
| Quadrant | # 1 sec bins | Bins with >0 counts | Bins with >2000 counts | High rate bins dominated by noise | Noise dominated (total time) | Noise dominated (detector-on time) | Marked lightcurve |
|---|---|---|---|---|---|---|---|
| A | 82060 | 67469 | 0 | 0 | 0.00% | 0.00% |  |
| B | 82060 | 67468 | 0 | 0 | 0.00% | 0.00% |  |
| C | 82060 | 67463 | 0 | 0 | 0.00% | 0.00% |  |
| D | 82060 | 67351 | 0 | 0 | 0.00% | 0.00% |  |
Top three noisy pixels from each quadrant. If the there are fewer than three noisy pixels in the level2.evt file, extra rows are filled as -1
| Pixel properties | Quadrant properties | ||||||
|---|---|---|---|---|---|---|---|
| Quadrant | DetID | PixID | Counts | Sigma | Mean | Median | Sigma |
| A | 0 | 29 | 3899 | 10.5 | 1110 | 1040 | 272.4 |
| A | 7 | 110 | 3383 | 8.6 | 1110 | 1040 | 272.4 |
| A | 0 | 30 | 3095 | 7.54 | 1110 | 1040 | 272.4 |
| B | 2 | 9 | 3285 | 10.6 | 1076 | 1026 | 213.1 |
| B | 3 | 80 | 2745 | 8.07 | 1076 | 1026 | 213.1 |
| B | 2 | 8 | 2690 | 7.81 | 1076 | 1026 | 213.1 |
| C | 12 | 241 | 2823 | 6.51 | 1091 | 1023 | 276.3 |
| C | 7 | 111 | 2785 | 6.37 | 1091 | 1023 | 276.3 |
| C | 3 | 126 | 2774 | 6.33 | 1091 | 1023 | 276.3 |
| D | 3 | 14 | 2401 | 6.02 | 956 | 873 | 254.0 |
| D | 6 | 231 | 2322 | 5.7 | 956 | 873 | 254.0 |
| D | 3 | 159 | 2305 | 5.64 | 956 | 873 | 254.0 |
Histogram calculated using DETX and DETY for each event in the final _common_clean file
| Quadrant A | 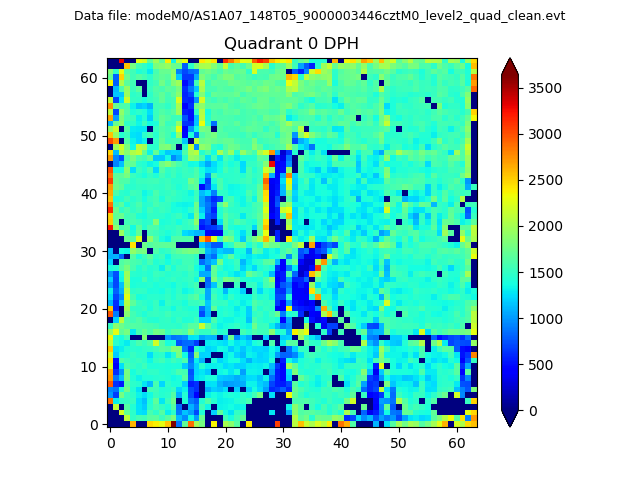 |
 |
Quadrant B |
|---|---|---|---|
| Quadrant D |  |
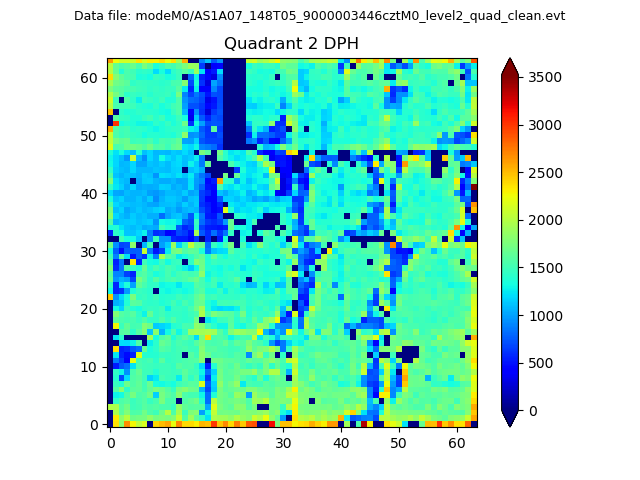 |
Quadrant C |
| Plot type | Count rate plots | Images |
|---|---|---|
| Comparison with Poisson distribution Blue bars denote a histogram of data divided into 1 sec bins. Red curve is a Poisson curve with rate = median count rate of data. |
 |
 |
| Quadrant-wise count rates Data is divided into 100 sec bins |
 |
|
| Module-wise count rates for Quadrant A Data is divided into 100 sec bins |
 |
 |
| Module-wise count rates for Quadrant B Data is divided into 100 sec bins |
 |
 |
| Module-wise count rates for Quadrant C Data is divided into 100 sec bins |
 |
 |
| Module-wise count rates for Quadrant D Data is divided into 100 sec bins |
 |
 |
| Parameter | Plot |
|---|---|
| CZT HV Monitor |  |
| D_VDD |  |
| Temperature 1 |  |
| Veto HV Monitor |  |
| Veto LLD | 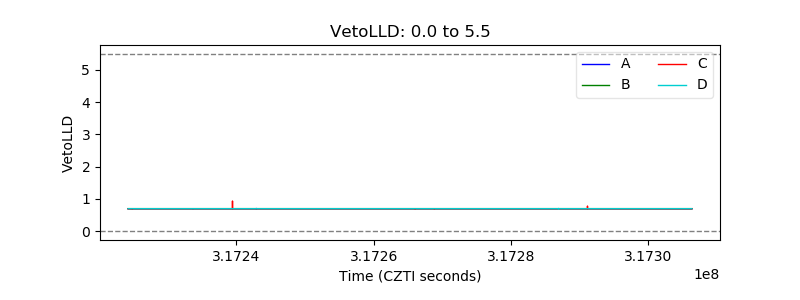 |
| Alpha Counter |  |
| _CPM_Rate |  |
| CZT Counter |  |
| +2.5 Volts monitor |  |
| +5 Volts monitor |  |
| _ROLL_ROT | 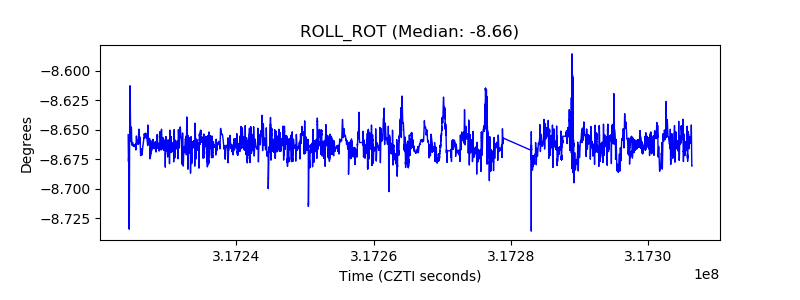 |
| _Roll_DEC |  |
| _Roll_RA |  |
| Veto Counter |  |