| Param | Original file | Final file |
|---|---|---|
| Filename | modeM0/AS1A07_148T05_9000003446_23319cztM0_level2.evt | modeM0/AS1A07_148T05_9000003446_23319cztM0_level2_quad_clean.evt |
| Size (bytes) | 229,901,760 | 27,492,480 |
| Size | 219.3 MB | 26.2 MB |
| Events in quadrant A | 1,475,135 | 168,939 |
| Events in quadrant B | 1,454,978 | 170,785 |
| Events in quadrant C | 2,205,636 | 148,811 |
| Events in quadrant D | 1,653,837 | 162,324 |
| Mode M0 | |||
|---|---|---|---|
| Quadrant | BADHDUFLAG | Total packets | Discarded packets |
| A | 0 | 6037 | 1 |
| B | 0 | 5908 | 2 |
| C | 0 | 8369 | 1 |
| D | 0 | 6621 | 1 |
| Mode SS | |||
|---|---|---|---|
| Quadrant | BADHDUFLAG | Total packets | Discarded packets |
| A | 0 | 54 | 0 |
| B | 0 | 54 | 0 |
| C | 0 | 54 | 0 |
| D | 0 | 54 | 0 |
| Mode M9 | |||
|---|---|---|---|
| Quadrant | BADHDUFLAG | Total packets | Discarded packets |
| A | 0 | 13 | 0 |
| B | 0 | 13 | 0 |
| C | 0 | 13 | 0 |
| D | 0 | 13 | 0 |
| Quadrant | Total seconds | Saturated seconds | Saturation percentage |
|---|---|---|---|
| A | 2516 | 89 | 3.537361% |
| B | 2515 | 94 | 3.737575% |
| C | 2515 | 367 | 14.592445% |
| D | 2515 | 138 | 5.487078% |
Noise dominated data is calculated using 1-second bins in cleaned event files. If a bin has >2000 counts, and if more than 50% of those come from <1% of pixels, then it is considered to be noise-dominated and hence unusable.
| Quadrant | # 1 sec bins | Bins with >0 counts | Bins with >2000 counts | High rate bins dominated by noise | Noise dominated (total time) | Noise dominated (detector-on time) | Marked lightcurve |
|---|---|---|---|---|---|---|---|
| A | 3826 | 2516 | 3 | 3 | 0.08% | 0.12% | 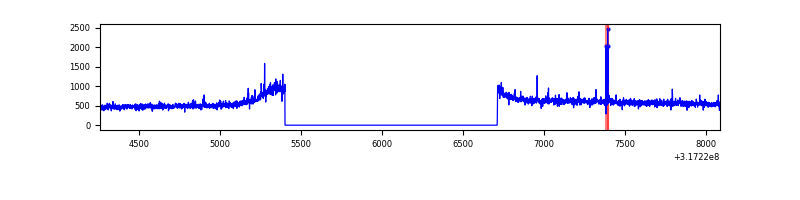 |
| B | 3825 | 2515 | 0 | 0 | 0.00% | 0.00% | 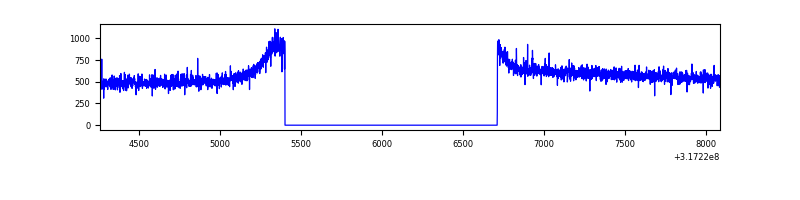 |
| C | 3825 | 2515 | 186 | 186 | 4.86% | 7.40% | 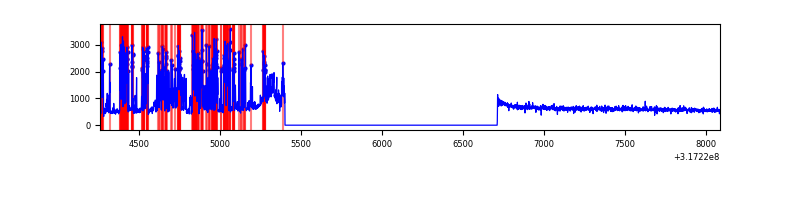 |
| D | 3825 | 2515 | 54 | 54 | 1.41% | 2.15% | 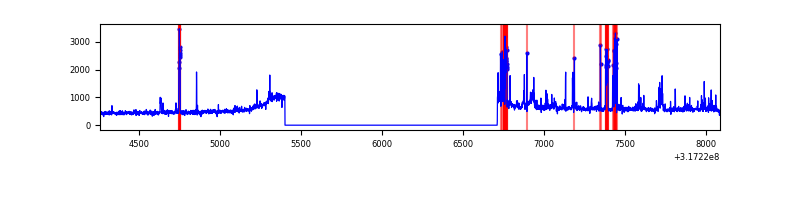 |
Top three noisy pixels from each quadrant. If the there are fewer than three noisy pixels in the level2.evt file, extra rows are filled as -1
| Pixel properties | Quadrant properties | ||||||
|---|---|---|---|---|---|---|---|
| Quadrant | DetID | PixID | Counts | Sigma | Mean | Median | Sigma |
| A | 6 | 16 | 25519 | 326.72 | 376 | 369 | 77.0 |
| A | 13 | 254 | 4243 | 50.33 | 376 | 369 | 77.0 |
| A | 0 | 226 | 3199 | 36.76 | 376 | 369 | 77.0 |
| B | 12 | 111 | 8127 | 106.98 | 370 | 361 | 72.6 |
| B | 11 | 111 | 7025 | 91.8 | 370 | 361 | 72.6 |
| B | 14 | 111 | 6267 | 81.36 | 370 | 361 | 72.6 |
| C | 10 | 9 | 754816 | 9165.92 | 349 | 352 | 82.3 |
| C | 14 | 238 | 55832 | 674.02 | 349 | 352 | 82.3 |
| C | 7 | 247 | 19523 | 232.91 | 349 | 352 | 82.3 |
| D | 1 | 52 | 150510 | 1675.66 | 366 | 358 | 89.6 |
| D | 12 | 233 | 63717 | 707.07 | 366 | 358 | 89.6 |
| D | 13 | 249 | 39737 | 439.46 | 366 | 358 | 89.6 |
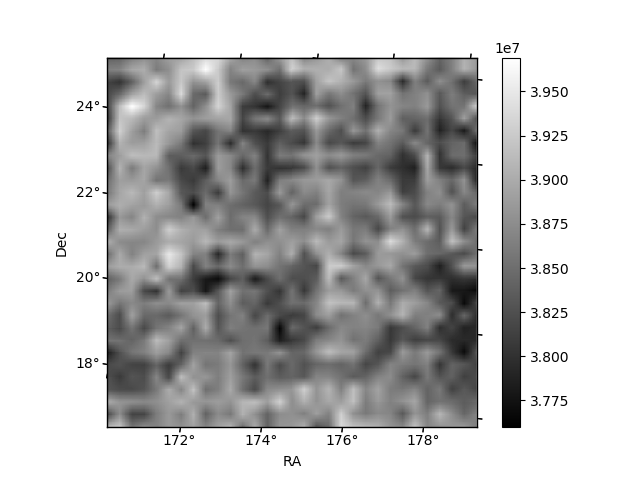
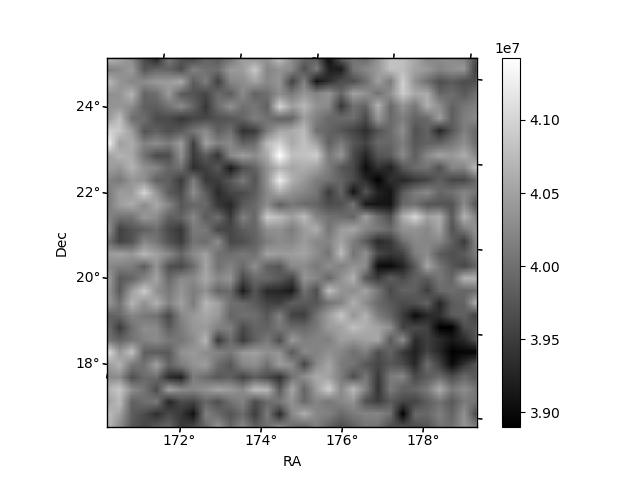
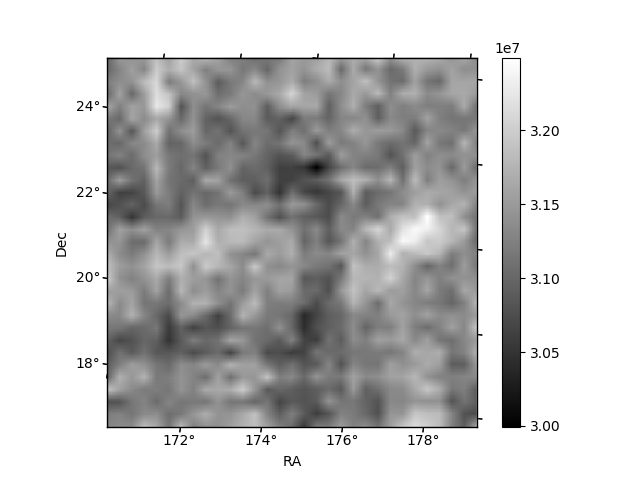
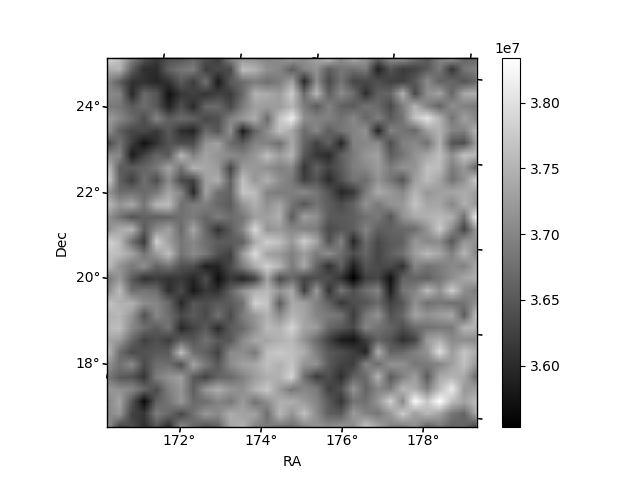
Histogram calculated using DETX and DETY for each event in the final _common_clean file
| Quadrant A | 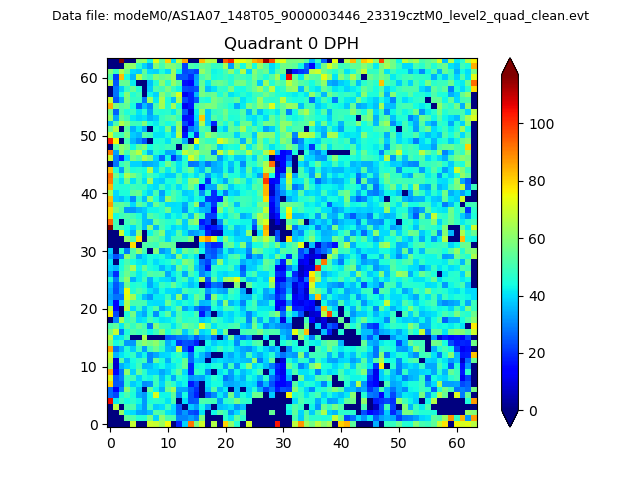 |
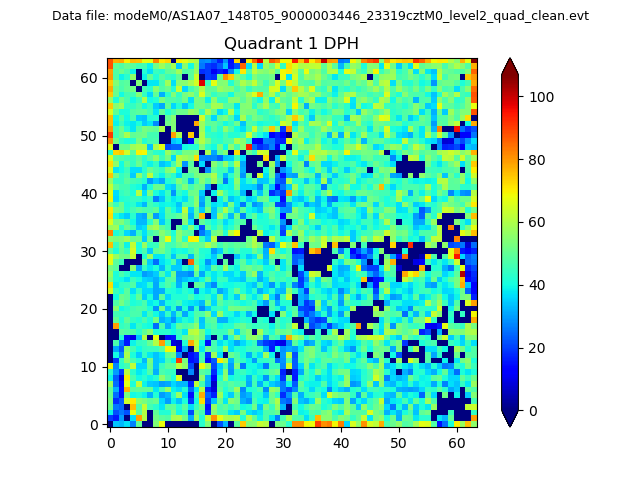 |
Quadrant B |
|---|---|---|---|
| Quadrant D | 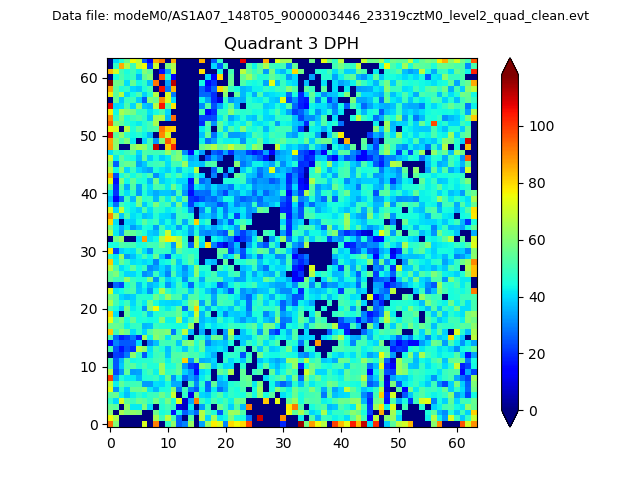 |
 |
Quadrant C |
| Plot type | Count rate plots | Images |
|---|---|---|
| Comparison with Poisson distribution Blue bars denote a histogram of data divided into 1 sec bins. Red curve is a Poisson curve with rate = median count rate of data. |
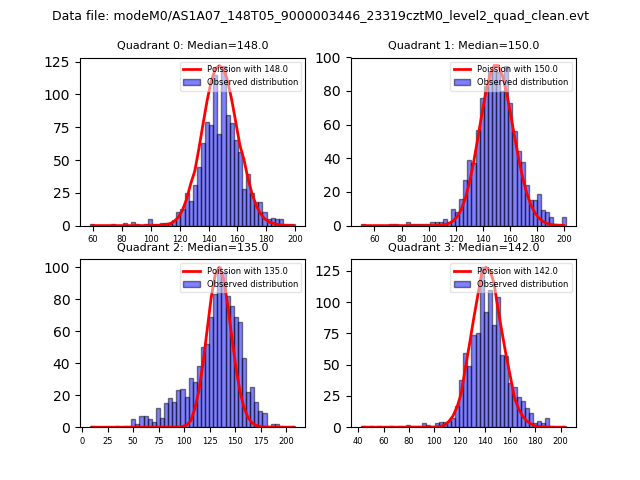 |
 |
| Quadrant-wise count rates Data is divided into 100 sec bins |
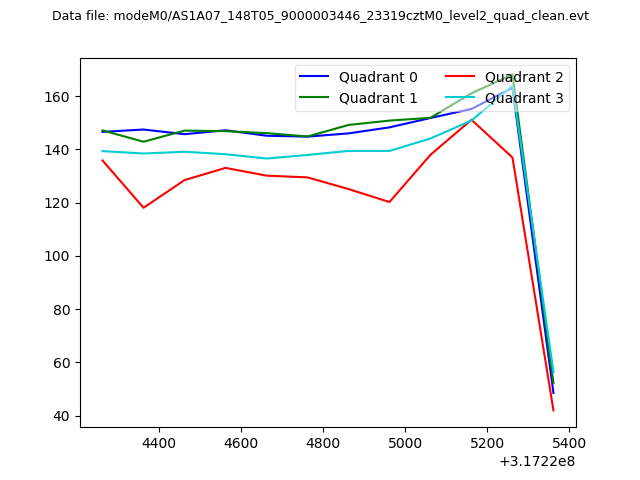 |
|
| Module-wise count rates for Quadrant A Data is divided into 100 sec bins |
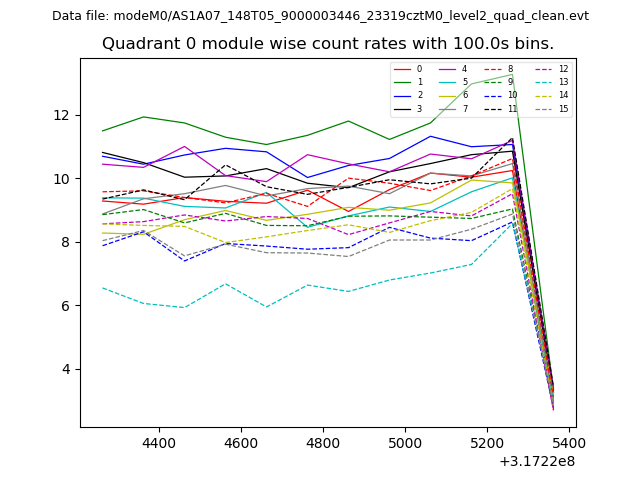 |
 |
| Module-wise count rates for Quadrant B Data is divided into 100 sec bins |
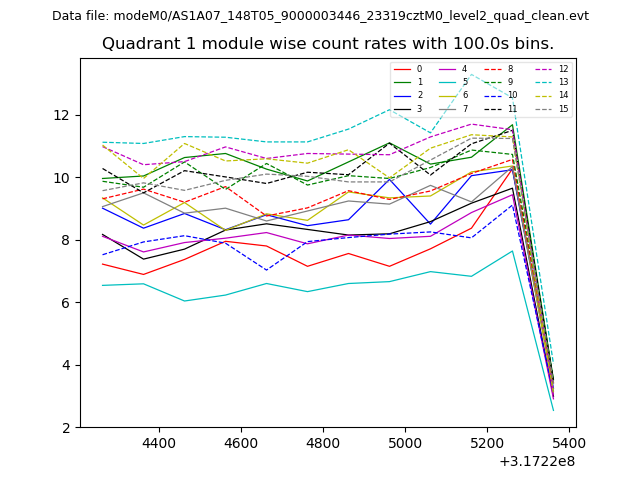 |
 |
| Module-wise count rates for Quadrant C Data is divided into 100 sec bins |
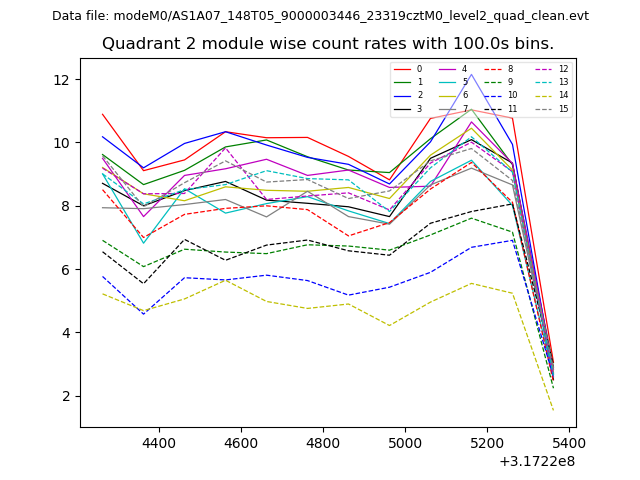 |
 |
| Module-wise count rates for Quadrant D Data is divided into 100 sec bins |
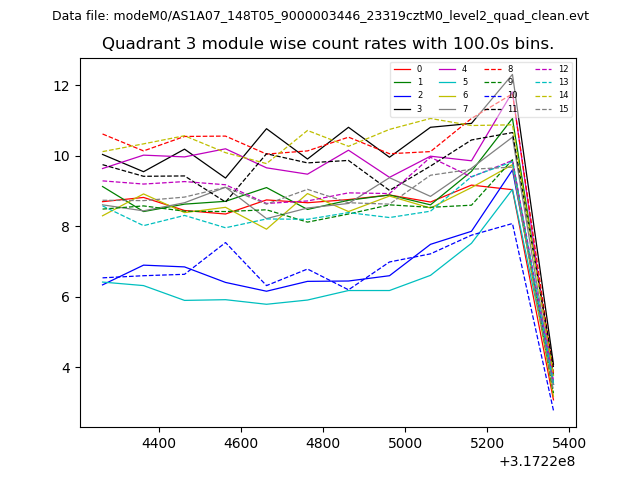 |
 |
| Parameter | Plot |
|---|---|
| CZT HV Monitor | 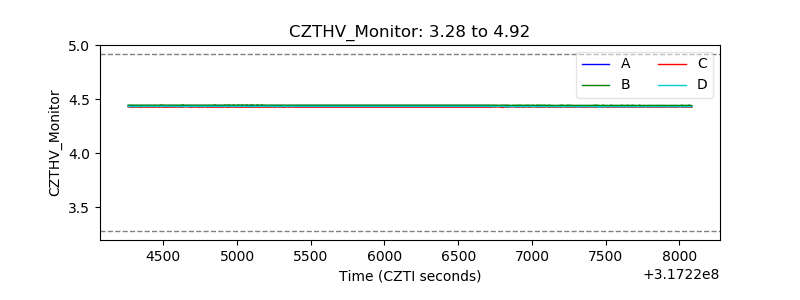 |
| D_VDD | 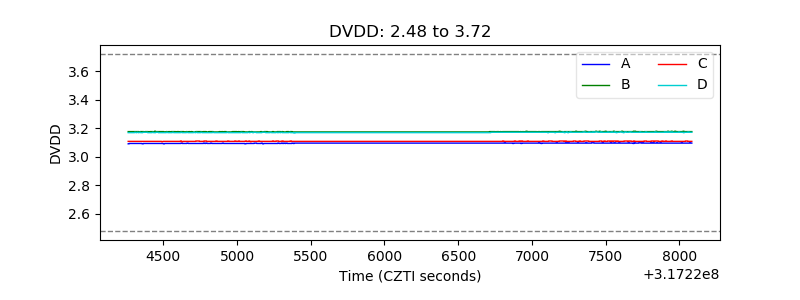 |
| Temperature 1 | 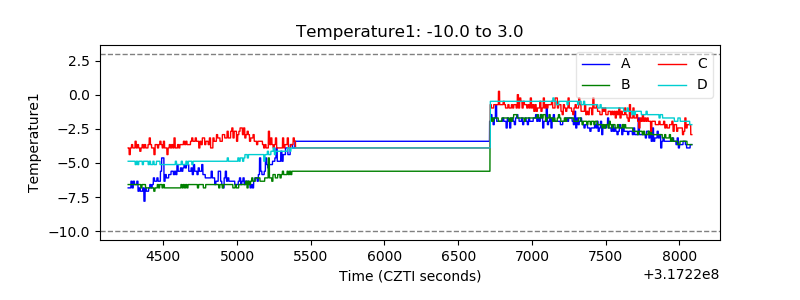 |
| Veto HV Monitor | 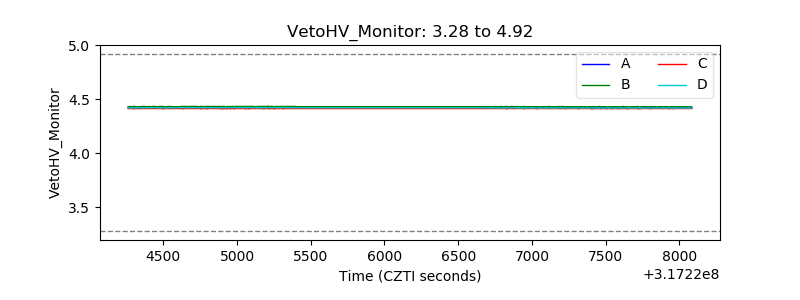 |
| Veto LLD | 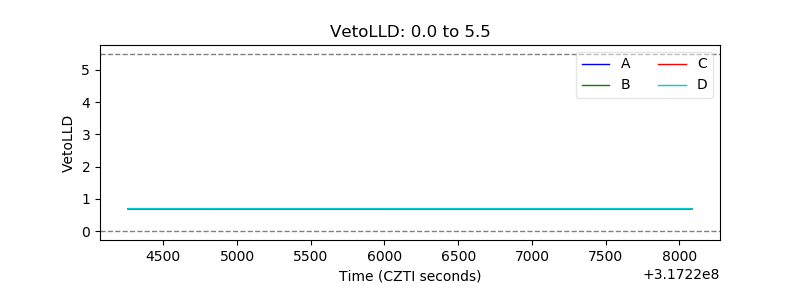 |
| Alpha Counter | 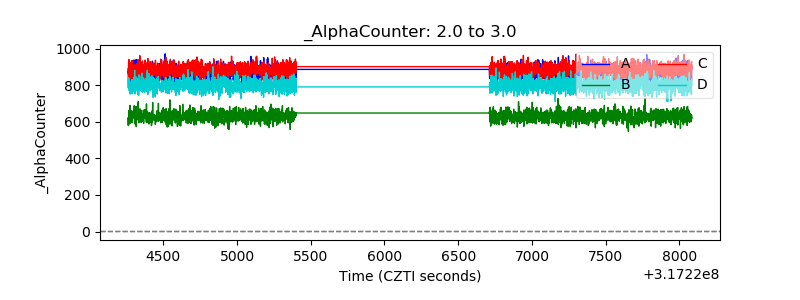 |
| _CPM_Rate | 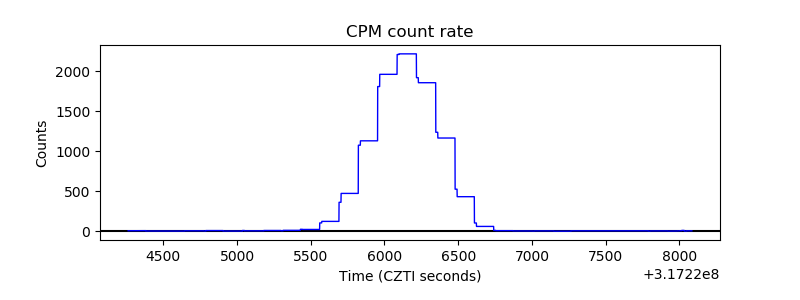 |
| CZT Counter |  |
| +2.5 Volts monitor |  |
| +5 Volts monitor | 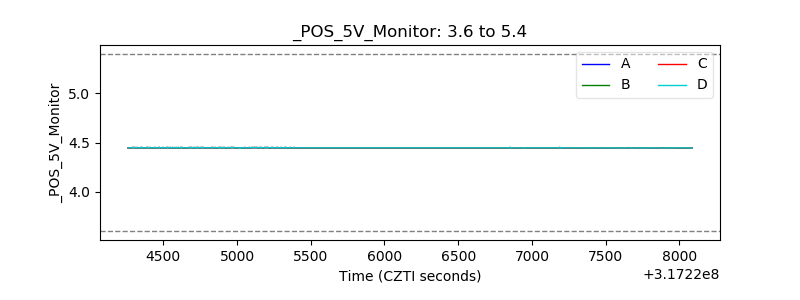 |
| _ROLL_ROT | 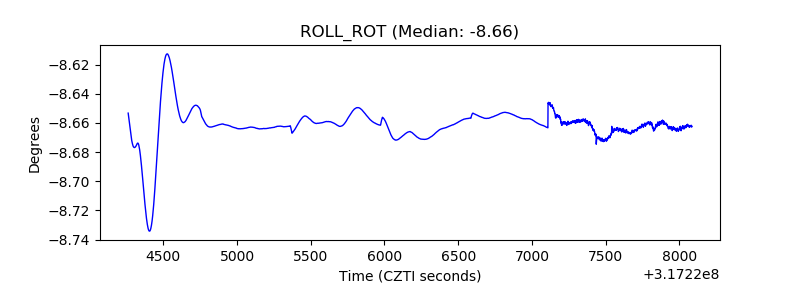 |
| _Roll_DEC | 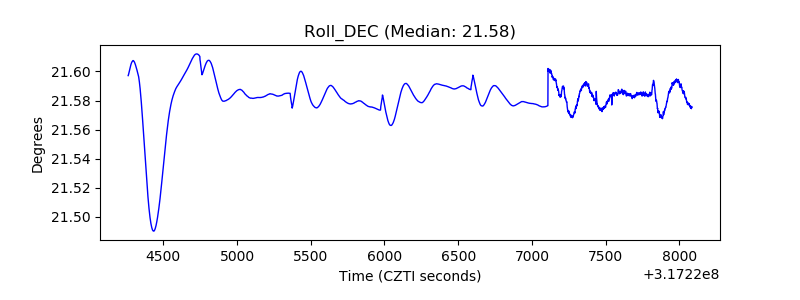 |
| _Roll_RA | 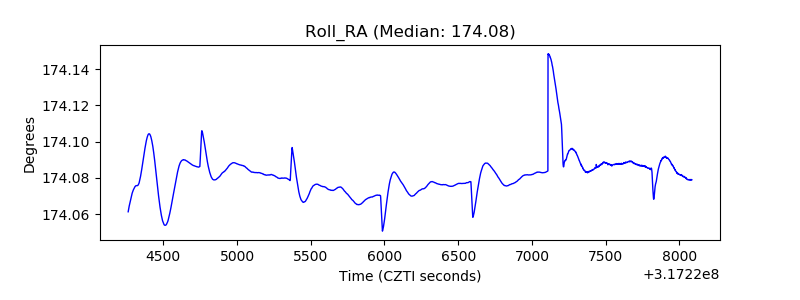 |
| Veto Counter | 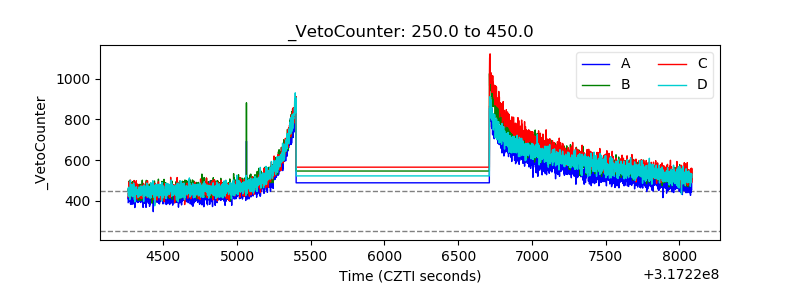 |