| Param | Original file | Final file |
|---|---|---|
| Filename | modeM0/AS1A07_148T05_9000003446_23320cztM0_level2.evt | modeM0/AS1A07_148T05_9000003446_23320cztM0_level2_quad_clean.evt |
| Size (bytes) | 474,030,720 | 78,220,800 |
| Size | 452.1 MB | 74.6 MB |
| Events in quadrant A | 3,523,122 | 490,108 |
| Events in quadrant B | 3,348,038 | 493,271 |
| Events in quadrant C | 3,436,752 | 477,426 |
| Events in quadrant D | 3,625,009 | 472,894 |
| Mode M0 | |||
|---|---|---|---|
| Quadrant | BADHDUFLAG | Total packets | Discarded packets |
| A | 0 | 14521 | 2 |
| B | 0 | 13794 | 2 |
| C | 0 | 14118 | 3 |
| D | 0 | 14862 | 2 |
| Mode SS | |||
|---|---|---|---|
| Quadrant | BADHDUFLAG | Total packets | Discarded packets |
| A | 0 | 126 | 0 |
| B | 0 | 126 | 0 |
| C | 0 | 126 | 0 |
| D | 0 | 126 | 0 |
| Mode M9 | |||
|---|---|---|---|
| Quadrant | BADHDUFLAG | Total packets | Discarded packets |
| A | 0 | 17 | 0 |
| B | 0 | 18 | 0 |
| C | 0 | 18 | 0 |
| D | 0 | 18 | 0 |
| Quadrant | Total seconds | Saturated seconds | Saturation percentage |
|---|---|---|---|
| A | 6233 | 120 | 1.925237% |
| B | 6233 | 109 | 1.748757% |
| C | 6232 | 169 | 2.711810% |
| D | 6232 | 151 | 2.422978% |
Noise dominated data is calculated using 1-second bins in cleaned event files. If a bin has >2000 counts, and if more than 50% of those come from <1% of pixels, then it is considered to be noise-dominated and hence unusable.
| Quadrant | # 1 sec bins | Bins with >0 counts | Bins with >2000 counts | High rate bins dominated by noise | Noise dominated (total time) | Noise dominated (detector-on time) | Marked lightcurve |
|---|---|---|---|---|---|---|---|
| A | 7458 | 6234 | 13 | 13 | 0.17% | 0.21% | 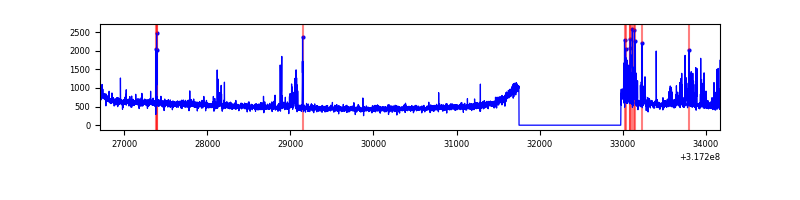 |
| B | 7458 | 6233 | 0 | 0 | 0.00% | 0.00% | 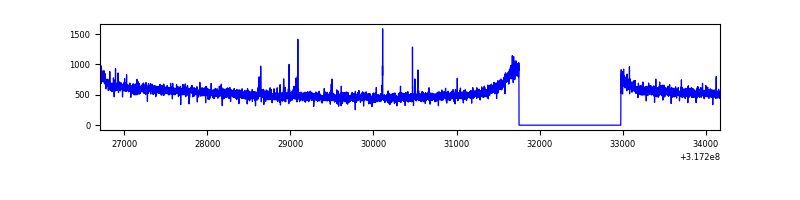 |
| C | 7457 | 6233 | 2 | 2 | 0.03% | 0.03% | 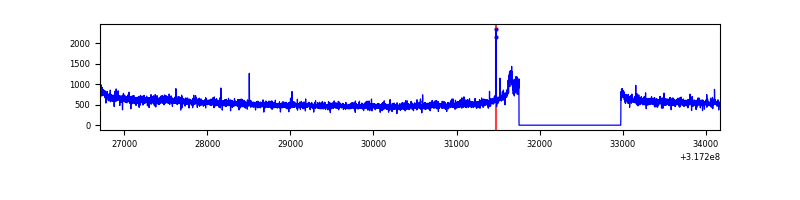 |
| D | 7457 | 6232 | 60 | 60 | 0.80% | 0.96% | 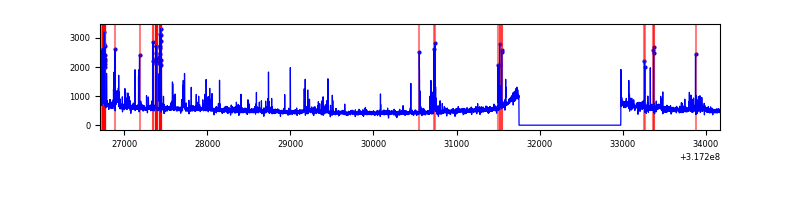 |
Top three noisy pixels from each quadrant. If the there are fewer than three noisy pixels in the level2.evt file, extra rows are filled as -1
| Pixel properties | Quadrant properties | ||||||
|---|---|---|---|---|---|---|---|
| Quadrant | DetID | PixID | Counts | Sigma | Mean | Median | Sigma |
| A | 6 | 16 | 222604 | 1295.68 | 856 | 842 | 171.2 |
| A | 13 | 254 | 10329 | 55.43 | 856 | 842 | 171.2 |
| A | 0 | 226 | 7511 | 38.96 | 856 | 842 | 171.2 |
| B | 12 | 111 | 18573 | 111.5 | 848 | 830 | 159.1 |
| B | 11 | 111 | 16648 | 99.4 | 848 | 830 | 159.1 |
| B | 14 | 111 | 14306 | 84.68 | 848 | 830 | 159.1 |
| C | 14 | 238 | 132566 | 685.14 | 826 | 835 | 192.3 |
| C | 10 | 9 | 42867 | 218.61 | 826 | 835 | 192.3 |
| C | 7 | 247 | 17526 | 86.81 | 826 | 835 | 192.3 |
| D | 1 | 52 | 233784 | 1149.59 | 838 | 816 | 202.7 |
| D | 12 | 233 | 105980 | 518.94 | 838 | 816 | 202.7 |
| D | 13 | 104 | 70181 | 342.29 | 838 | 816 | 202.7 |
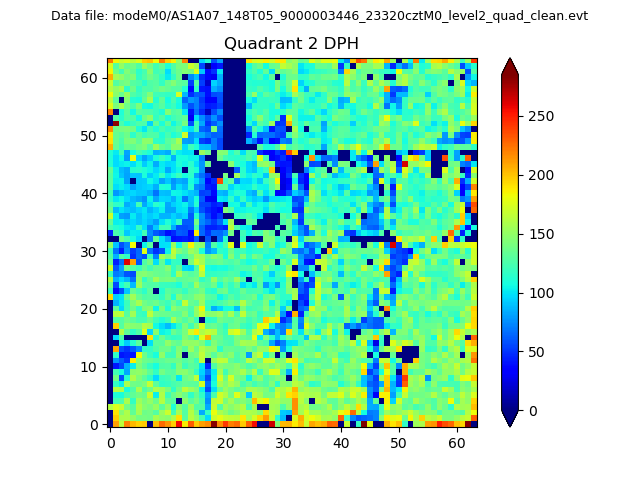
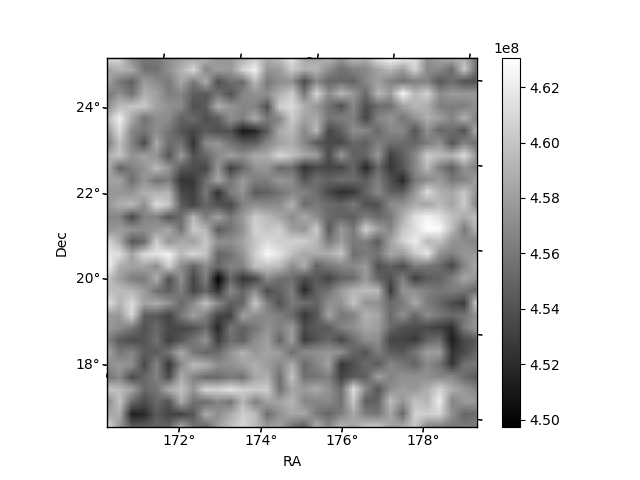
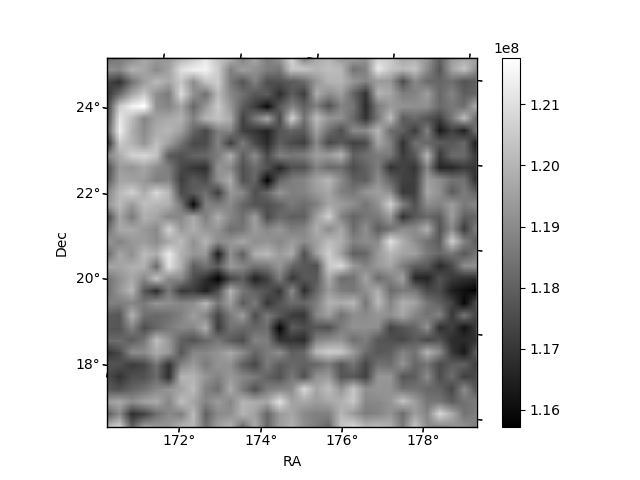
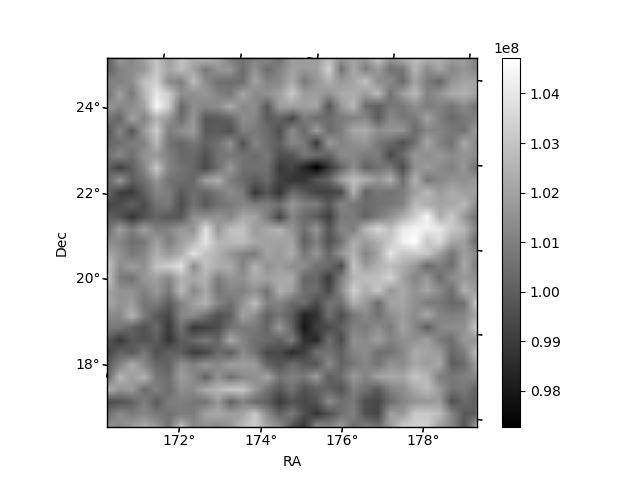
Histogram calculated using DETX and DETY for each event in the final _common_clean file
| Quadrant A | 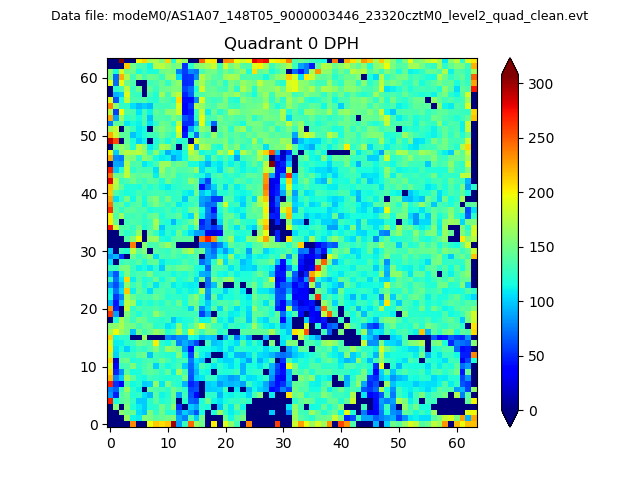 |
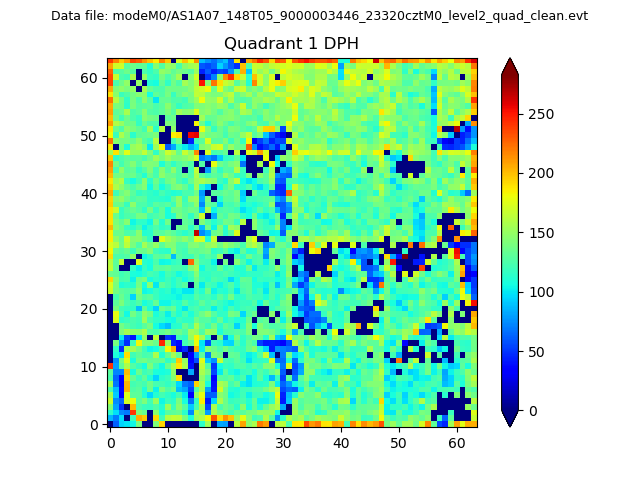 |
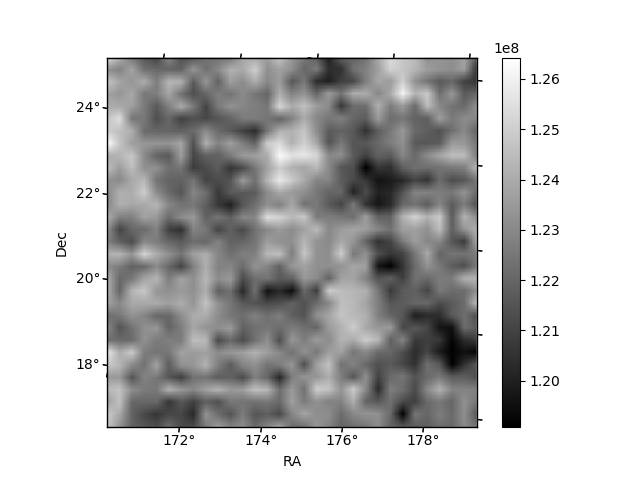
Quadrant B |
|---|---|---|---|
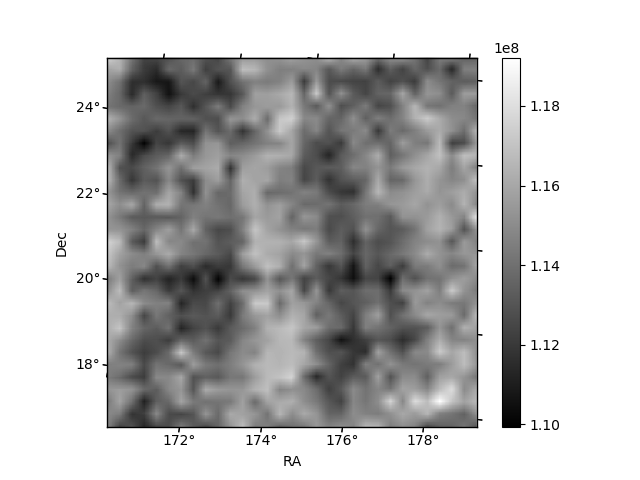
| Quadrant D | 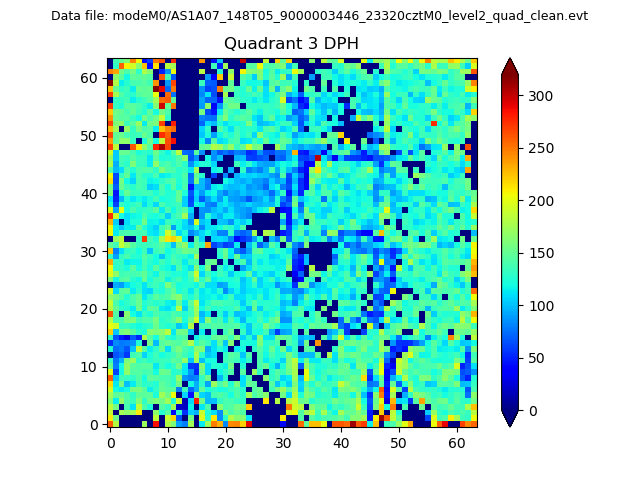 |
 |
Quadrant C |
| Plot type | Count rate plots | Images |
|---|---|---|
| Comparison with Poisson distribution Blue bars denote a histogram of data divided into 1 sec bins. Red curve is a Poisson curve with rate = median count rate of data. |
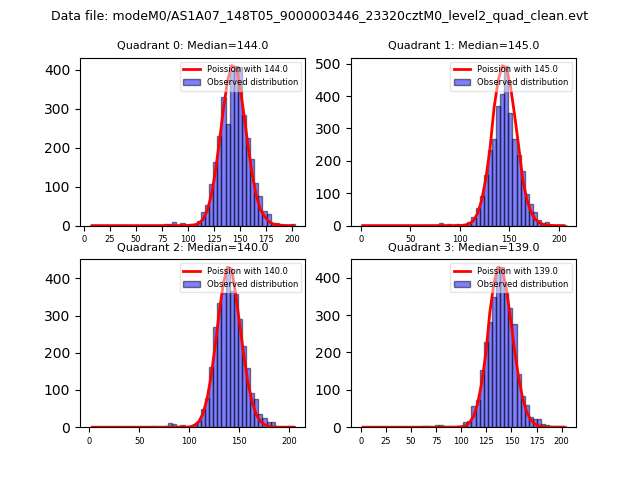 |
 |
| Quadrant-wise count rates Data is divided into 100 sec bins |
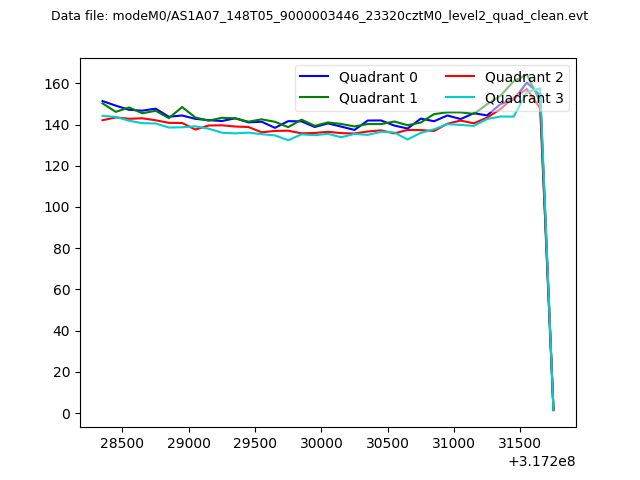 |
|
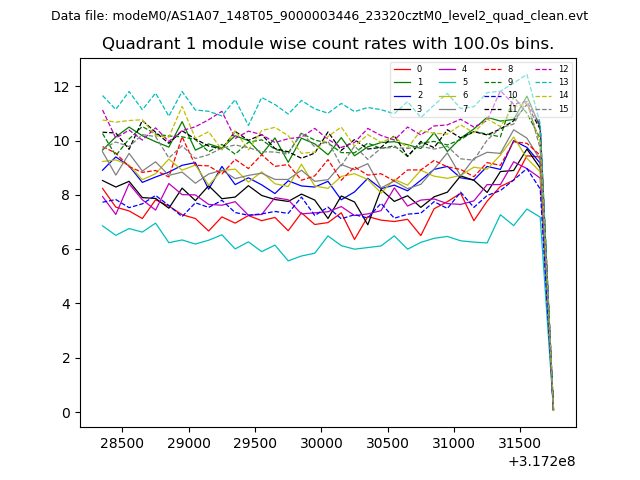
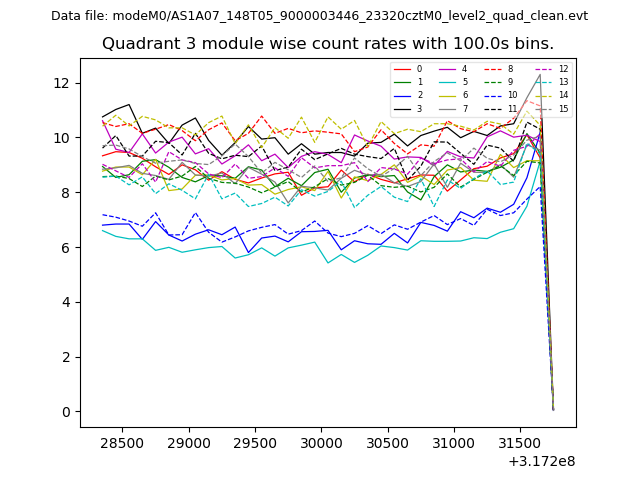
| Module-wise count rates for Quadrant A Data is divided into 100 sec bins |
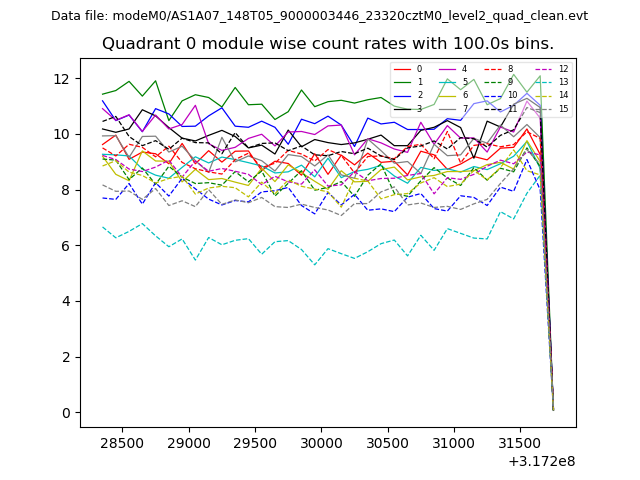 |
 |
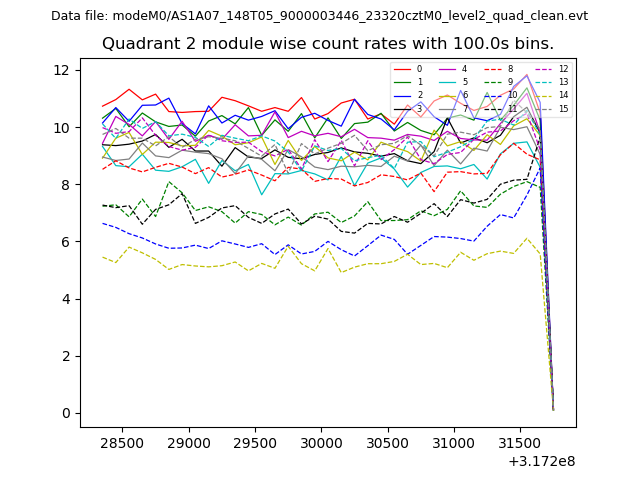
| Module-wise count rates for Quadrant B Data is divided into 100 sec bins |
 |
 |
| Module-wise count rates for Quadrant C Data is divided into 100 sec bins |
 |
 |
| Module-wise count rates for Quadrant D Data is divided into 100 sec bins |
 |
 |
| Parameter | Plot |
|---|---|
| CZT HV Monitor | 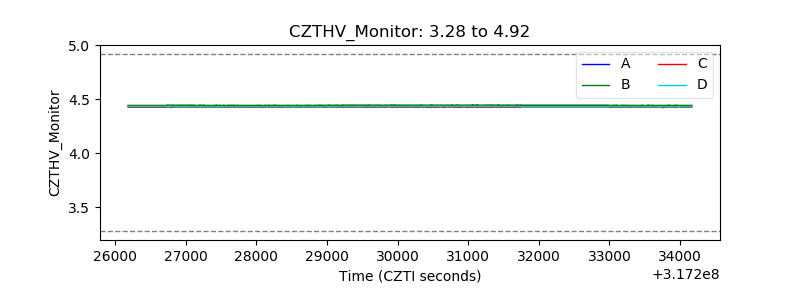 |
| D_VDD | 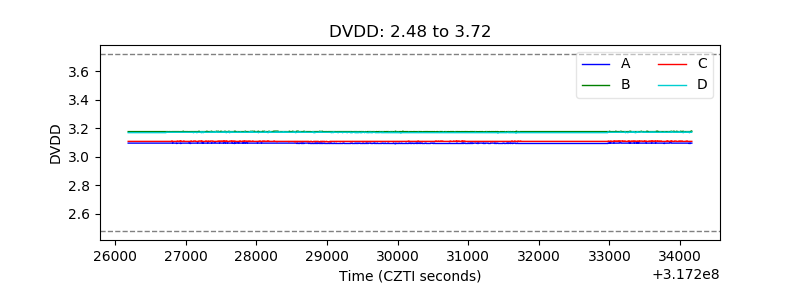 |
| Temperature 1 | 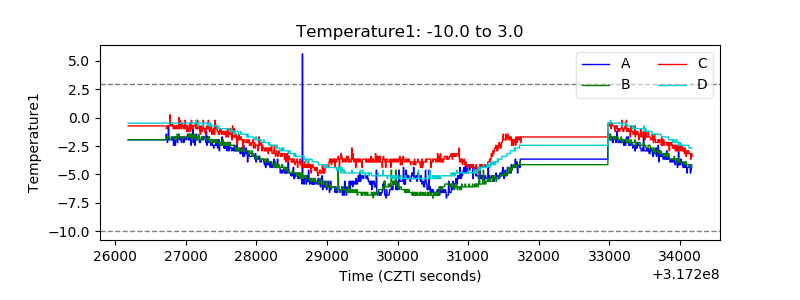 |
| Veto HV Monitor | 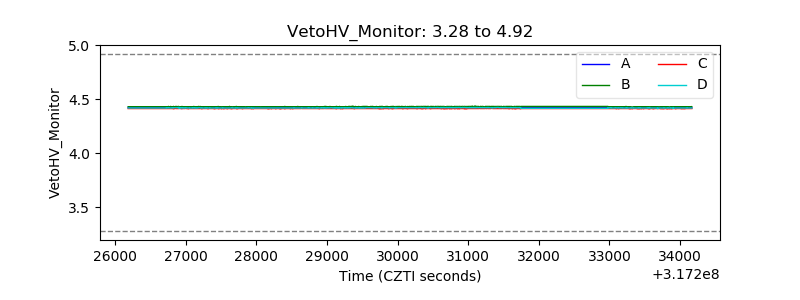 |
| Veto LLD | 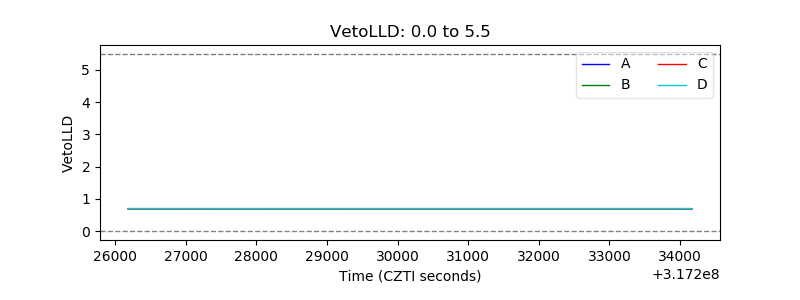 |
| Alpha Counter |  |
| _CPM_Rate | 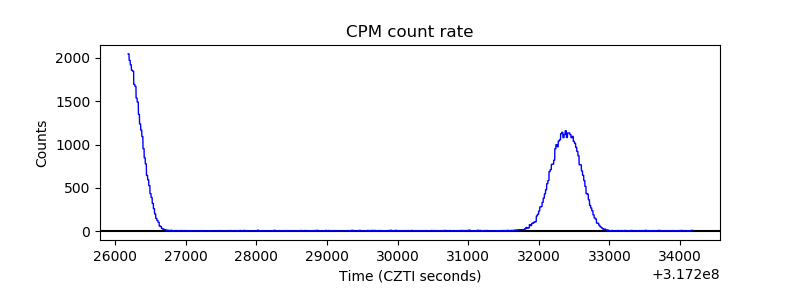 |
| CZT Counter | 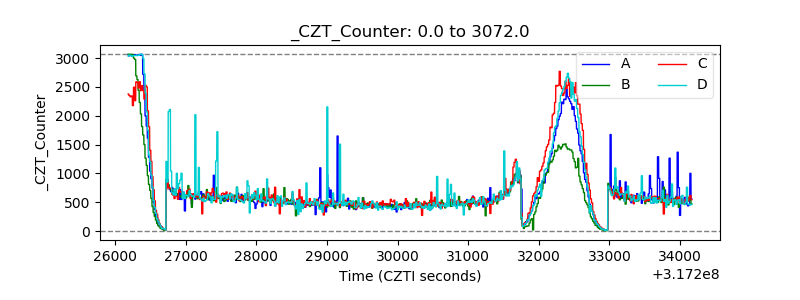 |
| +2.5 Volts monitor |  |
| +5 Volts monitor |  |
| _ROLL_ROT | 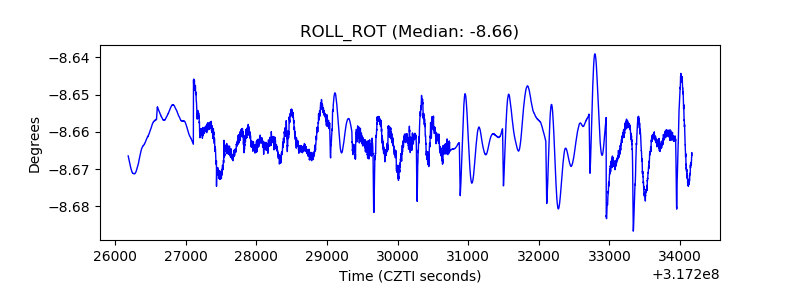 |
| _Roll_DEC |  |
| _Roll_RA | 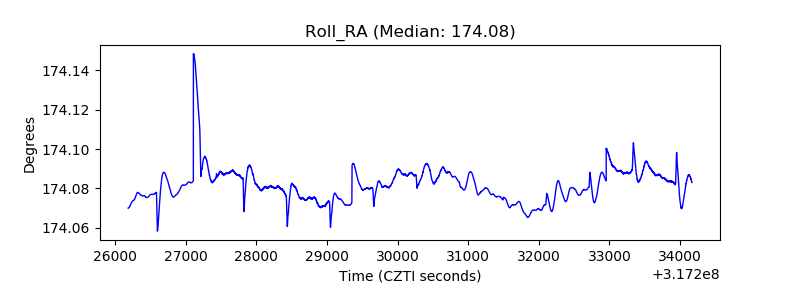 |
| Veto Counter | 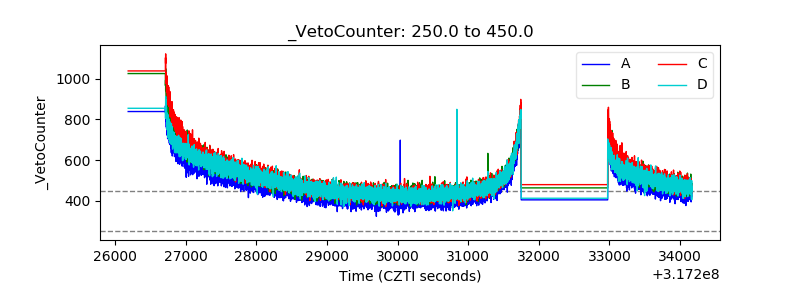 |