| Param | Original file | Final file |
|---|---|---|
| Filename | modeM0/AS1A07_148T05_9000003446_23321cztM0_level2.evt | modeM0/AS1A07_148T05_9000003446_23321cztM0_level2_quad_clean.evt |
| Size (bytes) | 518,322,240 | 88,441,920 |
| Size | 494.3 MB | 84.3 MB |
| Events in quadrant A | 3,648,484 | 561,373 |
| Events in quadrant B | 3,432,346 | 567,604 |
| Events in quadrant C | 4,556,077 | 541,386 |
| Events in quadrant D | 3,606,562 | 541,536 |
| Mode M0 | |||
|---|---|---|---|
| Quadrant | BADHDUFLAG | Total packets | Discarded packets |
| A | 0 | 15136 | 2 |
| B | 0 | 14254 | 2 |
| C | 0 | 17996 | 2 |
| D | 0 | 15093 | 3 |
| Mode SS | |||
|---|---|---|---|
| Quadrant | BADHDUFLAG | Total packets | Discarded packets |
| A | 0 | 138 | 0 |
| B | 0 | 138 | 0 |
| C | 0 | 138 | 0 |
| D | 0 | 138 | 0 |
| Mode M9 | |||
|---|---|---|---|
| Quadrant | BADHDUFLAG | Total packets | Discarded packets |
| A | 0 | 21 | 0 |
| B | 0 | 21 | 0 |
| C | 0 | 21 | 0 |
| D | 0 | 21 | 0 |
| Quadrant | Total seconds | Saturated seconds | Saturation percentage |
|---|---|---|---|
| A | 6688 | 194 | 2.900718% |
| B | 6689 | 150 | 2.242488% |
| C | 6689 | 204 | 3.049783% |
| D | 6688 | 153 | 2.287679% |
Noise dominated data is calculated using 1-second bins in cleaned event files. If a bin has >2000 counts, and if more than 50% of those come from <1% of pixels, then it is considered to be noise-dominated and hence unusable.
| Quadrant | # 1 sec bins | Bins with >0 counts | Bins with >2000 counts | High rate bins dominated by noise | Noise dominated (total time) | Noise dominated (detector-on time) | Marked lightcurve |
|---|---|---|---|---|---|---|---|
| A | 8823 | 6690 | 29 | 29 | 0.33% | 0.43% | 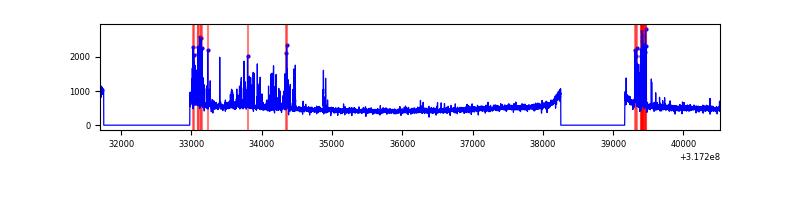 |
| B | 8824 | 6690 | 0 | 0 | 0.00% | 0.00% | 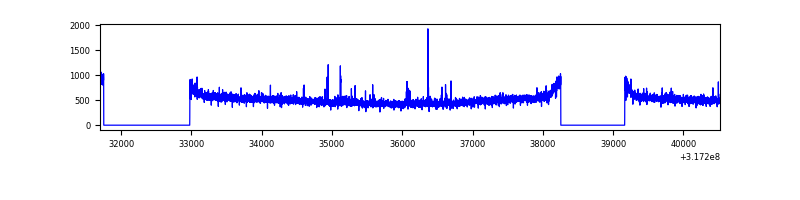 |
| C | 8824 | 6690 | 7 | 7 | 0.08% | 0.10% | 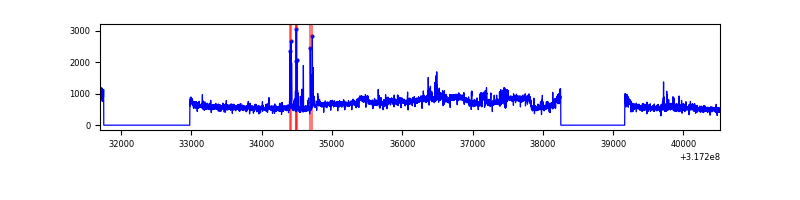 |
| D | 8823 | 6689 | 30 | 30 | 0.34% | 0.45% | 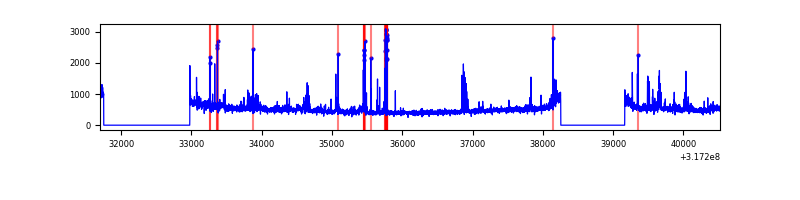 |
Top three noisy pixels from each quadrant. If the there are fewer than three noisy pixels in the level2.evt file, extra rows are filled as -1
| Pixel properties | Quadrant properties | ||||||
|---|---|---|---|---|---|---|---|
| Quadrant | DetID | PixID | Counts | Sigma | Mean | Median | Sigma |
| A | 6 | 16 | 294809 | 1687.44 | 869 | 853 | 174.2 |
| A | 13 | 254 | 11211 | 59.46 | 869 | 853 | 174.2 |
| A | 0 | 226 | 7614 | 38.81 | 869 | 853 | 174.2 |
| B | 12 | 111 | 19692 | 114.07 | 865 | 844 | 165.2 |
| B | 11 | 111 | 17546 | 101.08 | 865 | 844 | 165.2 |
| B | 14 | 111 | 14874 | 84.91 | 865 | 844 | 165.2 |
| C | 10 | 9 | 1017659 | 5204.53 | 837 | 844 | 195.4 |
| C | 14 | 238 | 132041 | 671.53 | 837 | 844 | 195.4 |
| C | 2 | 16 | 78976 | 399.92 | 837 | 844 | 195.4 |
| D | 1 | 52 | 150772 | 718.74 | 856 | 834 | 208.6 |
| D | 13 | 249 | 96917 | 460.58 | 856 | 834 | 208.6 |
| D | 12 | 233 | 76624 | 363.31 | 856 | 834 | 208.6 |
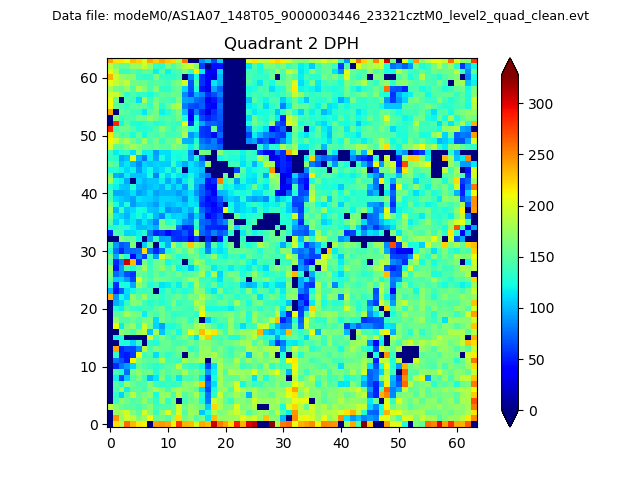
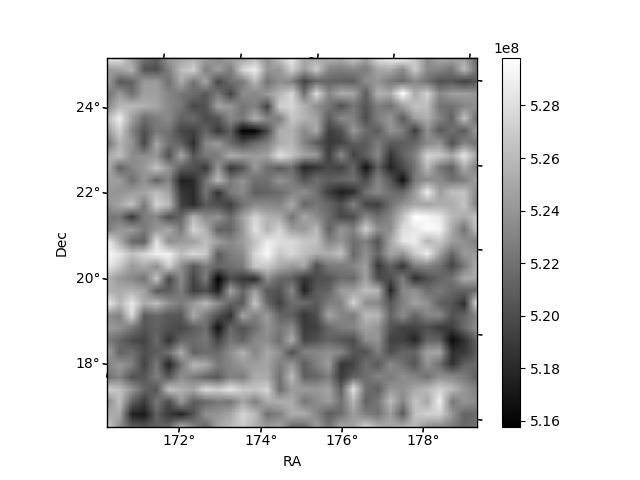
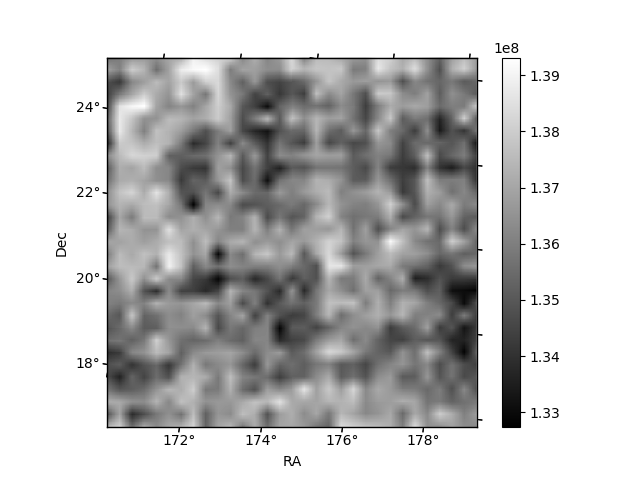
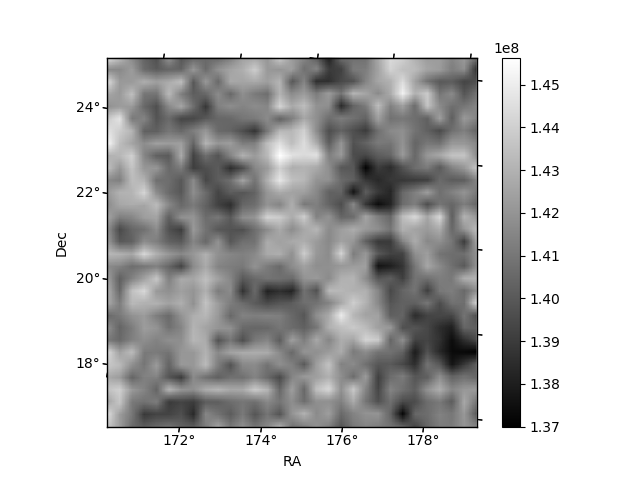
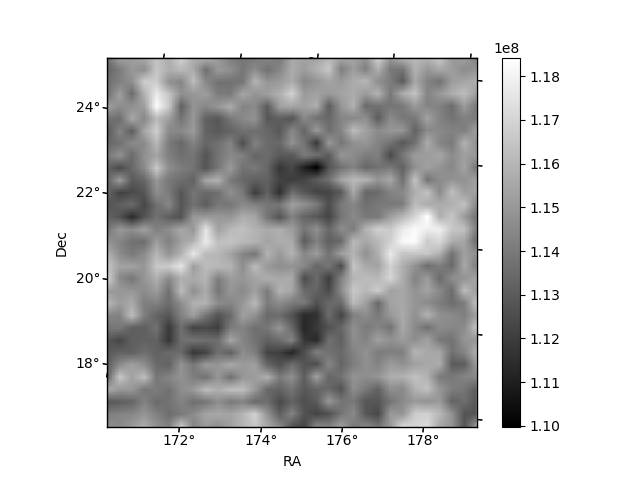
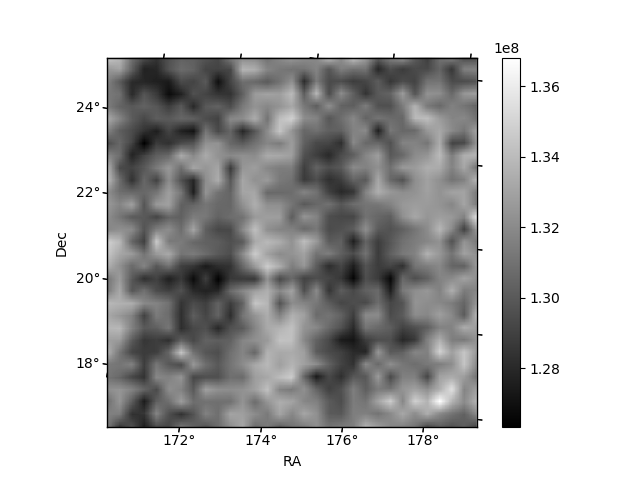
Histogram calculated using DETX and DETY for each event in the final _common_clean file
| Quadrant A | 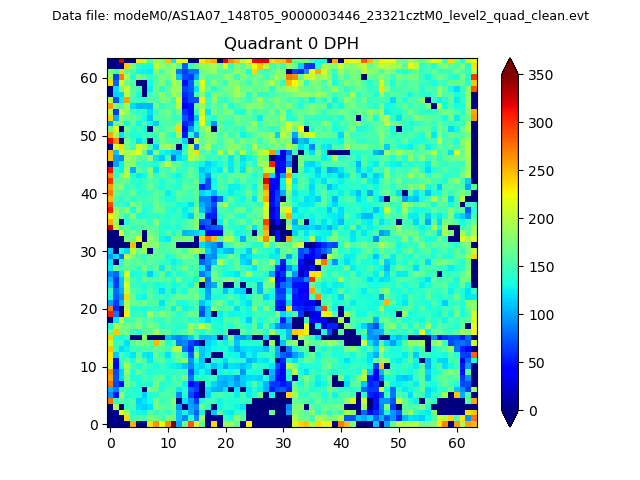 |
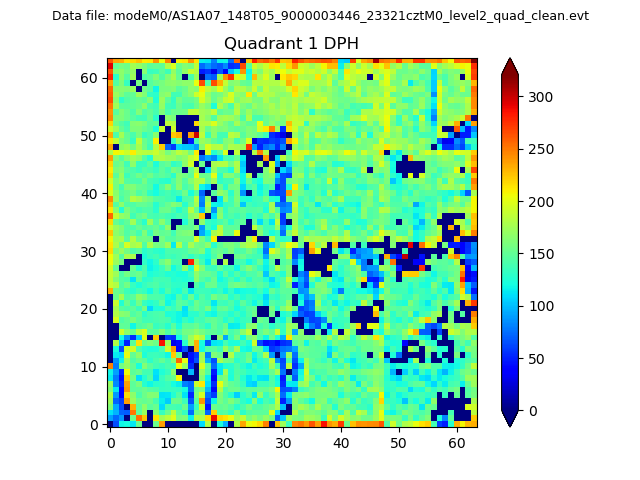 |
Quadrant B |
|---|---|---|---|
| Quadrant D | 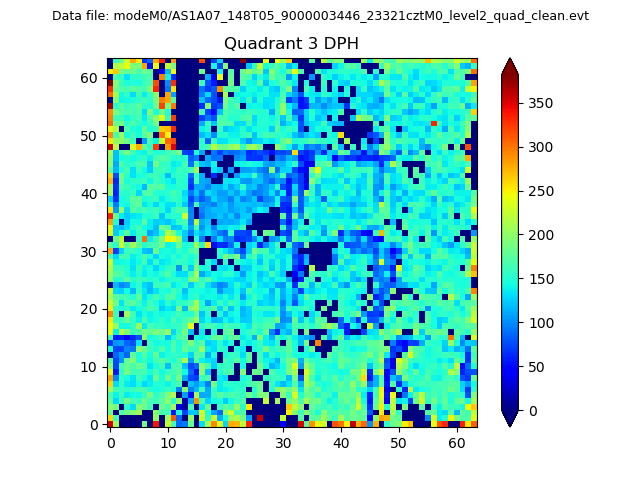 |
 |
Quadrant C |
| Plot type | Count rate plots | Images |
|---|---|---|
| Comparison with Poisson distribution Blue bars denote a histogram of data divided into 1 sec bins. Red curve is a Poisson curve with rate = median count rate of data. |
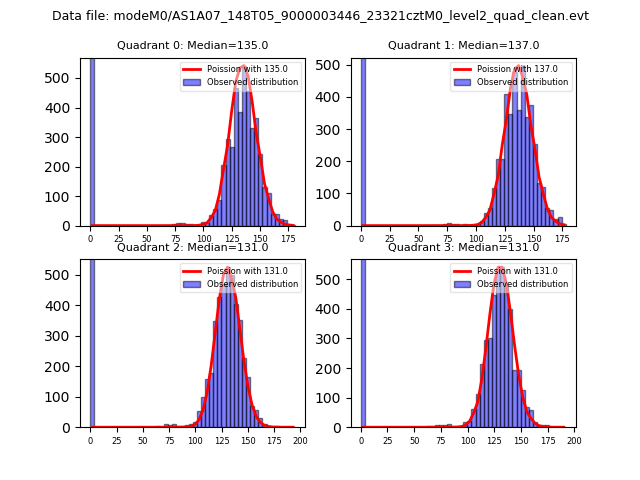 |
 |
| Quadrant-wise count rates Data is divided into 100 sec bins |
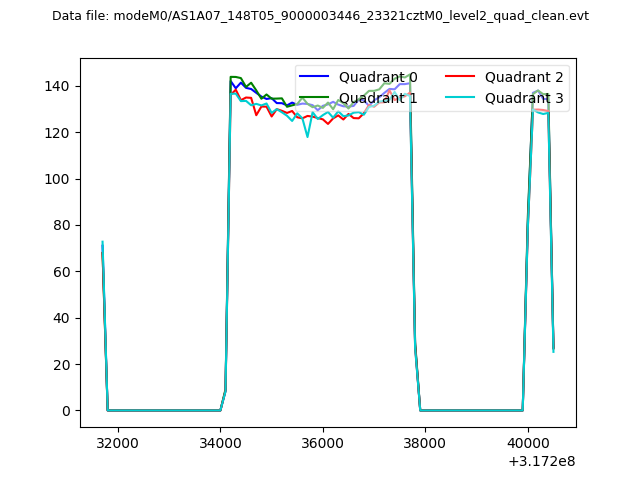 |
|
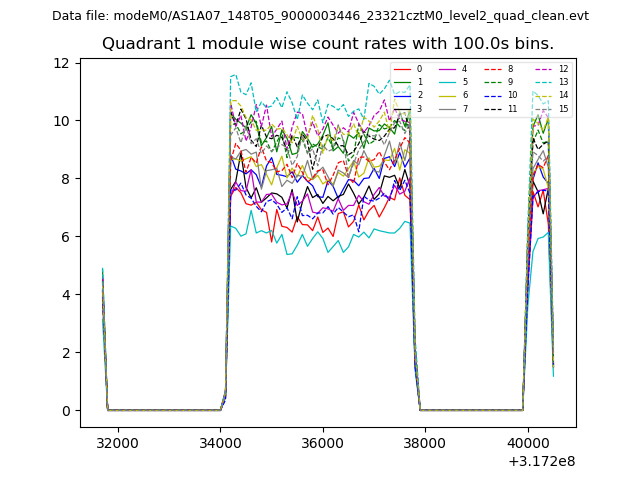
| Module-wise count rates for Quadrant A Data is divided into 100 sec bins |
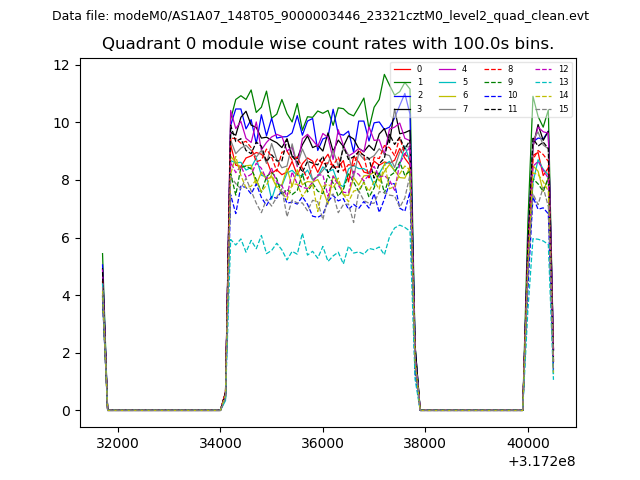 |
 |
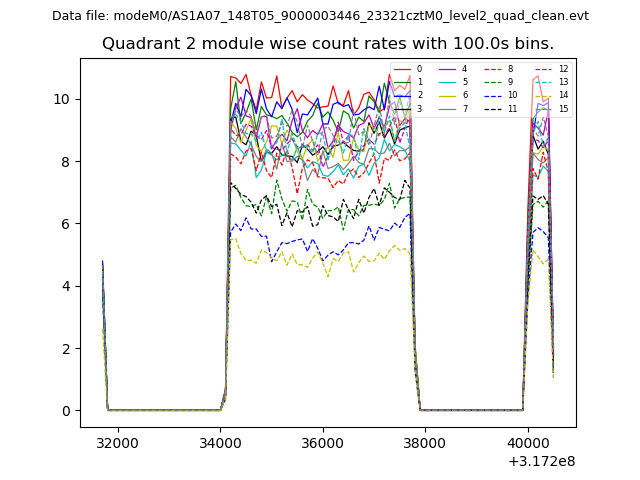
| Module-wise count rates for Quadrant B Data is divided into 100 sec bins |
 |
 |
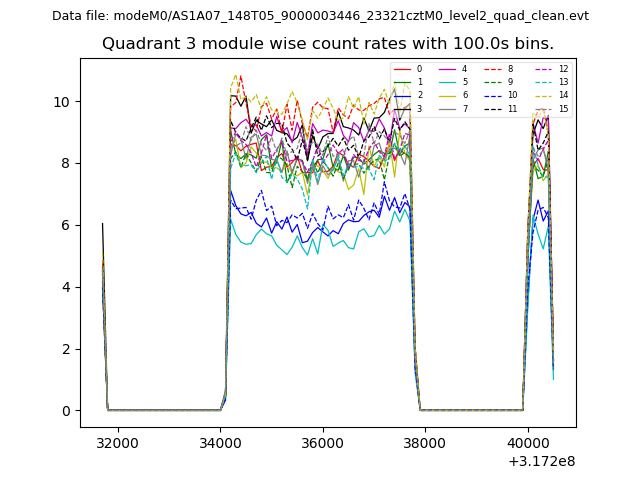
| Module-wise count rates for Quadrant C Data is divided into 100 sec bins |
 |
 |
| Module-wise count rates for Quadrant D Data is divided into 100 sec bins |
 |
 |
| Parameter | Plot |
|---|---|
| CZT HV Monitor | 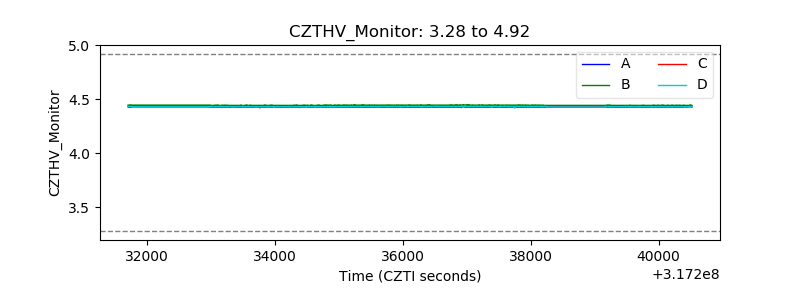 |
| D_VDD | 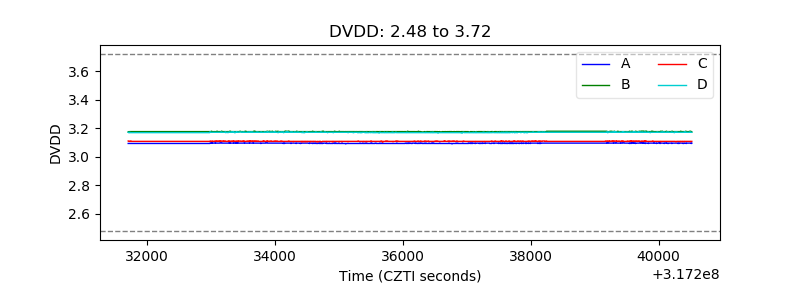 |
| Temperature 1 | 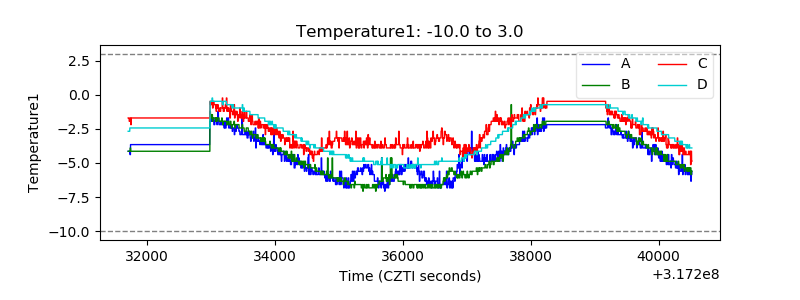 |
| Veto HV Monitor | 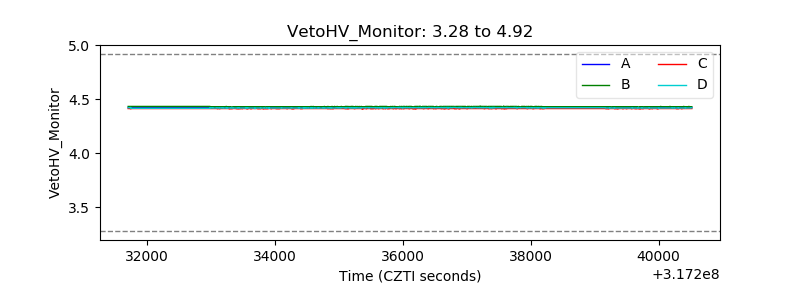 |
| Veto LLD | 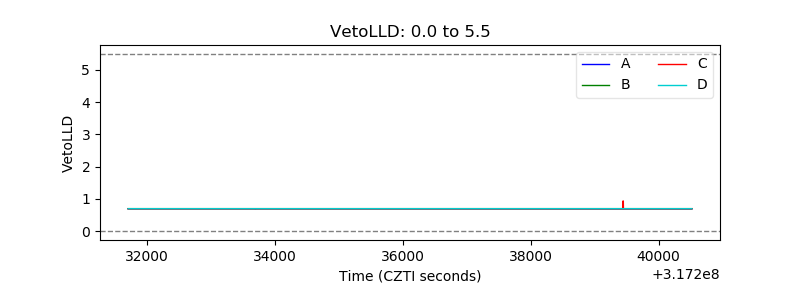 |
| Alpha Counter | 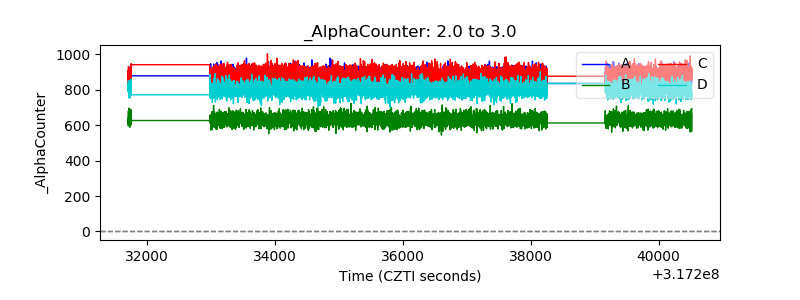 |
| _CPM_Rate | 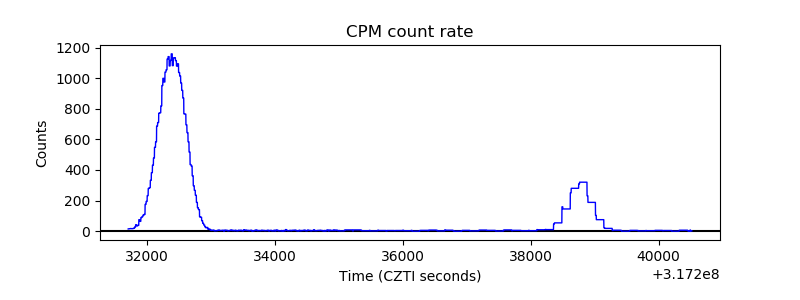 |
| CZT Counter | 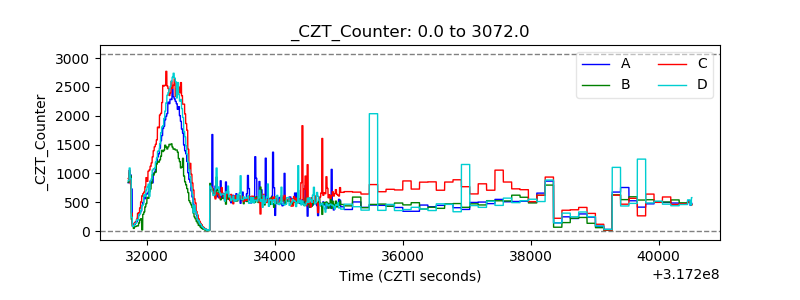 |
| +2.5 Volts monitor |  |
| +5 Volts monitor |  |
| _ROLL_ROT | 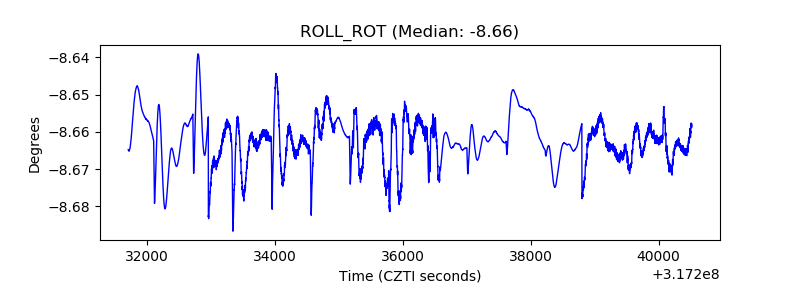 |
| _Roll_DEC | 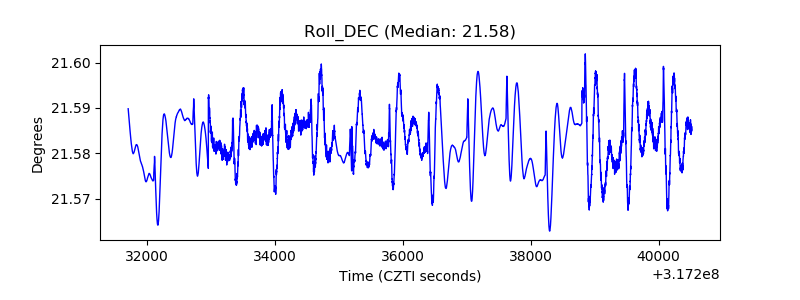 |
| _Roll_RA | 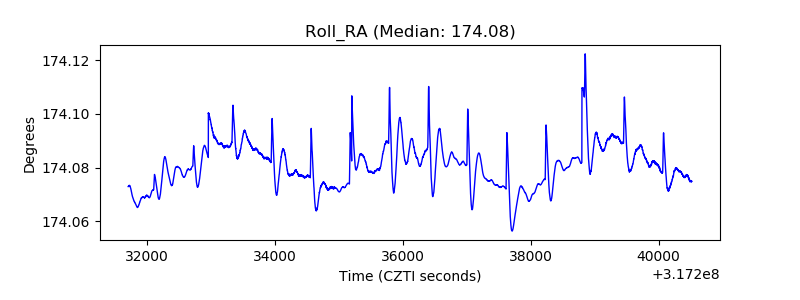 |
| Veto Counter | 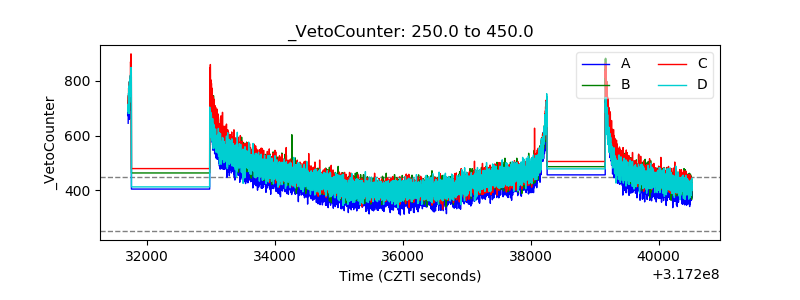 |