| Param | Original file | Final file |
|---|---|---|
| Filename | modeM0/AS1A07_148T05_9000003446_23322cztM0_level2.evt | modeM0/AS1A07_148T05_9000003446_23322cztM0_level2_quad_clean.evt |
| Size (bytes) | 488,554,560 | 93,312,000 |
| Size | 465.9 MB | 89.0 MB |
| Events in quadrant A | 3,630,612 | 591,605 |
| Events in quadrant B | 3,571,190 | 595,255 |
| Events in quadrant C | 3,567,523 | 574,589 |
| Events in quadrant D | 3,542,593 | 568,422 |
| Mode M0 | |||
|---|---|---|---|
| Quadrant | BADHDUFLAG | Total packets | Discarded packets |
| A | 0 | 15367 | 2 |
| B | 0 | 15056 | 2 |
| C | 0 | 15113 | 3 |
| D | 0 | 15323 | 2 |
| Mode SS | |||
|---|---|---|---|
| Quadrant | BADHDUFLAG | Total packets | Discarded packets |
| A | 0 | 144 | 0 |
| B | 0 | 144 | 0 |
| C | 0 | 144 | 0 |
| D | 0 | 144 | 0 |
| Mode M9 | |||
|---|---|---|---|
| Quadrant | BADHDUFLAG | Total packets | Discarded packets |
| A | 0 | 8 | 0 |
| B | 0 | 9 | 0 |
| C | 0 | 9 | 0 |
| D | 0 | 9 | 0 |
| Quadrant | Total seconds | Saturated seconds | Saturation percentage |
|---|---|---|---|
| A | 7125 | 111 | 1.557895% |
| B | 7125 | 130 | 1.824561% |
| C | 7124 | 144 | 2.021336% |
| D | 7124 | 65 | 0.912409% |
Noise dominated data is calculated using 1-second bins in cleaned event files. If a bin has >2000 counts, and if more than 50% of those come from <1% of pixels, then it is considered to be noise-dominated and hence unusable.
| Quadrant | # 1 sec bins | Bins with >0 counts | Bins with >2000 counts | High rate bins dominated by noise | Noise dominated (total time) | Noise dominated (detector-on time) | Marked lightcurve |
|---|---|---|---|---|---|---|---|
| A | 7665 | 7126 | 21 | 21 | 0.27% | 0.29% | 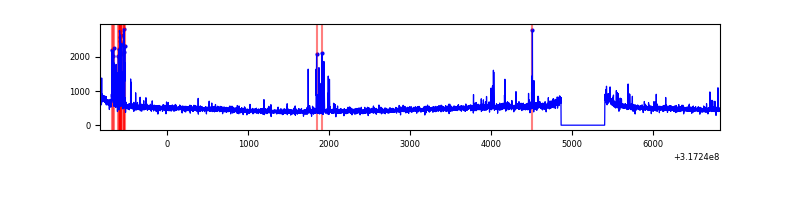 |
| B | 7665 | 7126 | 4 | 4 | 0.05% | 0.06% | 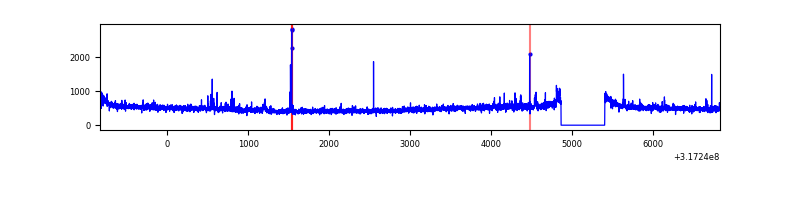 |
| C | 7664 | 7125 | 1 | 1 | 0.01% | 0.01% | 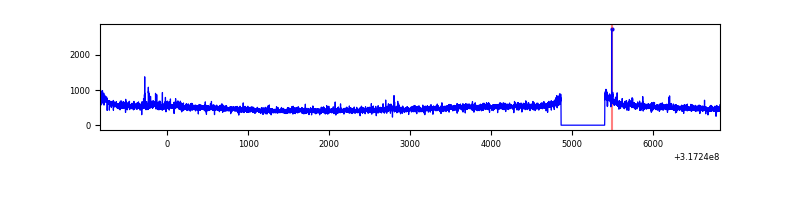 |
| D | 7664 | 7125 | 13 | 13 | 0.17% | 0.18% | 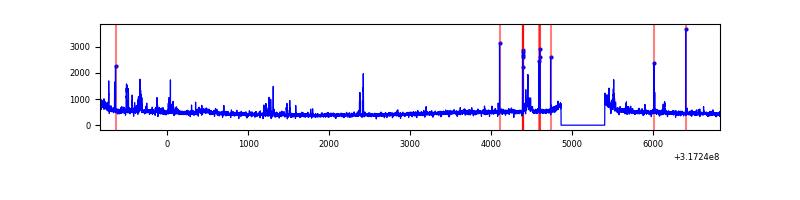 |
Top three noisy pixels from each quadrant. If the there are fewer than three noisy pixels in the level2.evt file, extra rows are filled as -1
| Pixel properties | Quadrant properties | ||||||
|---|---|---|---|---|---|---|---|
| Quadrant | DetID | PixID | Counts | Sigma | Mean | Median | Sigma |
| A | 6 | 16 | 183408 | 1008.46 | 894 | 876 | 181.0 |
| A | 13 | 254 | 11229 | 57.2 | 894 | 876 | 181.0 |
| A | 3 | 137 | 8094 | 39.88 | 894 | 876 | 181.0 |
| B | 0 | 190 | 27170 | 154.1 | 890 | 866 | 170.7 |
| B | 0 | 229 | 22640 | 127.56 | 890 | 866 | 170.7 |
| B | 12 | 111 | 20631 | 115.79 | 890 | 866 | 170.7 |
| C | 14 | 238 | 136310 | 676.31 | 859 | 864 | 200.3 |
| C | 7 | 247 | 58219 | 286.38 | 859 | 864 | 200.3 |
| C | 10 | 9 | 14659 | 68.88 | 859 | 864 | 200.3 |
| D | 1 | 52 | 97967 | 458.12 | 874 | 850 | 212.0 |
| D | 13 | 104 | 61273 | 285.03 | 874 | 850 | 212.0 |
| D | 12 | 233 | 47925 | 222.06 | 874 | 850 | 212.0 |
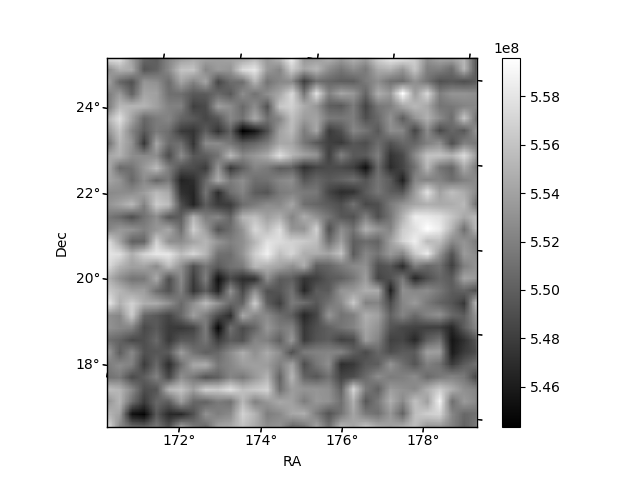
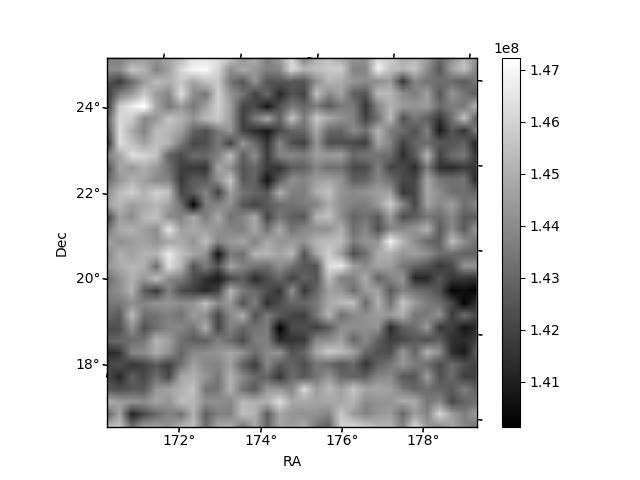
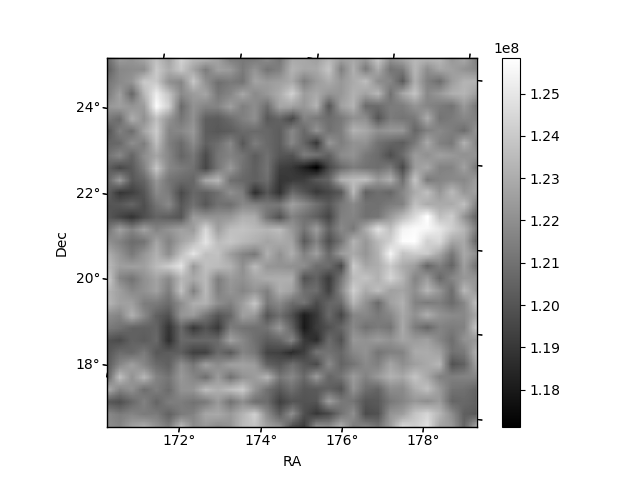
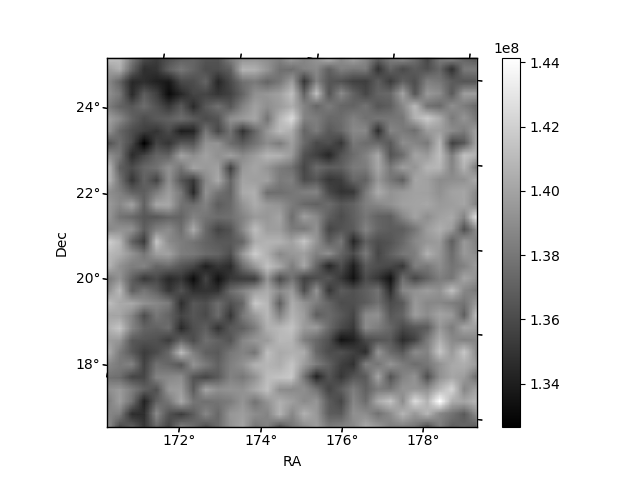
Histogram calculated using DETX and DETY for each event in the final _common_clean file
| Quadrant A | 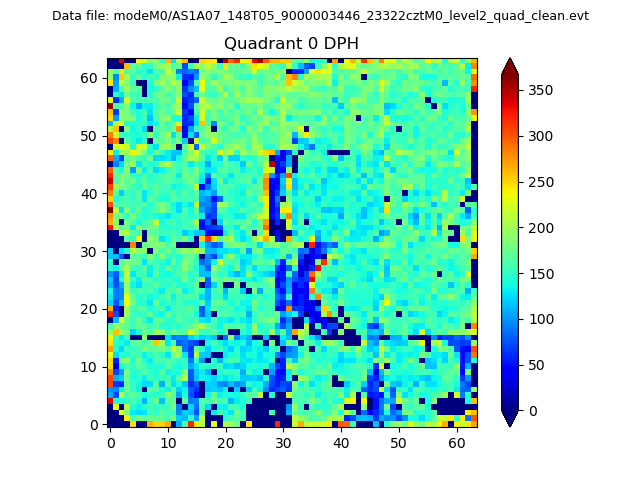 |
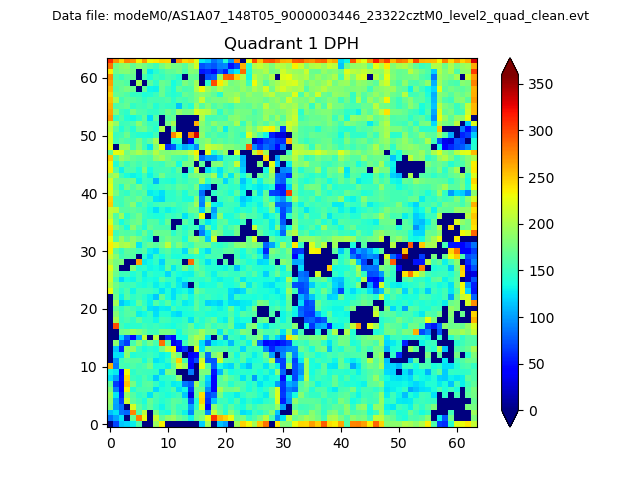 |
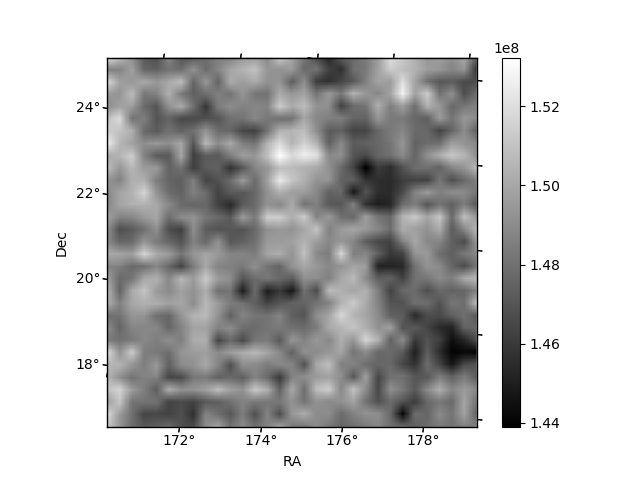
Quadrant B |
|---|---|---|---|
| Quadrant D | 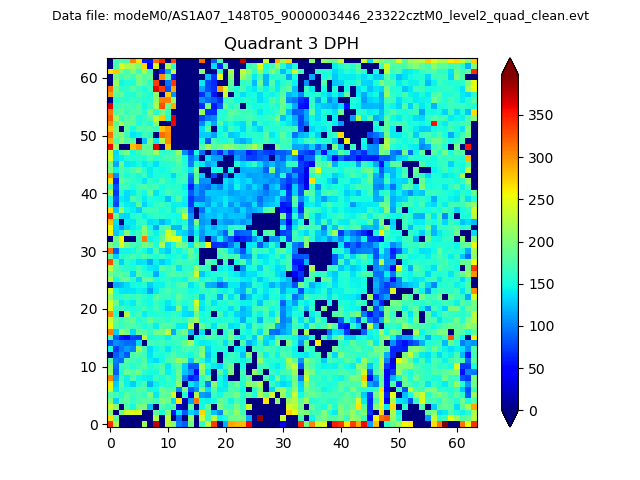 |
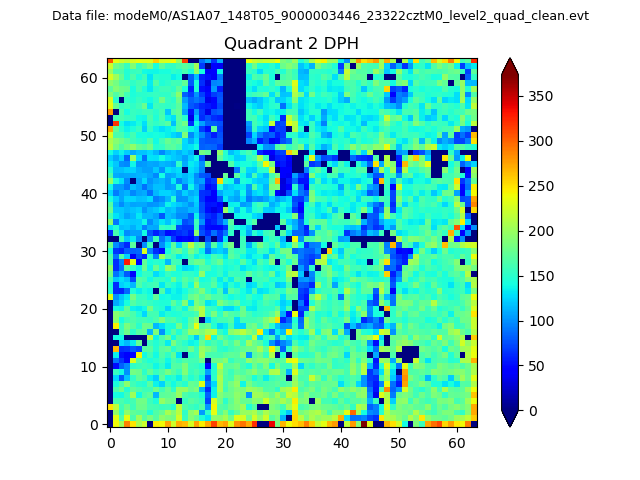 |
Quadrant C |
| Plot type | Count rate plots | Images |
|---|---|---|
| Comparison with Poisson distribution Blue bars denote a histogram of data divided into 1 sec bins. Red curve is a Poisson curve with rate = median count rate of data. |
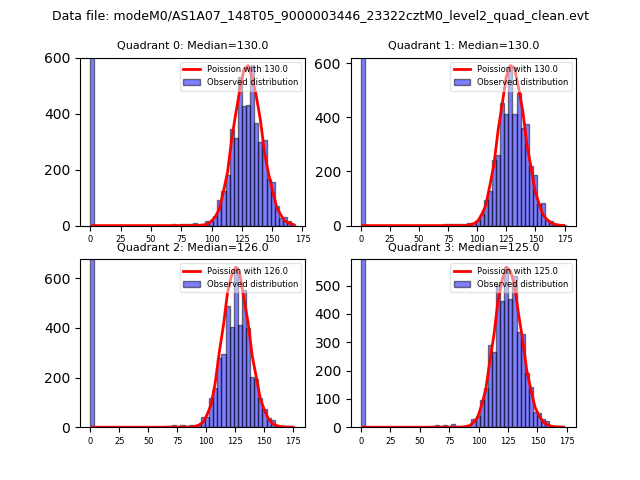 |
 |
| Quadrant-wise count rates Data is divided into 100 sec bins |
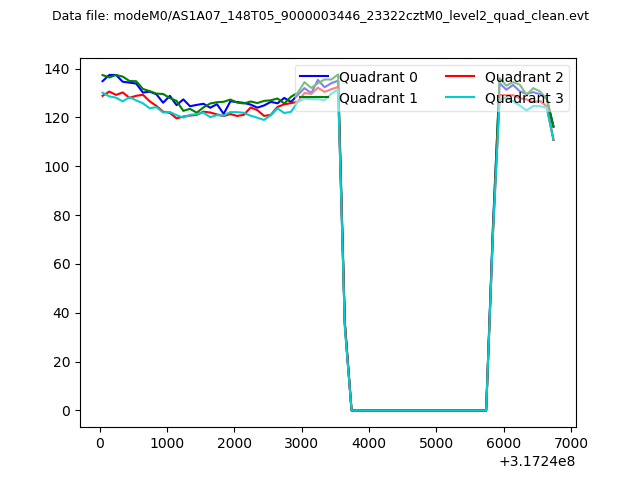 |
|
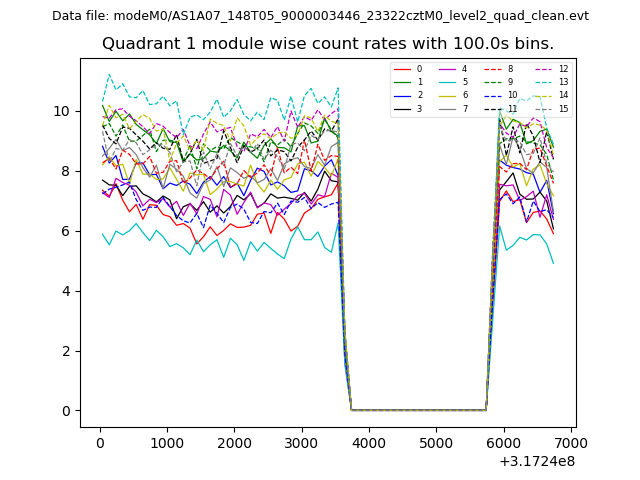
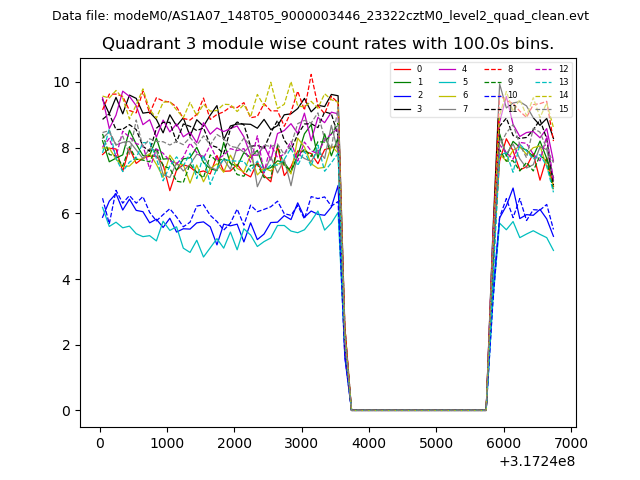
| Module-wise count rates for Quadrant A Data is divided into 100 sec bins |
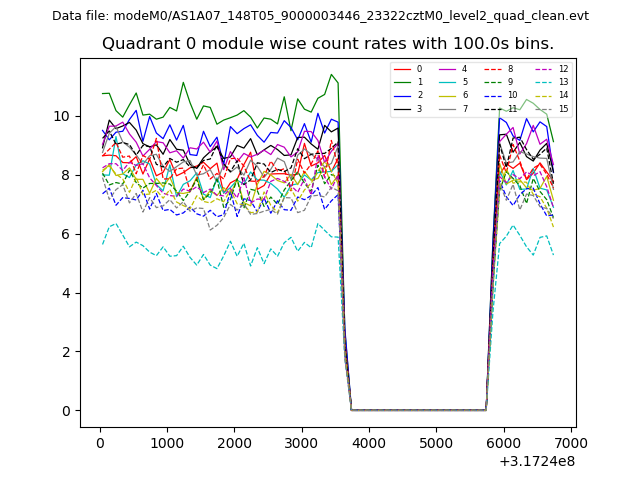 |
 |
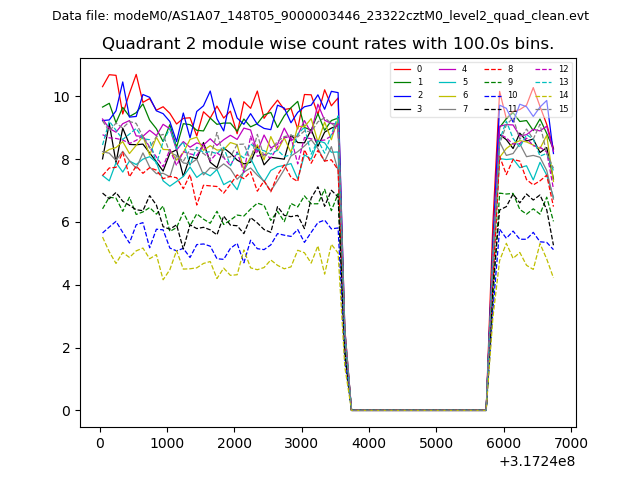
| Module-wise count rates for Quadrant B Data is divided into 100 sec bins |
 |
 |
| Module-wise count rates for Quadrant C Data is divided into 100 sec bins |
 |
 |
| Module-wise count rates for Quadrant D Data is divided into 100 sec bins |
 |
 |
| Parameter | Plot |
|---|---|
| CZT HV Monitor | 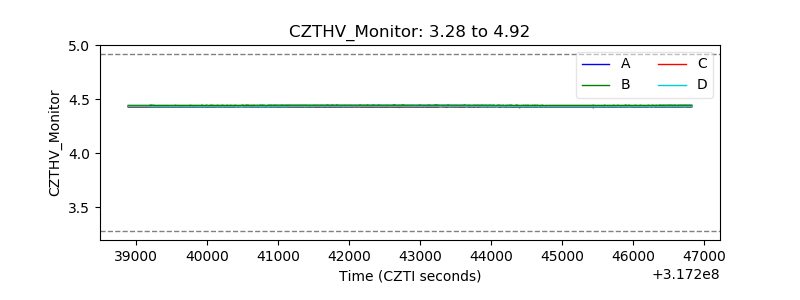 |
| D_VDD | 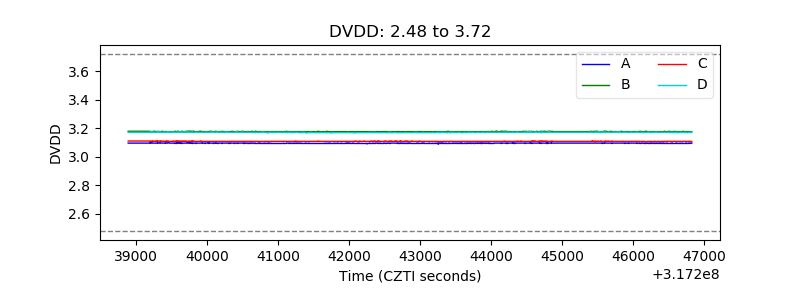 |
| Temperature 1 | 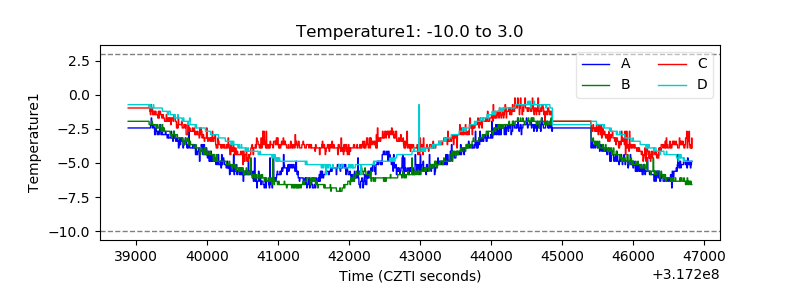 |
| Veto HV Monitor | 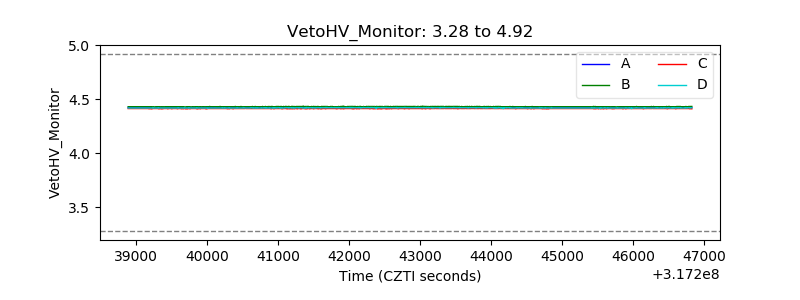 |
| Veto LLD | 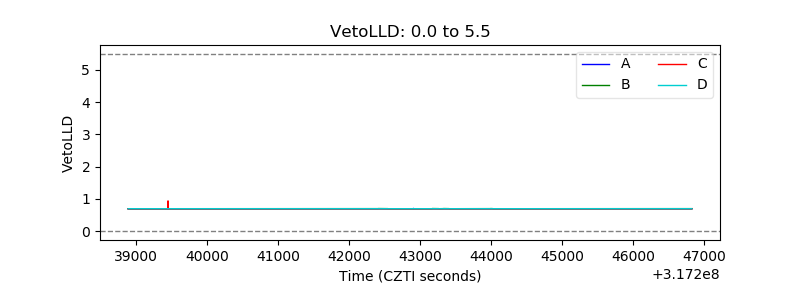 |
| Alpha Counter | 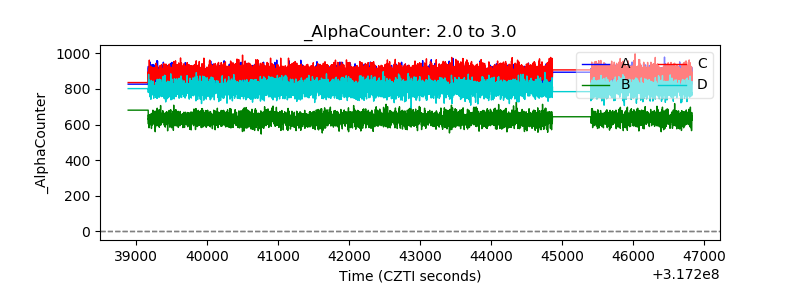 |
| _CPM_Rate | 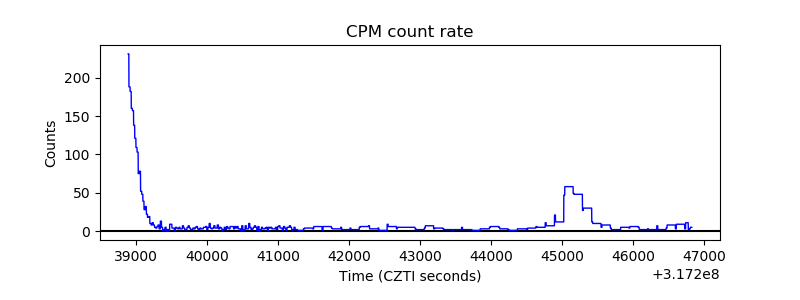 |
| CZT Counter | 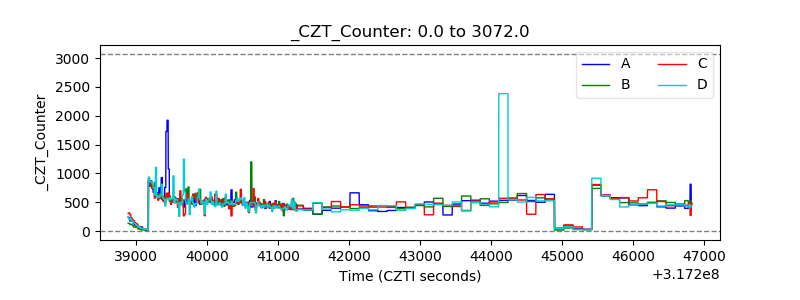 |
| +2.5 Volts monitor |  |
| +5 Volts monitor |  |
| _ROLL_ROT | 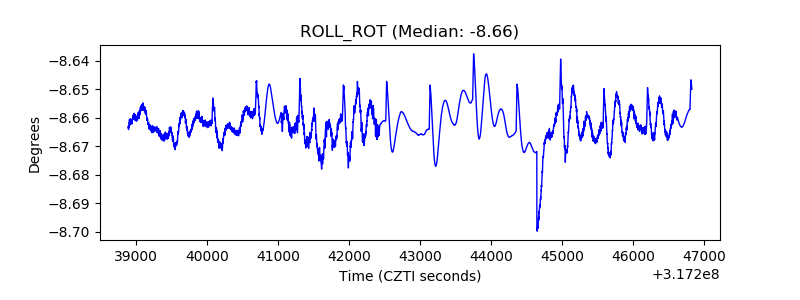 |
| _Roll_DEC | 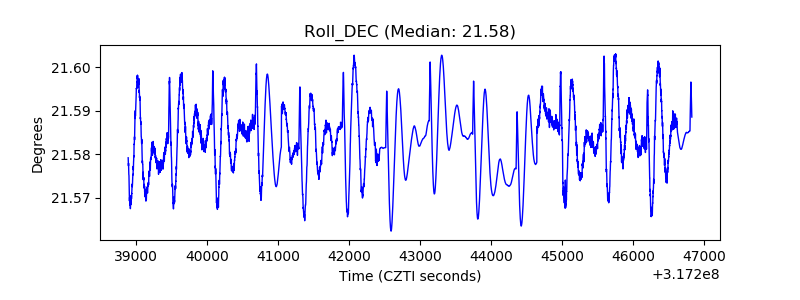 |
| _Roll_RA | 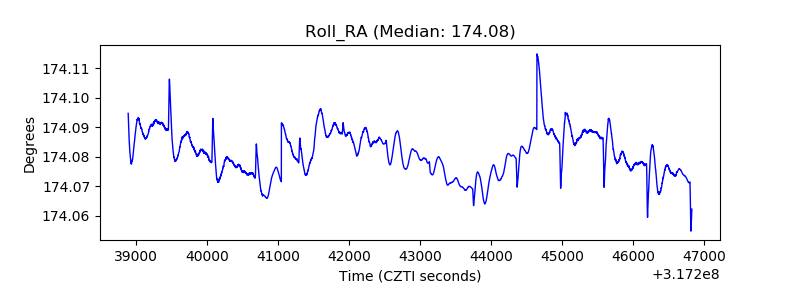 |
| Veto Counter | 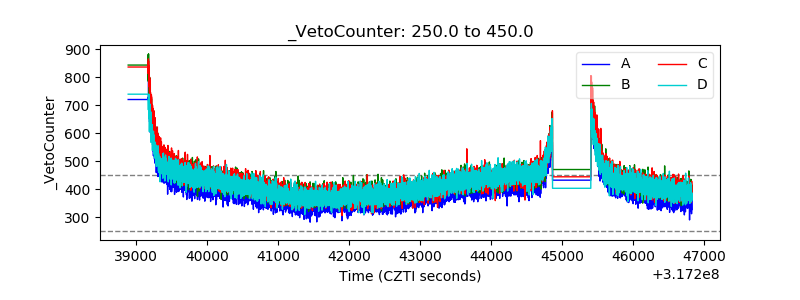 |