| Param | Original file | Final file |
|---|---|---|
| Filename | modeM0/AS1A07_148T05_9000003446_23323cztM0_level2.evt | modeM0/AS1A07_148T05_9000003446_23323cztM0_level2_quad_clean.evt |
| Size (bytes) | 571,314,240 | 100,923,840 |
| Size | 544.8 MB | 96.2 MB |
| Events in quadrant A | 4,090,657 | 627,400 |
| Events in quadrant B | 4,199,666 | 635,855 |
| Events in quadrant C | 4,171,215 | 612,635 |
| Events in quadrant D | 4,280,019 | 606,667 |
| Mode M0 | |||
|---|---|---|---|
| Quadrant | BADHDUFLAG | Total packets | Discarded packets |
| A | 0 | 17527 | 3 |
| B | 0 | 17703 | 2 |
| C | 0 | 17575 | 2 |
| D | 0 | 18353 | 2 |
| Mode SS | |||
|---|---|---|---|
| Quadrant | BADHDUFLAG | Total packets | Discarded packets |
| A | 0 | 168 | 0 |
| B | 0 | 168 | 0 |
| C | 0 | 168 | 0 |
| D | 0 | 168 | 0 |
| Mode M9 | |||
|---|---|---|---|
| Quadrant | BADHDUFLAG | Total packets | Discarded packets |
| A | 0 | 8 | 0 |
| B | 0 | 8 | 0 |
| C | 0 | 8 | 0 |
| D | 0 | 8 | 0 |
| Quadrant | Total seconds | Saturated seconds | Saturation percentage |
|---|---|---|---|
| A | 8263 | 116 | 1.403848% |
| B | 8264 | 185 | 2.238625% |
| C | 8264 | 214 | 2.589545% |
| D | 8264 | 111 | 1.343175% |
Noise dominated data is calculated using 1-second bins in cleaned event files. If a bin has >2000 counts, and if more than 50% of those come from <1% of pixels, then it is considered to be noise-dominated and hence unusable.
| Quadrant | # 1 sec bins | Bins with >0 counts | Bins with >2000 counts | High rate bins dominated by noise | Noise dominated (total time) | Noise dominated (detector-on time) | Marked lightcurve |
|---|---|---|---|---|---|---|---|
| A | 9068 | 8265 | 1 | 1 | 0.01% | 0.01% |  |
| B | 9069 | 8266 | 3 | 3 | 0.03% | 0.04% | 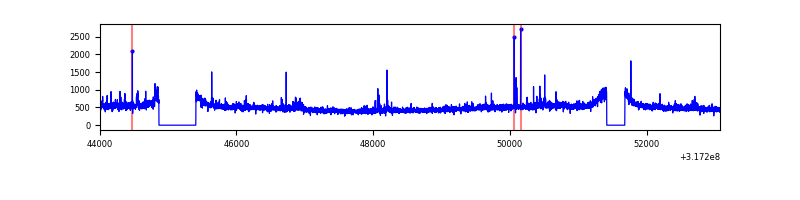 |
| C | 9069 | 8266 | 1 | 1 | 0.01% | 0.01% | 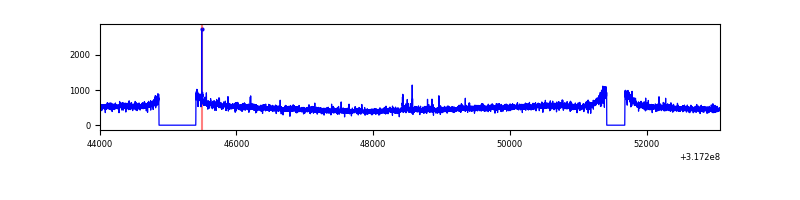 |
| D | 9069 | 8266 | 41 | 41 | 0.45% | 0.50% | 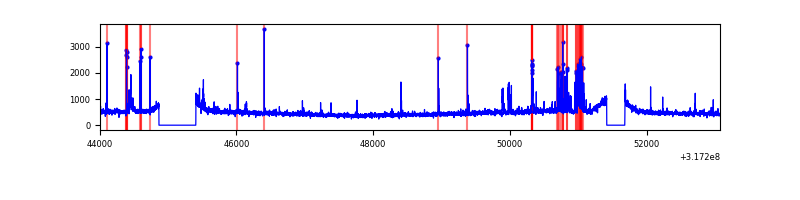 |
Top three noisy pixels from each quadrant. If the there are fewer than three noisy pixels in the level2.evt file, extra rows are filled as -1
| Pixel properties | Quadrant properties | ||||||
|---|---|---|---|---|---|---|---|
| Quadrant | DetID | PixID | Counts | Sigma | Mean | Median | Sigma |
| A | 6 | 16 | 47925 | 221.43 | 1048 | 1023 | 211.8 |
| A | 13 | 254 | 12226 | 52.89 | 1048 | 1023 | 211.8 |
| A | 3 | 137 | 9614 | 40.56 | 1048 | 1023 | 211.8 |
| B | 0 | 230 | 34546 | 166.6 | 1042 | 1013 | 201.3 |
| B | 0 | 190 | 33875 | 163.27 | 1042 | 1013 | 201.3 |
| B | 12 | 111 | 24886 | 118.61 | 1042 | 1013 | 201.3 |
| C | 14 | 238 | 156571 | 658.0 | 1005 | 1009 | 236.4 |
| C | 7 | 247 | 61448 | 255.64 | 1005 | 1009 | 236.4 |
| C | 10 | 9 | 19164 | 76.79 | 1005 | 1009 | 236.4 |
| D | 1 | 52 | 112068 | 442.06 | 1023 | 993 | 251.3 |
| D | 12 | 233 | 111180 | 438.52 | 1023 | 993 | 251.3 |
| D | 13 | 104 | 93395 | 367.74 | 1023 | 993 | 251.3 |
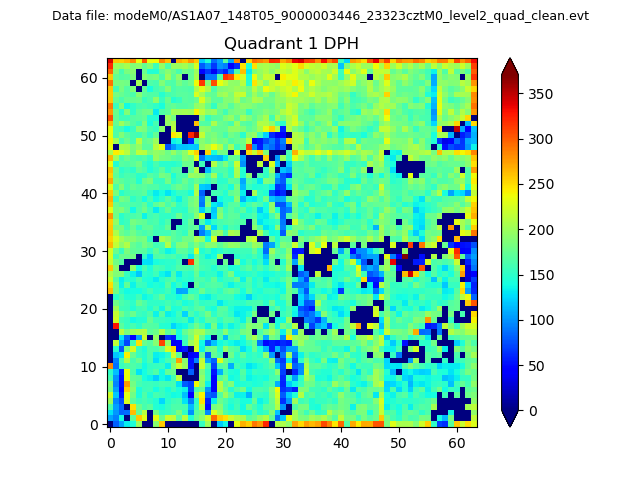
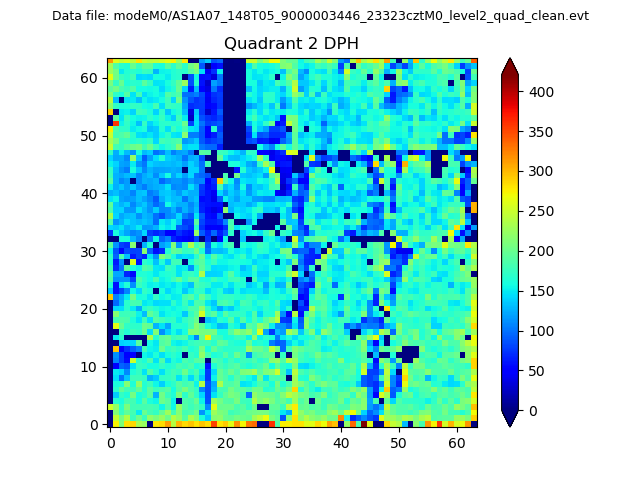
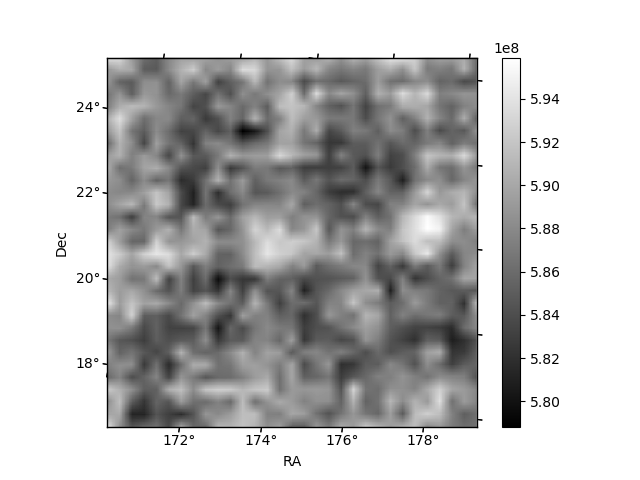
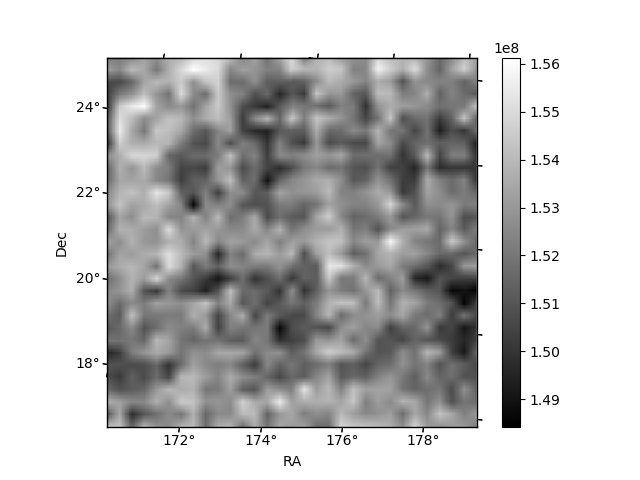
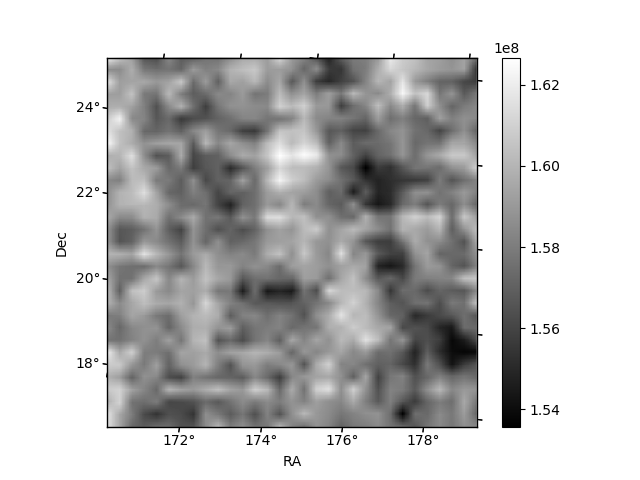
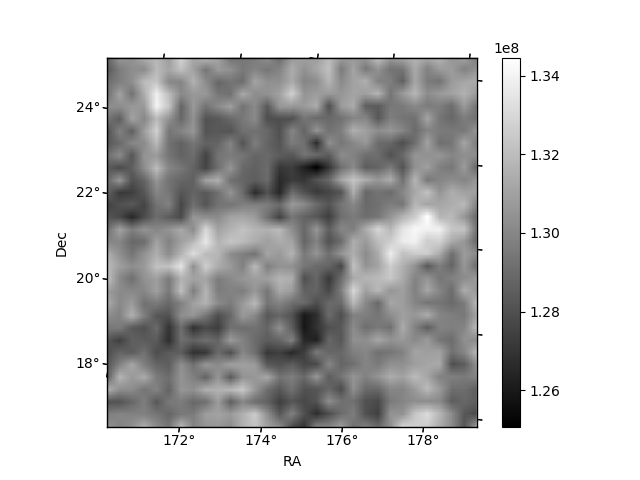
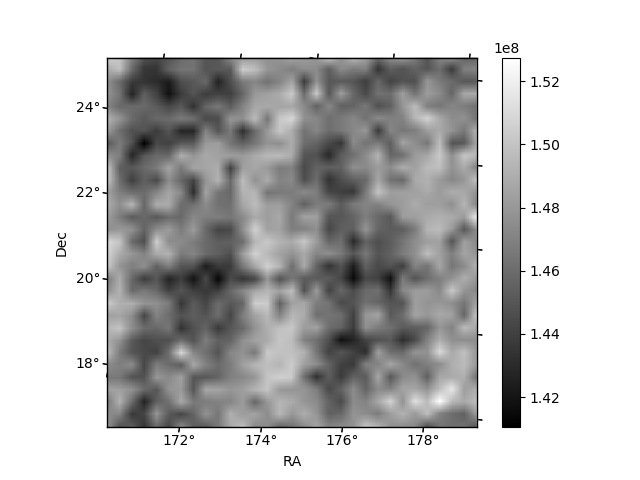
Histogram calculated using DETX and DETY for each event in the final _common_clean file
| Quadrant A | 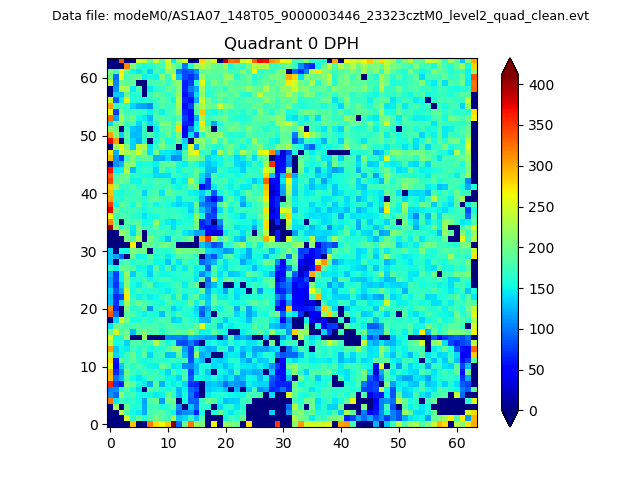 |
 |
Quadrant B |
|---|---|---|---|
| Quadrant D | 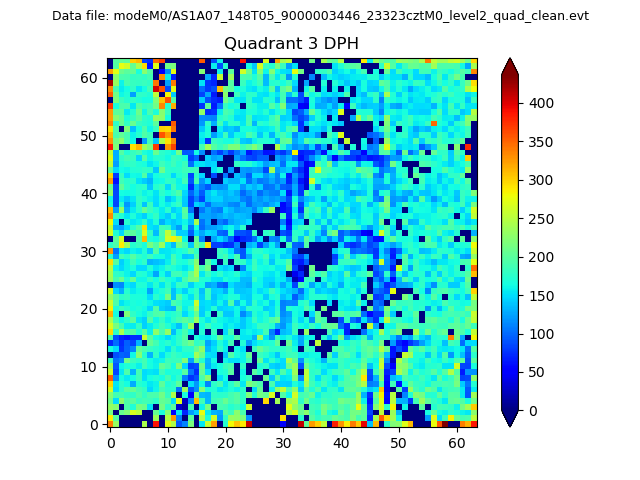 |
 |
Quadrant C |
| Plot type | Count rate plots | Images |
|---|---|---|
| Comparison with Poisson distribution Blue bars denote a histogram of data divided into 1 sec bins. Red curve is a Poisson curve with rate = median count rate of data. |
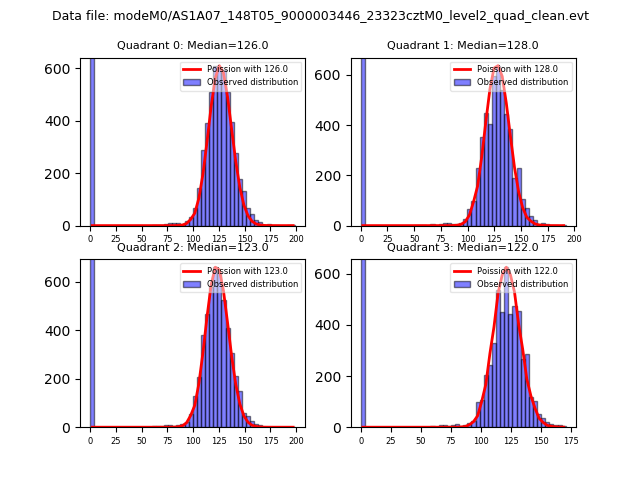 |
 |
| Quadrant-wise count rates Data is divided into 100 sec bins |
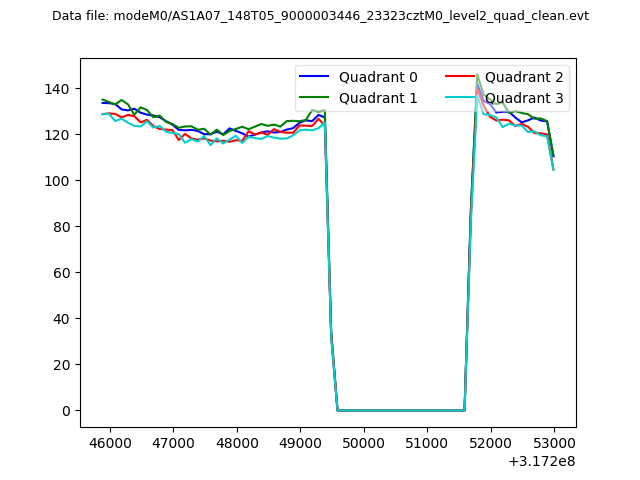 |
|
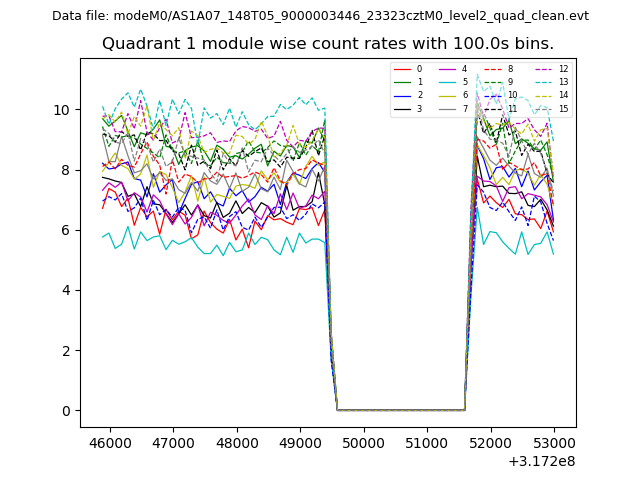
| Module-wise count rates for Quadrant A Data is divided into 100 sec bins |
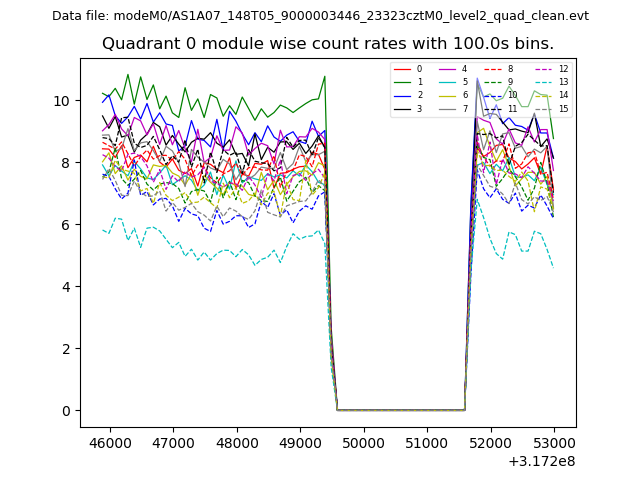 |
 |
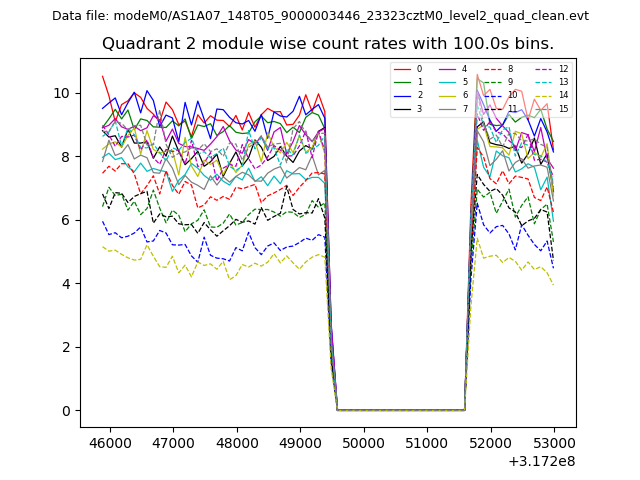
| Module-wise count rates for Quadrant B Data is divided into 100 sec bins |
 |
 |
| Module-wise count rates for Quadrant C Data is divided into 100 sec bins |
 |
 |
| Module-wise count rates for Quadrant D Data is divided into 100 sec bins |
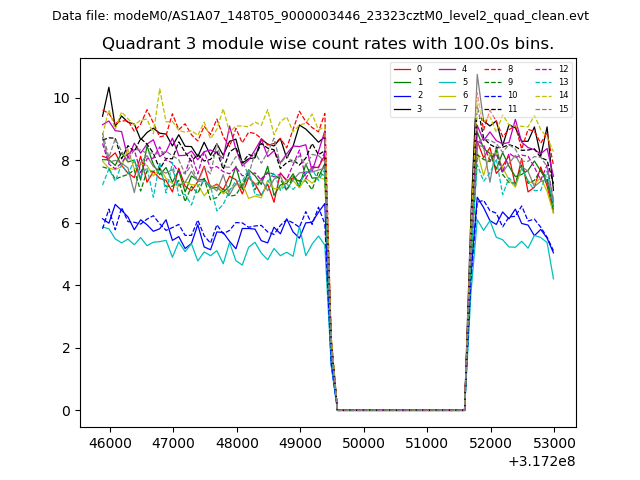 |
 |
| Parameter | Plot |
|---|---|
| CZT HV Monitor | 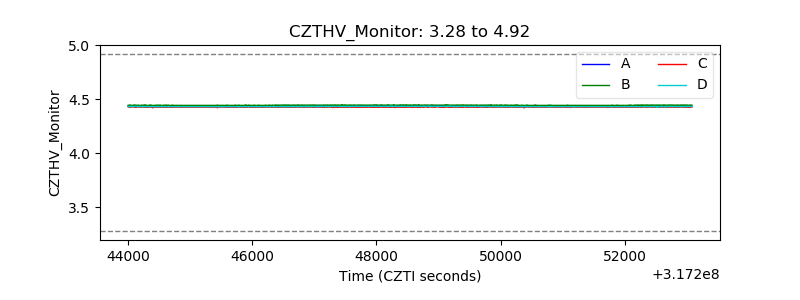 |
| D_VDD | 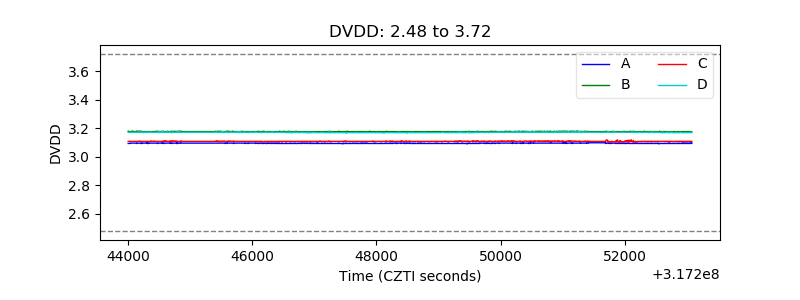 |
| Temperature 1 | 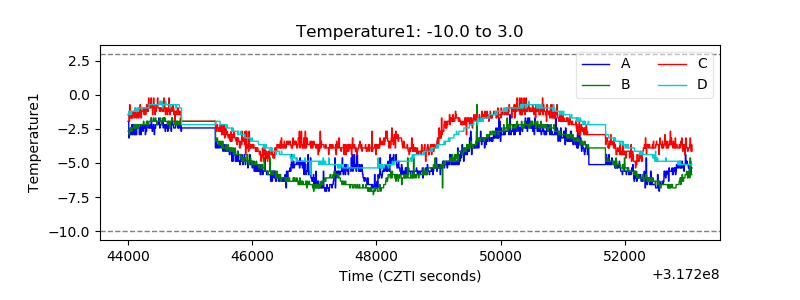 |
| Veto HV Monitor | 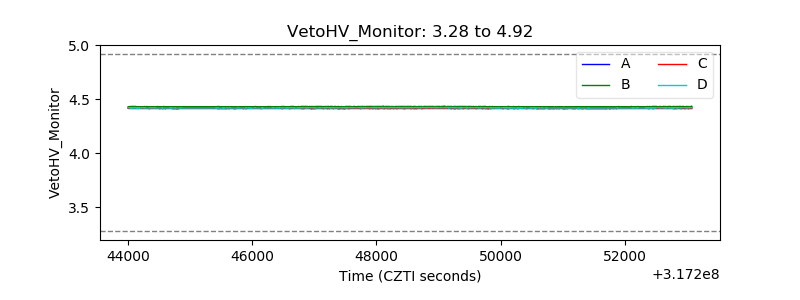 |
| Veto LLD | 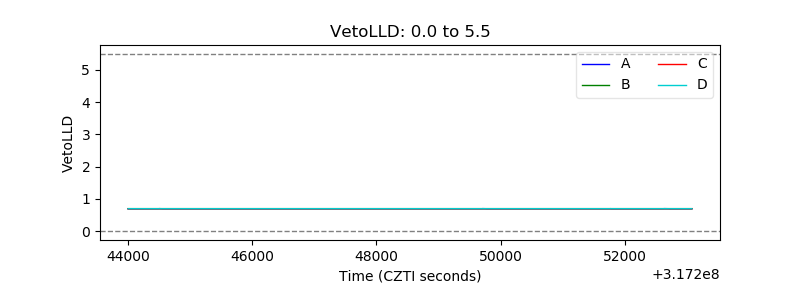 |
| Alpha Counter | 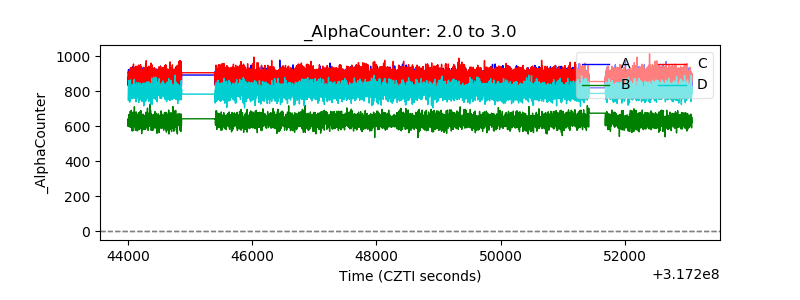 |
| _CPM_Rate | 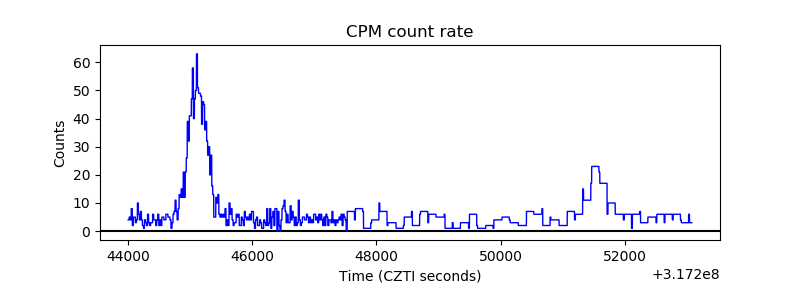 |
| CZT Counter | 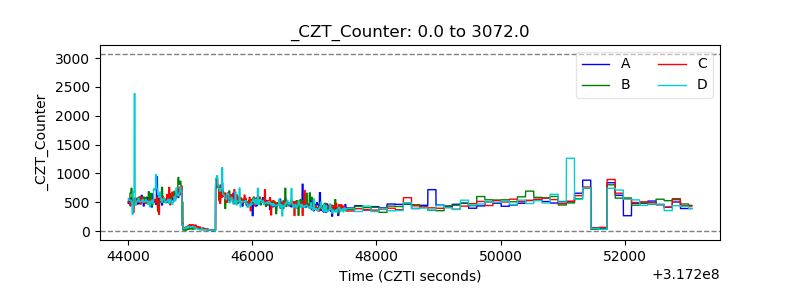 |
| +2.5 Volts monitor |  |
| +5 Volts monitor |  |
| _ROLL_ROT | 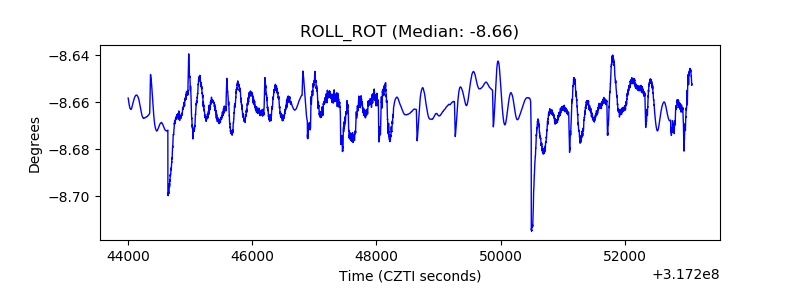 |
| _Roll_DEC |  |
| _Roll_RA | 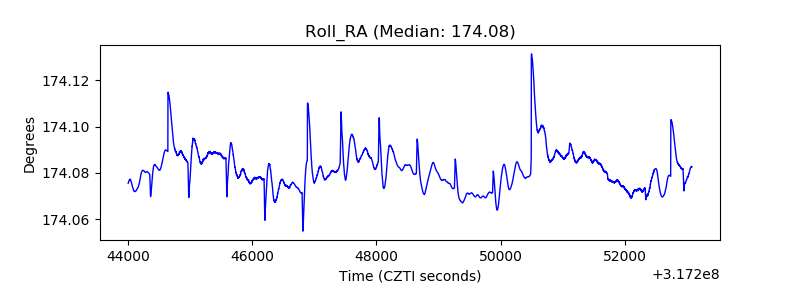 |
| Veto Counter | 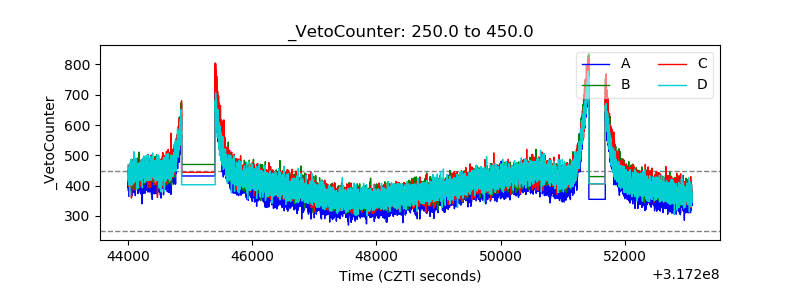 |