| Param | Original file | Final file |
|---|---|---|
| Filename | modeM0/AS1A07_148T05_9000003446_23324cztM0_level2.evt | modeM0/AS1A07_148T05_9000003446_23324cztM0_level2_quad_clean.evt |
| Size (bytes) | 572,097,600 | 105,531,840 |
| Size | 545.6 MB | 100.6 MB |
| Events in quadrant A | 3,917,881 | 668,180 |
| Events in quadrant B | 4,062,224 | 678,816 |
| Events in quadrant C | 4,015,767 | 651,659 |
| Events in quadrant D | 4,778,020 | 632,109 |
| Mode M0 | |||
|---|---|---|---|
| Quadrant | BADHDUFLAG | Total packets | Discarded packets |
| A | 0 | 17090 | 2 |
| B | 0 | 17444 | 2 |
| C | 0 | 17200 | 2 |
| D | 0 | 19857 | 2 |
| Mode SS | |||
|---|---|---|---|
| Quadrant | BADHDUFLAG | Total packets | Discarded packets |
| A | 0 | 166 | 0 |
| B | 0 | 168 | 0 |
| C | 0 | 168 | 0 |
| D | 0 | 168 | 0 |
| Mode M9 | |||
|---|---|---|---|
| Quadrant | BADHDUFLAG | Total packets | Discarded packets |
| A | 0 | 6 | 0 |
| B | 0 | 6 | 0 |
| C | 0 | 6 | 0 |
| D | 0 | 6 | 0 |
| Quadrant | Total seconds | Saturated seconds | Saturation percentage |
|---|---|---|---|
| A | 8129 | 105 | 1.291672% |
| B | 8130 | 174 | 2.140221% |
| C | 8130 | 202 | 2.484625% |
| D | 8130 | 349 | 4.292743% |
Noise dominated data is calculated using 1-second bins in cleaned event files. If a bin has >2000 counts, and if more than 50% of those come from <1% of pixels, then it is considered to be noise-dominated and hence unusable.
| Quadrant | # 1 sec bins | Bins with >0 counts | Bins with >2000 counts | High rate bins dominated by noise | Noise dominated (total time) | Noise dominated (detector-on time) | Marked lightcurve |
|---|---|---|---|---|---|---|---|
| A | 8744 | 8131 | 0 | 0 | 0.00% | 0.00% | 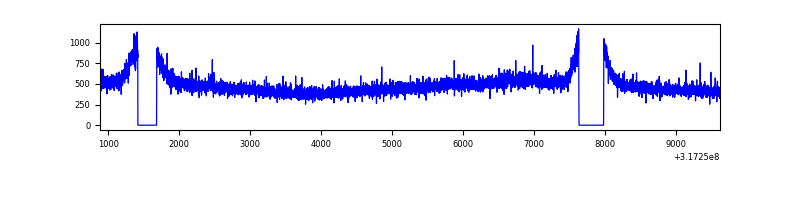 |
| B | 8745 | 8132 | 2 | 2 | 0.02% | 0.02% | 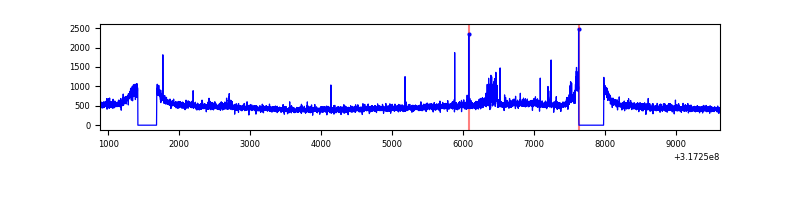 |
| C | 8745 | 8132 | 0 | 0 | 0.00% | 0.00% | 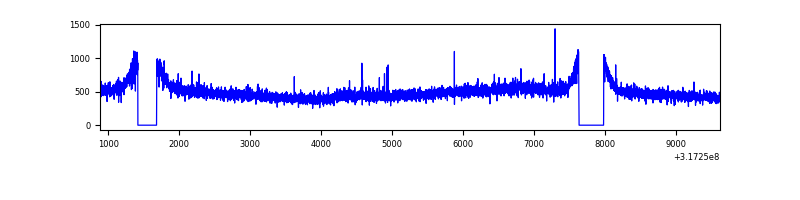 |
| D | 8744 | 8131 | 259 | 259 | 2.96% | 3.19% | 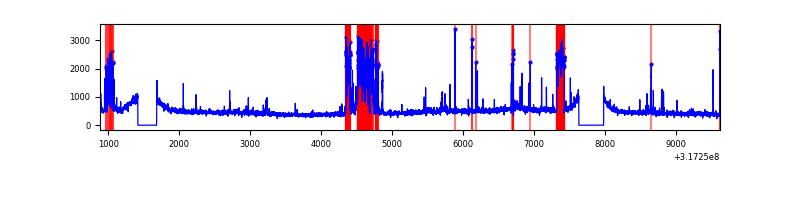 |
Top three noisy pixels from each quadrant. If the there are fewer than three noisy pixels in the level2.evt file, extra rows are filled as -1
| Pixel properties | Quadrant properties | ||||||
|---|---|---|---|---|---|---|---|
| Quadrant | DetID | PixID | Counts | Sigma | Mean | Median | Sigma |
| A | 13 | 254 | 12538 | 56.15 | 1014 | 990 | 205.7 |
| A | 3 | 137 | 9276 | 40.29 | 1014 | 990 | 205.7 |
| A | 0 | 226 | 8489 | 36.46 | 1014 | 990 | 205.7 |
| B | 0 | 190 | 60168 | 302.7 | 1010 | 985 | 195.5 |
| B | 12 | 111 | 24614 | 120.85 | 1010 | 985 | 195.5 |
| B | 11 | 111 | 21397 | 104.4 | 1010 | 985 | 195.5 |
| C | 14 | 238 | 152844 | 657.93 | 974 | 982 | 230.8 |
| C | 7 | 247 | 27081 | 113.07 | 974 | 982 | 230.8 |
| C | 0 | 207 | 15874 | 64.52 | 974 | 982 | 230.8 |
| D | 13 | 104 | 642643 | 2643.98 | 977 | 949 | 242.7 |
| D | 1 | 52 | 267565 | 1098.54 | 977 | 949 | 242.7 |
| D | 12 | 227 | 76974 | 313.25 | 977 | 949 | 242.7 |
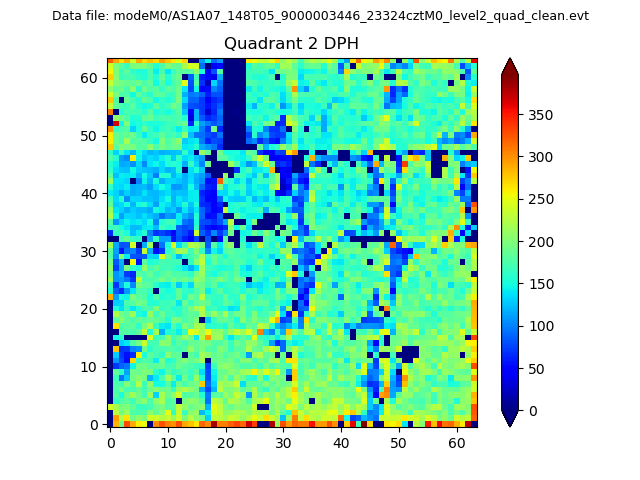
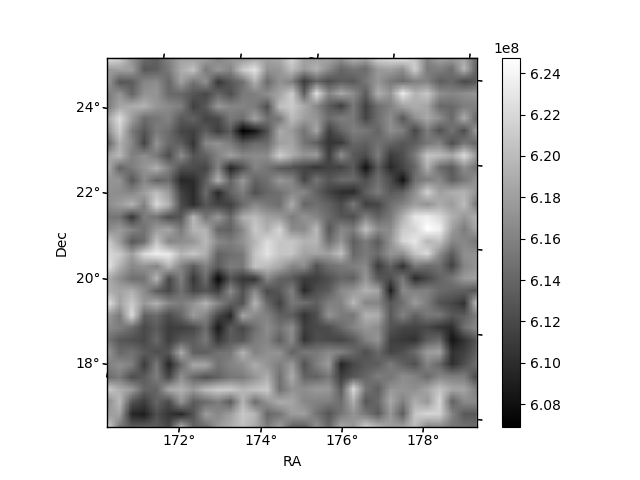
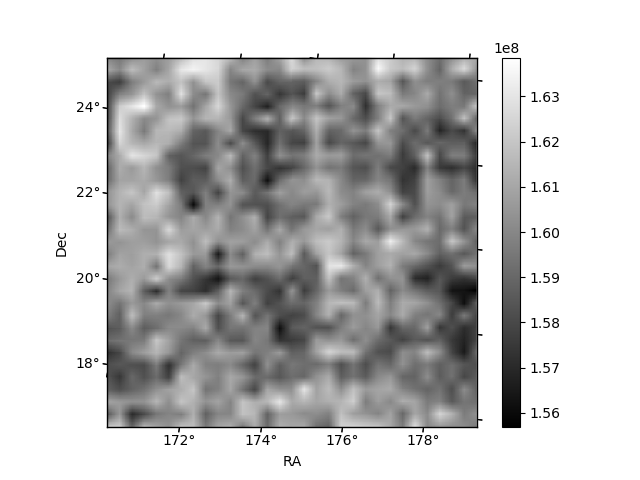
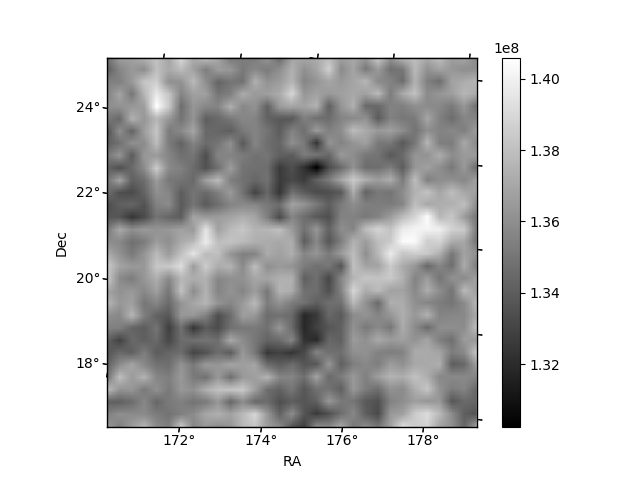
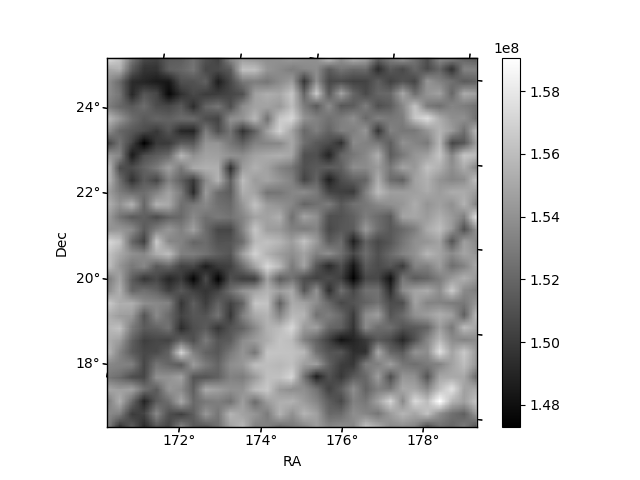
Histogram calculated using DETX and DETY for each event in the final _common_clean file
| Quadrant A | 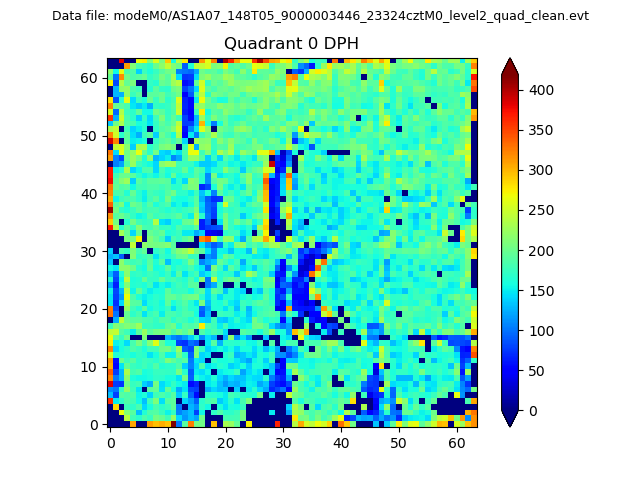 |
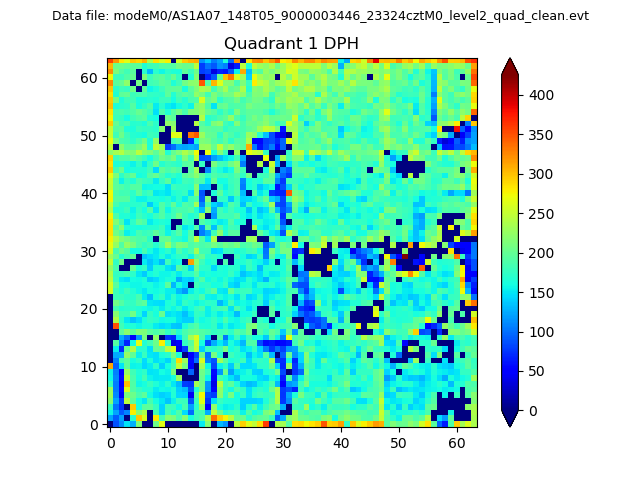 |
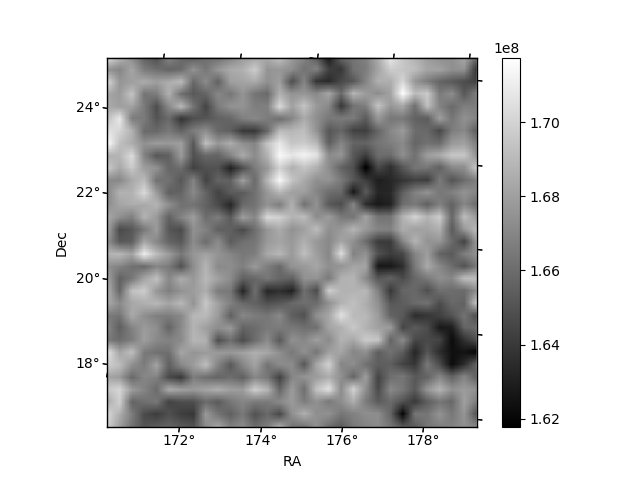
Quadrant B |
|---|---|---|---|
| Quadrant D | 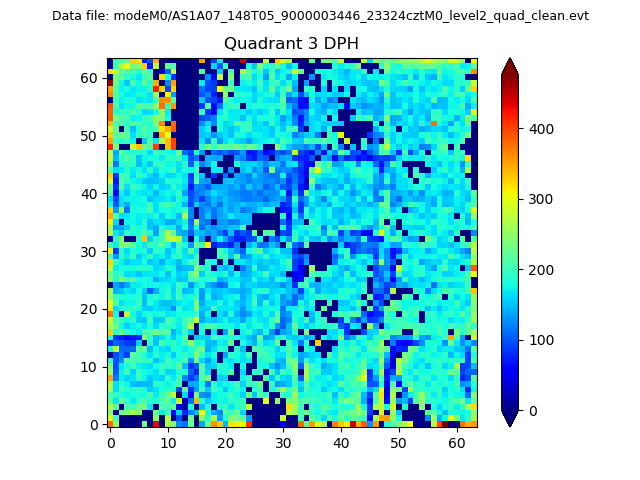 |
 |
Quadrant C |
| Plot type | Count rate plots | Images |
|---|---|---|
| Comparison with Poisson distribution Blue bars denote a histogram of data divided into 1 sec bins. Red curve is a Poisson curve with rate = median count rate of data. |
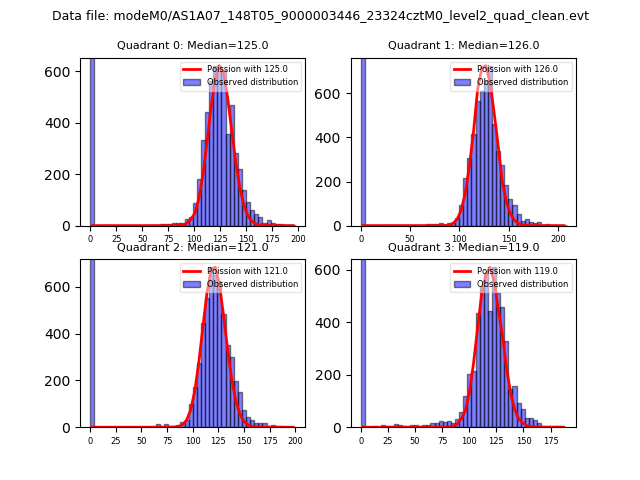 |
 |
| Quadrant-wise count rates Data is divided into 100 sec bins |
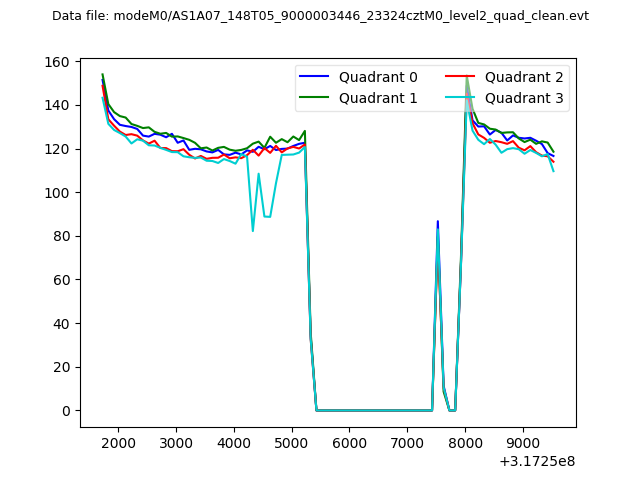 |
|
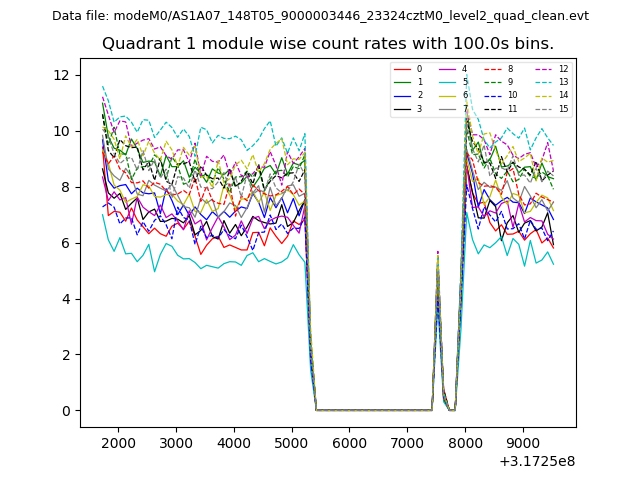
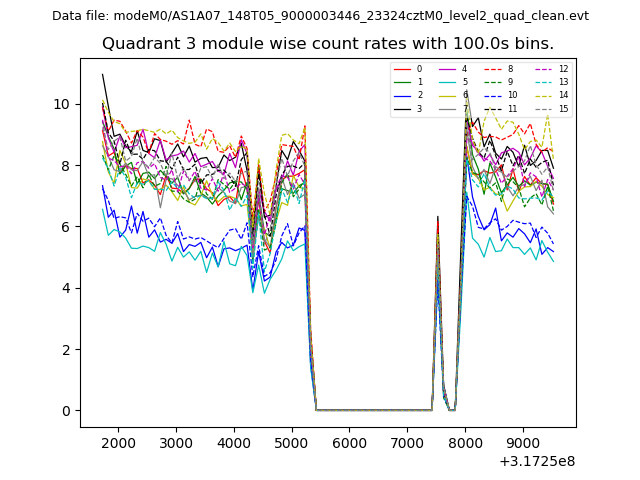
| Module-wise count rates for Quadrant A Data is divided into 100 sec bins |
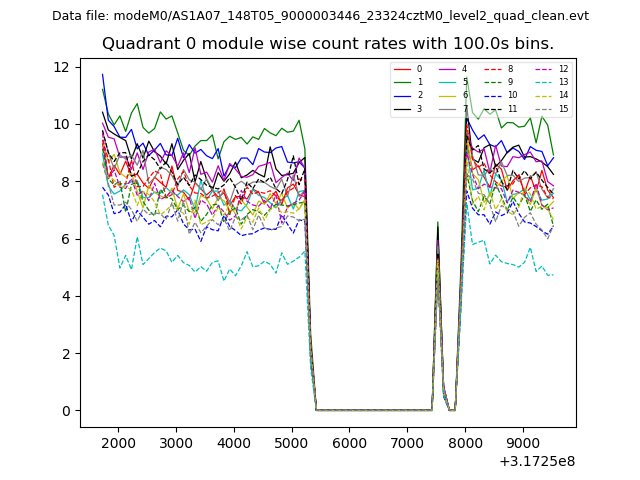 |
 |
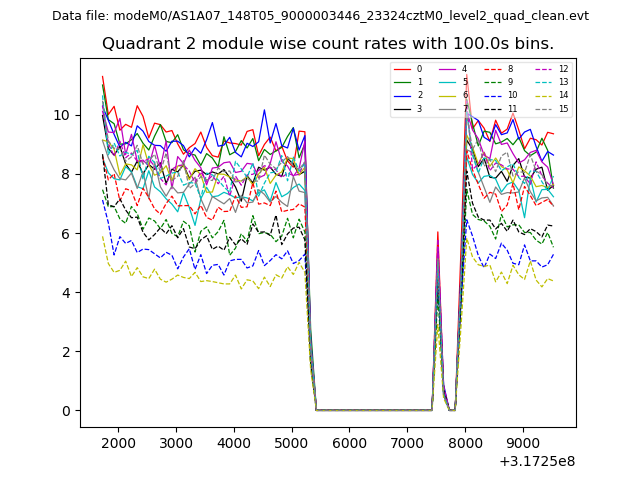
| Module-wise count rates for Quadrant B Data is divided into 100 sec bins |
 |
 |
| Module-wise count rates for Quadrant C Data is divided into 100 sec bins |
 |
 |
| Module-wise count rates for Quadrant D Data is divided into 100 sec bins |
 |
 |
| Parameter | Plot |
|---|---|
| CZT HV Monitor |  |
| D_VDD | 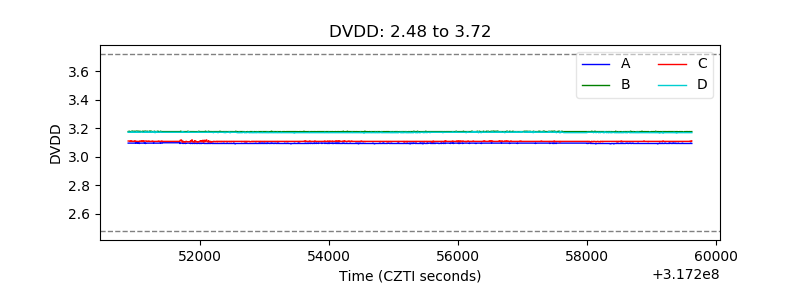 |
| Temperature 1 | 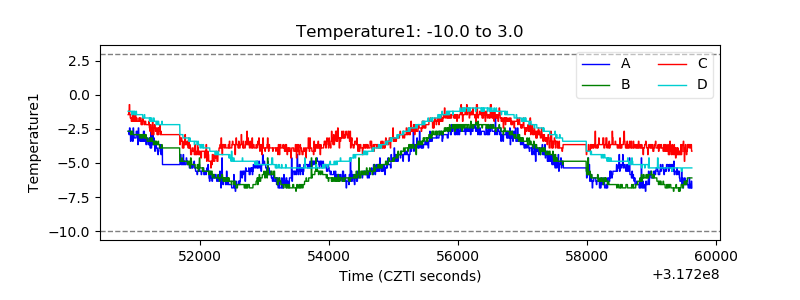 |
| Veto HV Monitor | 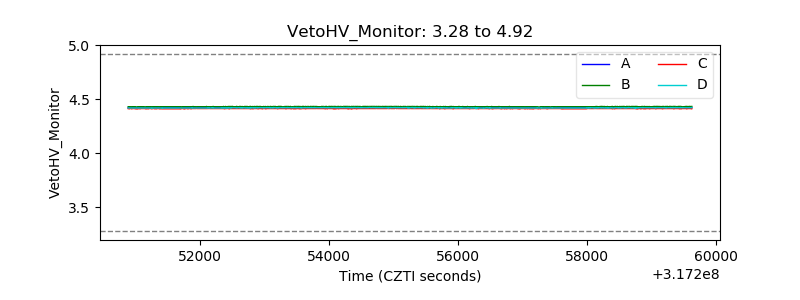 |
| Veto LLD |  |
| Alpha Counter | 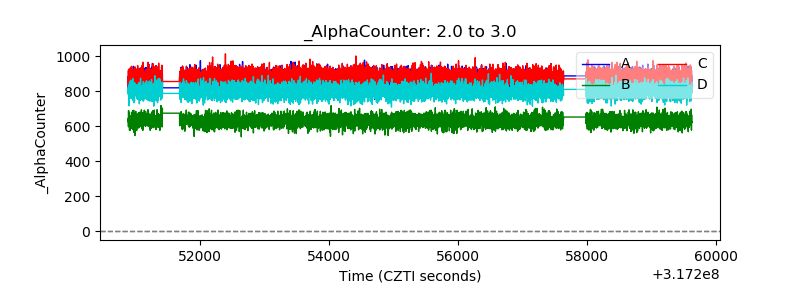 |
| _CPM_Rate | 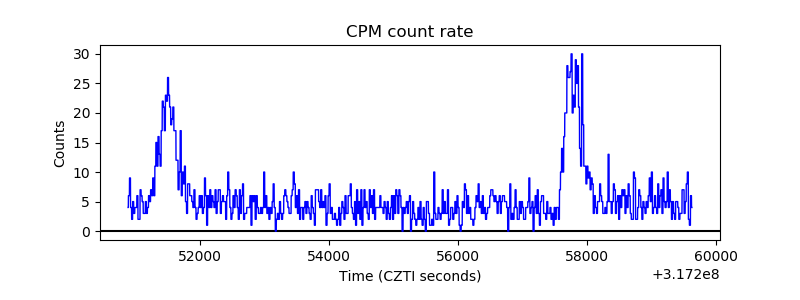 |
| CZT Counter | 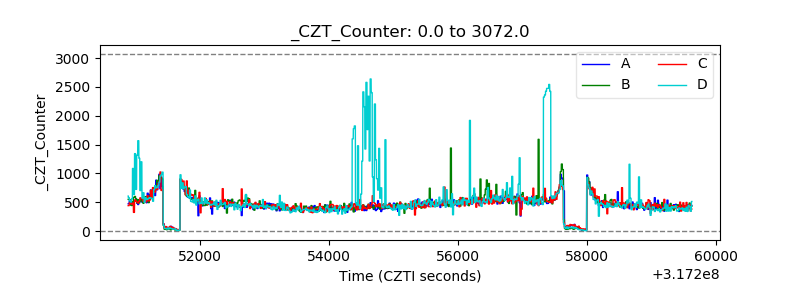 |
| +2.5 Volts monitor |  |
| +5 Volts monitor | 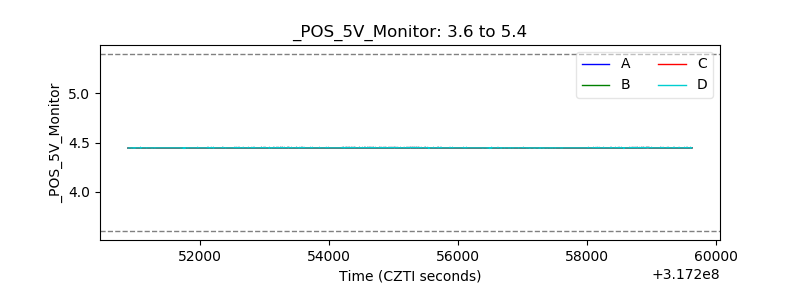 |
| _ROLL_ROT | 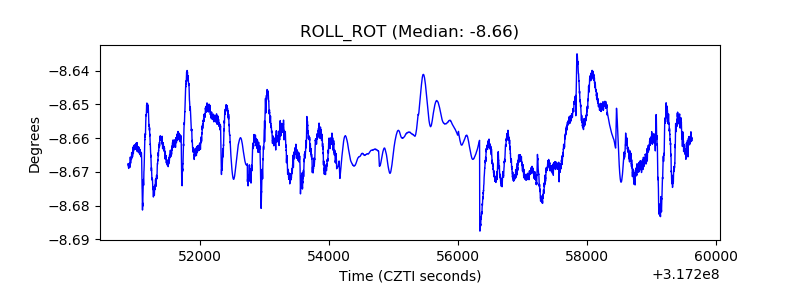 |
| _Roll_DEC | 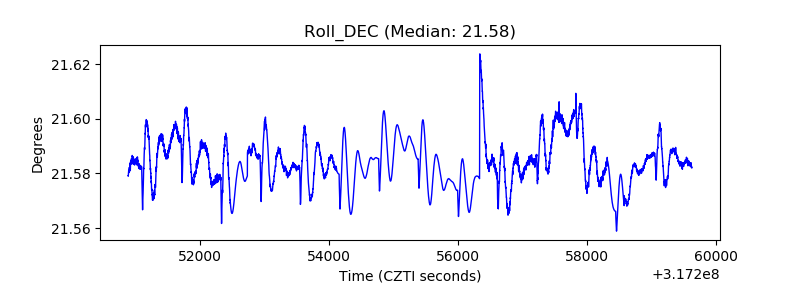 |
| _Roll_RA | 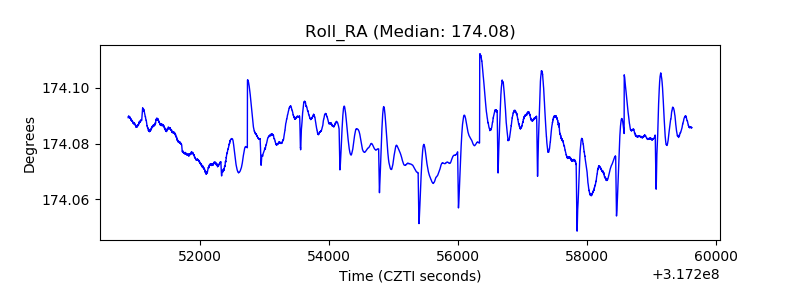 |
| Veto Counter | 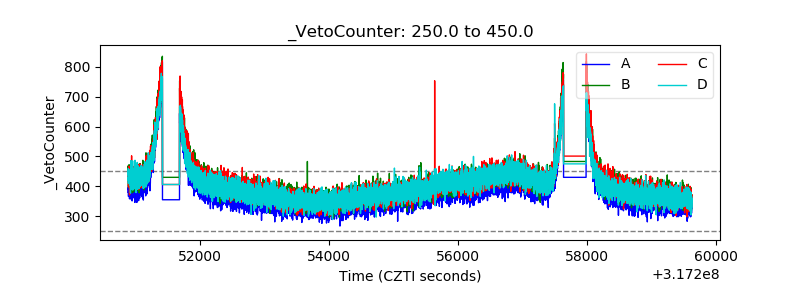 |