| Param | Original file | Final file |
|---|---|---|
| Filename | modeM0/AS1A07_148T05_9000003446_23328cztM0_level2.evt | modeM0/AS1A07_148T05_9000003446_23328cztM0_level2_quad_clean.evt |
| Size (bytes) | 470,272,320 | 93,778,560 |
| Size | 448.5 MB | 89.4 MB |
| Events in quadrant A | 3,478,130 | 599,908 |
| Events in quadrant B | 3,228,525 | 612,918 |
| Events in quadrant C | 3,276,994 | 586,491 |
| Events in quadrant D | 3,804,857 | 574,942 |
| Mode M0 | |||
|---|---|---|---|
| Quadrant | BADHDUFLAG | Total packets | Discarded packets |
| A | 0 | 14405 | 2 |
| B | 0 | 13617 | 2 |
| C | 0 | 13701 | 2 |
| D | 0 | 15559 | 2 |
| Mode SS | |||
|---|---|---|---|
| Quadrant | BADHDUFLAG | Total packets | Discarded packets |
| A | 0 | 136 | 0 |
| B | 0 | 136 | 0 |
| C | 0 | 136 | 0 |
| D | 0 | 136 | 0 |
| Mode M9 | |||
|---|---|---|---|
| Quadrant | BADHDUFLAG | Total packets | Discarded packets |
| A | 0 | 14 | 0 |
| B | 0 | 15 | 0 |
| C | 0 | 15 | 0 |
| D | 0 | 15 | 0 |
| Quadrant | Total seconds | Saturated seconds | Saturation percentage |
|---|---|---|---|
| A | 6679 | 86 | 1.287618% |
| B | 6679 | 40 | 0.598892% |
| C | 6679 | 75 | 1.122923% |
| D | 6679 | 83 | 1.242701% |
Noise dominated data is calculated using 1-second bins in cleaned event files. If a bin has >2000 counts, and if more than 50% of those come from <1% of pixels, then it is considered to be noise-dominated and hence unusable.
| Quadrant | # 1 sec bins | Bins with >0 counts | Bins with >2000 counts | High rate bins dominated by noise | Noise dominated (total time) | Noise dominated (detector-on time) | Marked lightcurve |
|---|---|---|---|---|---|---|---|
| A | 7674 | 6679 | 36 | 36 | 0.47% | 0.54% | 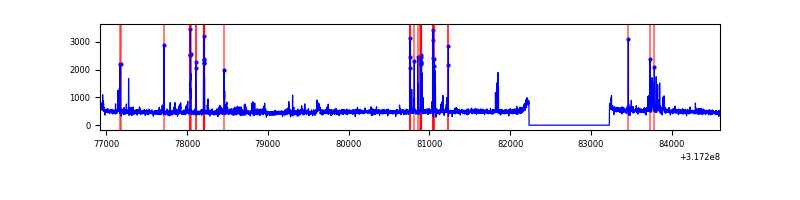 |
| B | 7674 | 6679 | 0 | 0 | 0.00% | 0.00% | 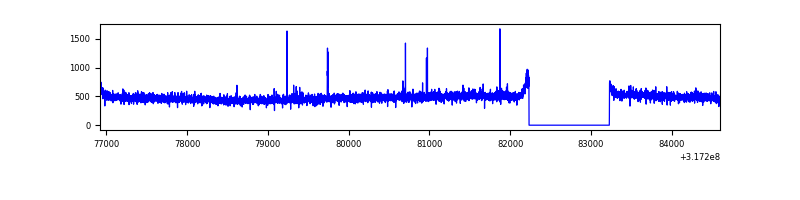 |
| C | 7674 | 6680 | 0 | 0 | 0.00% | 0.00% | 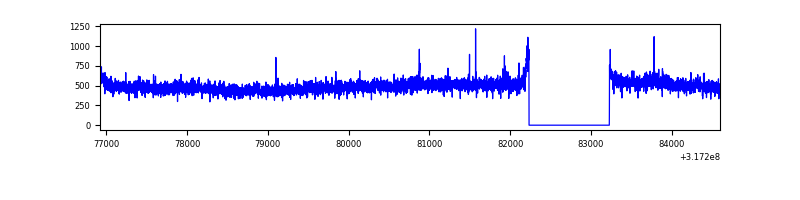 |
| D | 7674 | 6679 | 34 | 34 | 0.44% | 0.51% | 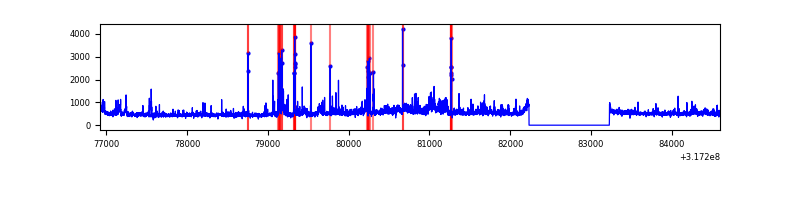 |
Top three noisy pixels from each quadrant. If the there are fewer than three noisy pixels in the level2.evt file, extra rows are filled as -1
| Pixel properties | Quadrant properties | ||||||
|---|---|---|---|---|---|---|---|
| Quadrant | DetID | PixID | Counts | Sigma | Mean | Median | Sigma |
| A | 6 | 16 | 301119 | 1806.33 | 824 | 807 | 166.3 |
| A | 13 | 254 | 10309 | 57.15 | 824 | 807 | 166.3 |
| A | 3 | 137 | 7216 | 38.55 | 824 | 807 | 166.3 |
| B | 12 | 111 | 18802 | 115.29 | 817 | 798 | 156.2 |
| B | 11 | 111 | 16965 | 103.52 | 817 | 798 | 156.2 |
| B | 14 | 111 | 14773 | 89.49 | 817 | 798 | 156.2 |
| C | 14 | 238 | 126565 | 679.69 | 787 | 792 | 185.0 |
| C | 7 | 247 | 42375 | 224.72 | 787 | 792 | 185.0 |
| C | 10 | 9 | 19609 | 101.69 | 787 | 792 | 185.0 |
| D | 1 | 52 | 368947 | 1888.56 | 800 | 777 | 194.9 |
| D | 7 | 238 | 273326 | 1398.06 | 800 | 777 | 194.9 |
| D | 13 | 104 | 87527 | 444.99 | 800 | 777 | 194.9 |
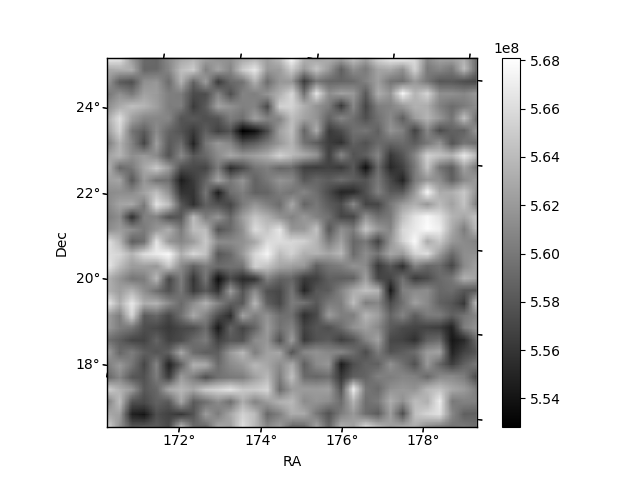
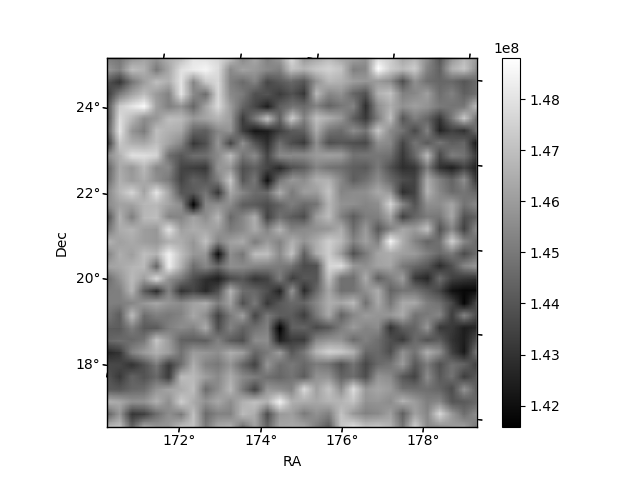
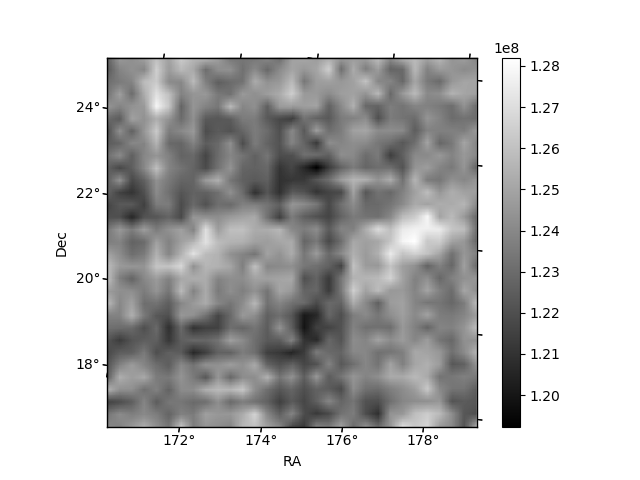
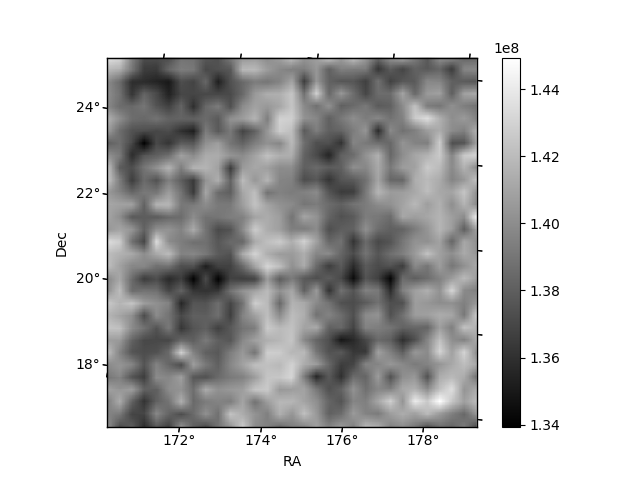
Histogram calculated using DETX and DETY for each event in the final _common_clean file
| Quadrant A | 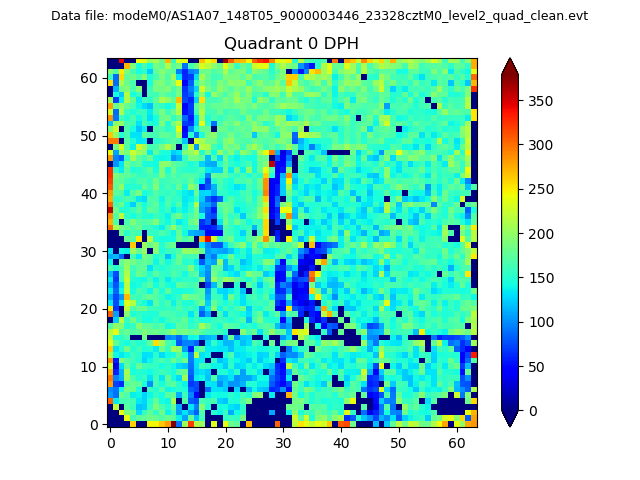 |
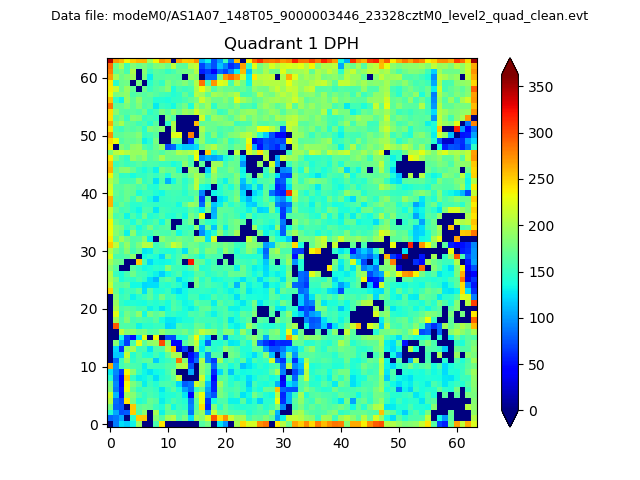 |
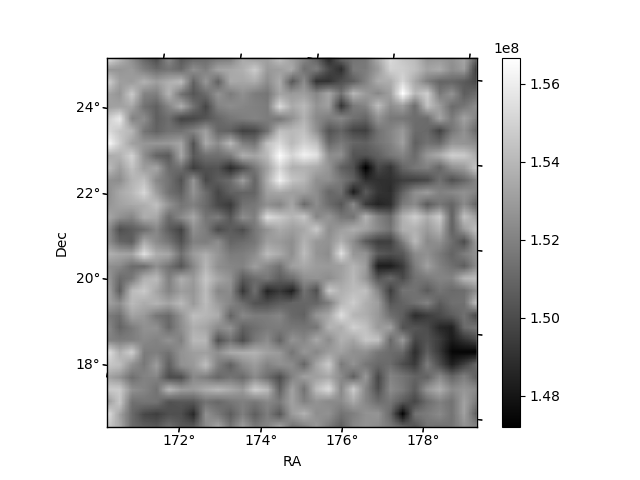
Quadrant B |
|---|---|---|---|
| Quadrant D | 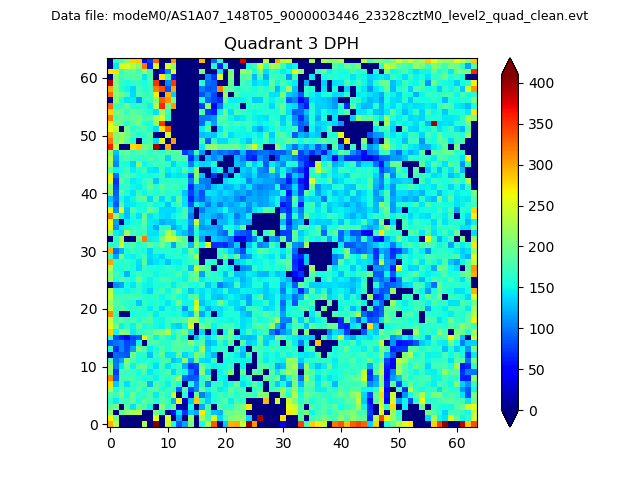 |
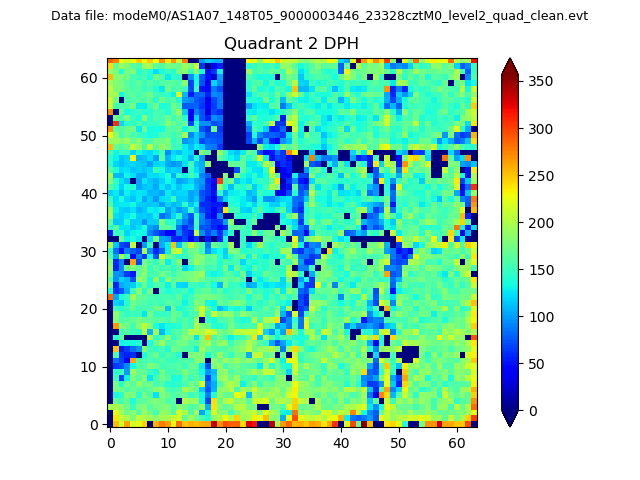 |
Quadrant C |
| Plot type | Count rate plots | Images |
|---|---|---|
| Comparison with Poisson distribution Blue bars denote a histogram of data divided into 1 sec bins. Red curve is a Poisson curve with rate = median count rate of data. |
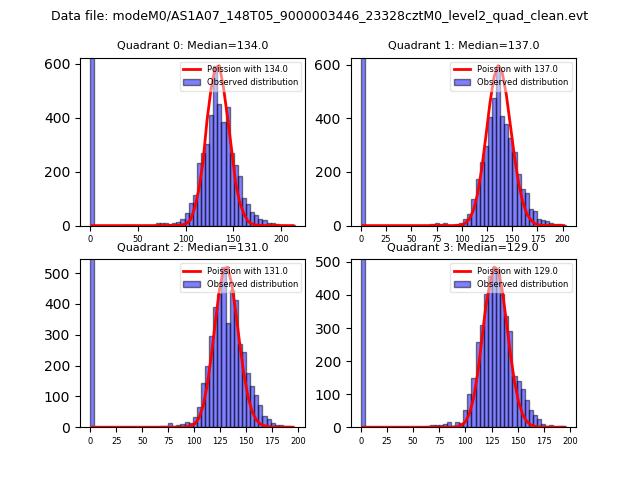 |
 |
| Quadrant-wise count rates Data is divided into 100 sec bins |
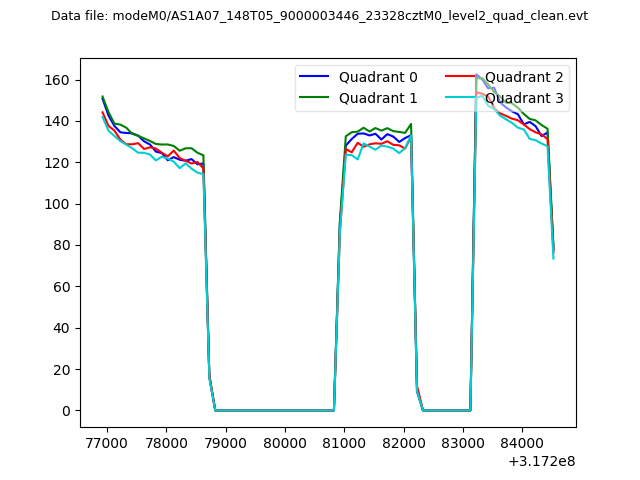 |
|
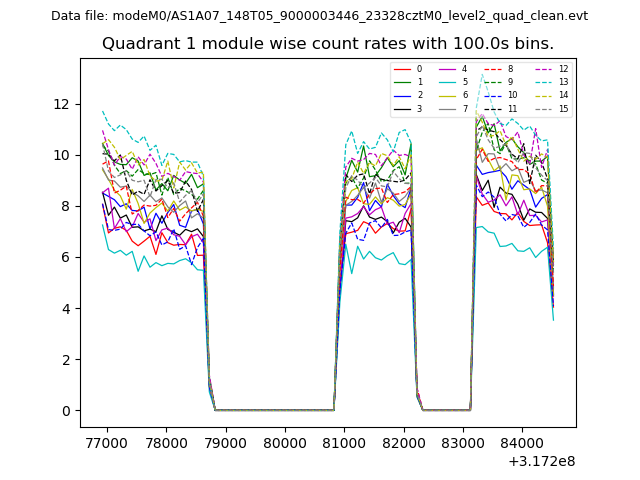
| Module-wise count rates for Quadrant A Data is divided into 100 sec bins |
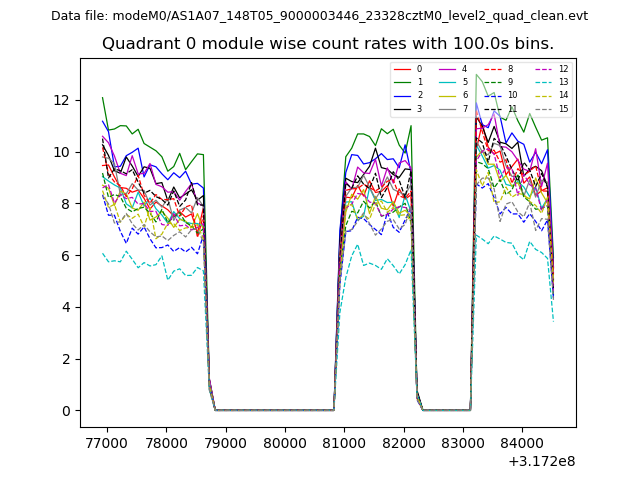 |
 |
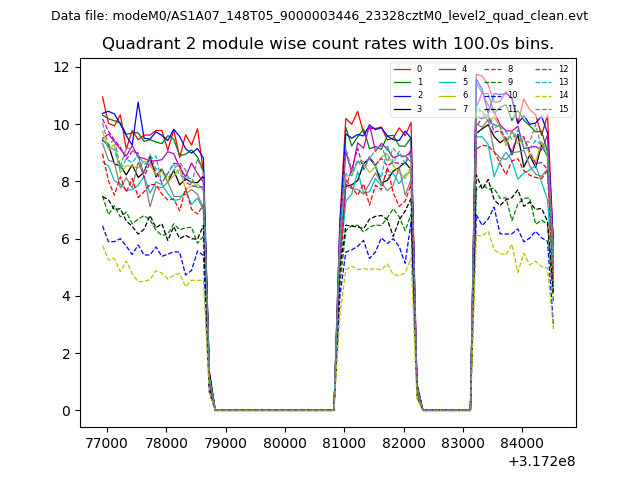
| Module-wise count rates for Quadrant B Data is divided into 100 sec bins |
 |
 |
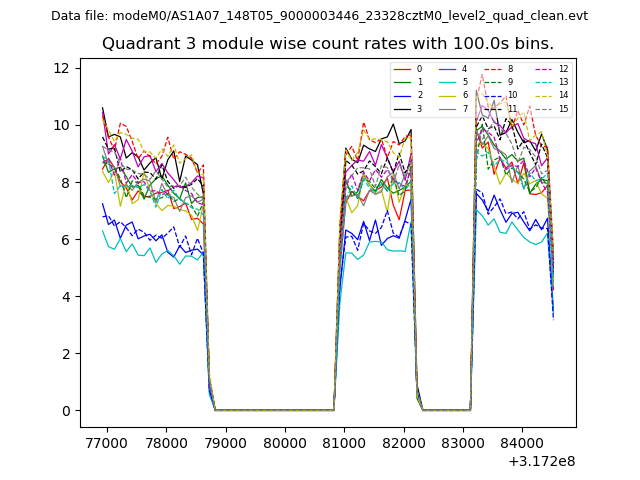
| Module-wise count rates for Quadrant C Data is divided into 100 sec bins |
 |
 |
| Module-wise count rates for Quadrant D Data is divided into 100 sec bins |
 |
 |
| Parameter | Plot |
|---|---|
| CZT HV Monitor | 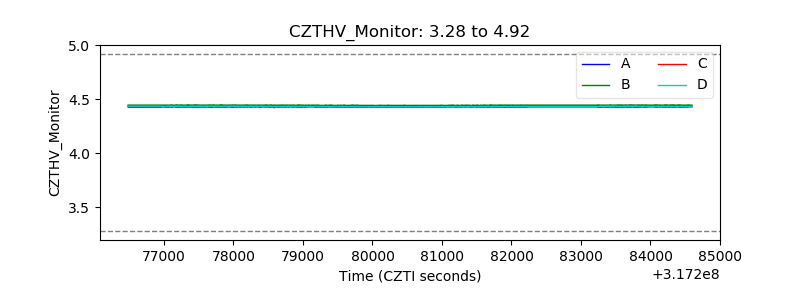 |
| D_VDD | 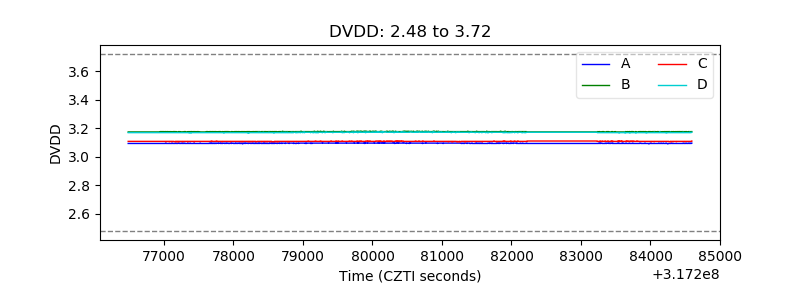 |
| Temperature 1 | 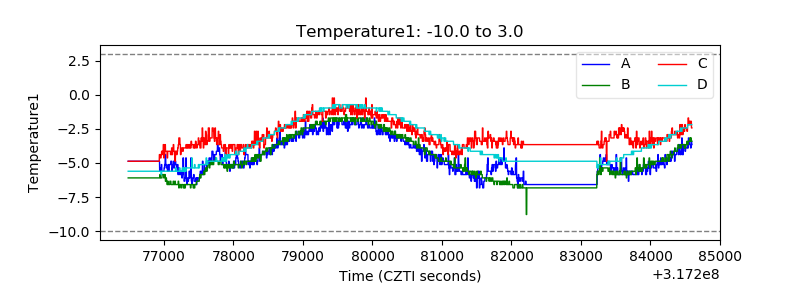 |
| Veto HV Monitor | 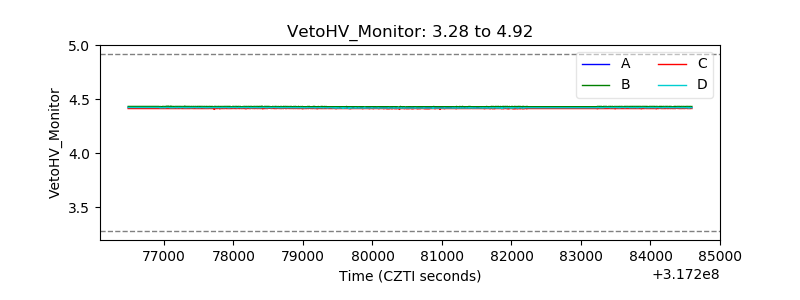 |
| Veto LLD | 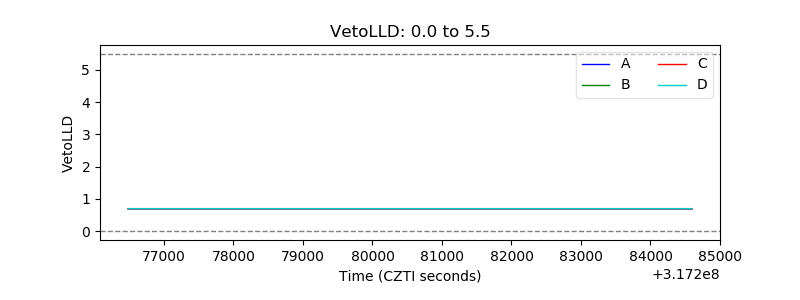 |
| Alpha Counter | 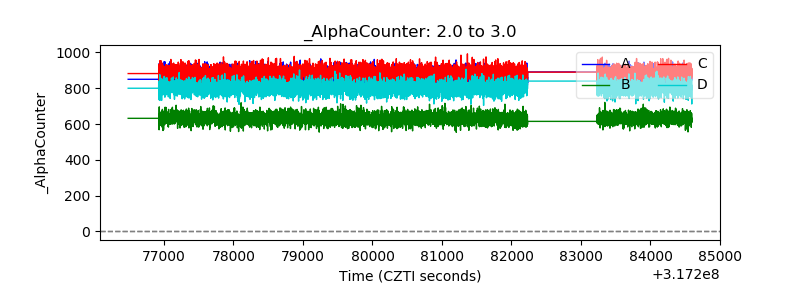 |
| _CPM_Rate | 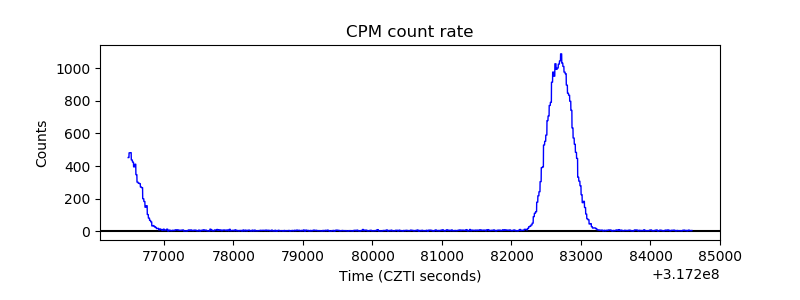 |
| CZT Counter | 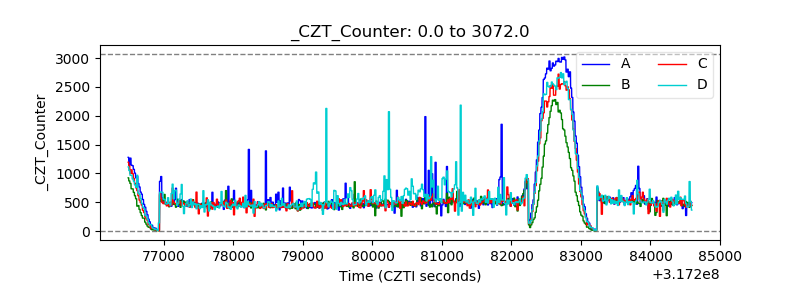 |
| +2.5 Volts monitor |  |
| +5 Volts monitor |  |
| _ROLL_ROT | 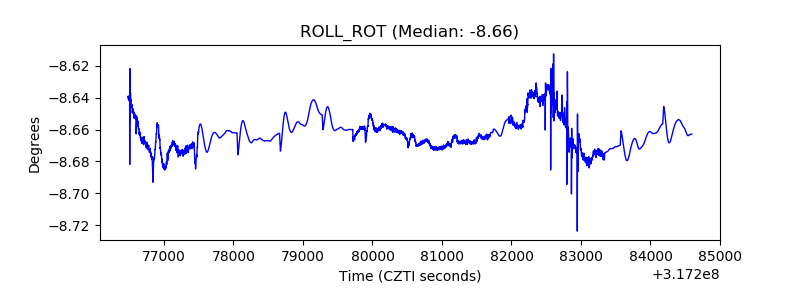 |
| _Roll_DEC | 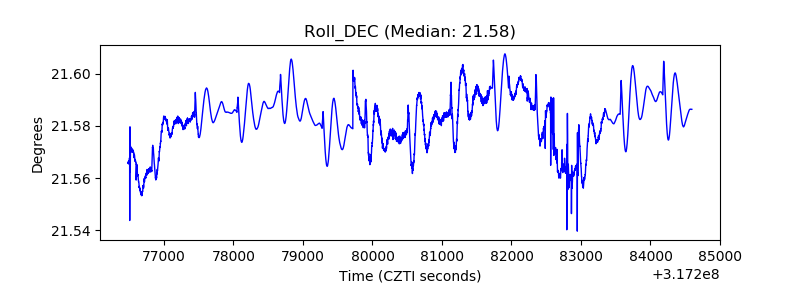 |
| _Roll_RA | 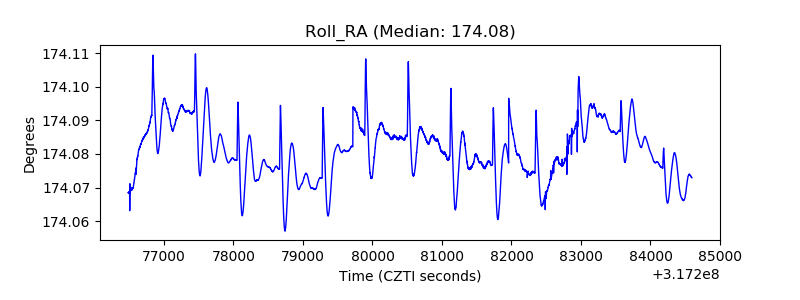 |
| Veto Counter | 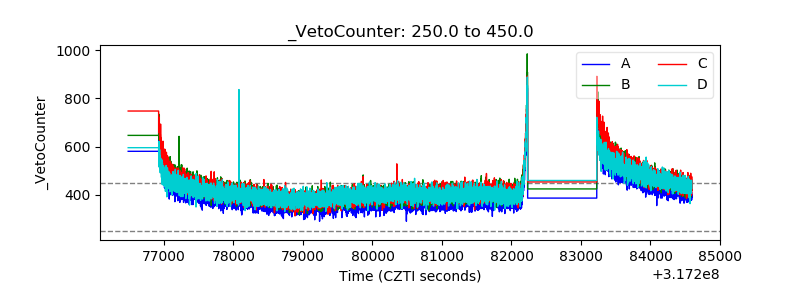 |