| Param | Original file | Final file |
|---|---|---|
| Filename | modeM0/AS1A07_148T05_9000003446_23330cztM0_level2.evt | modeM0/AS1A07_148T05_9000003446_23330cztM0_level2_quad_clean.evt |
| Size (bytes) | 2,885,886,720 | 471,651,840 |
| Size | 2.7 GB | 449.8 MB |
| Events in quadrant A | 17,899,658 | 2,993,149 |
| Events in quadrant B | 18,109,105 | 3,042,445 |
| Events in quadrant C | 19,837,739 | 2,912,252 |
| Events in quadrant D | 29,053,350 | 2,791,690 |
| Mode M0 | |||
|---|---|---|---|
| Quadrant | BADHDUFLAG | Total packets | Discarded packets |
| A | 0 | 77289 | 7 |
| B | 0 | 77480 | 7 |
| C | 0 | 82342 | 7 |
| D | 0 | 111730 | 8 |
| Mode SS | |||
|---|---|---|---|
| Quadrant | BADHDUFLAG | Total packets | Discarded packets |
| A | 0 | 752 | 0 |
| B | 0 | 752 | 0 |
| C | 0 | 752 | 0 |
| D | 0 | 752 | 0 |
| Mode M9 | |||
|---|---|---|---|
| Quadrant | BADHDUFLAG | Total packets | Discarded packets |
| A | 0 | 41 | 0 |
| B | 0 | 41 | 0 |
| C | 0 | 41 | 0 |
| D | 0 | 41 | 0 |
| Quadrant | Total seconds | Saturated seconds | Saturation percentage |
|---|---|---|---|
| A | 37072 | 290 | 0.782262% |
| B | 37072 | 387 | 1.043915% |
| C | 37072 | 733 | 1.977233% |
| D | 37072 | 3527 | 9.513919% |
Noise dominated data is calculated using 1-second bins in cleaned event files. If a bin has >2000 counts, and if more than 50% of those come from <1% of pixels, then it is considered to be noise-dominated and hence unusable.
| Quadrant | # 1 sec bins | Bins with >0 counts | Bins with >2000 counts | High rate bins dominated by noise | Noise dominated (total time) | Noise dominated (detector-on time) | Marked lightcurve |
|---|---|---|---|---|---|---|---|
| A | 45147 | 37076 | 26 | 26 | 0.06% | 0.07% | 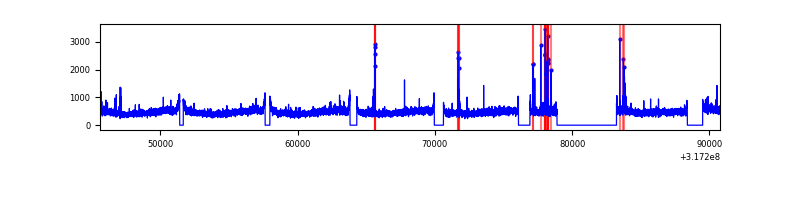 |
| B | 45147 | 37076 | 20 | 20 | 0.04% | 0.05% | 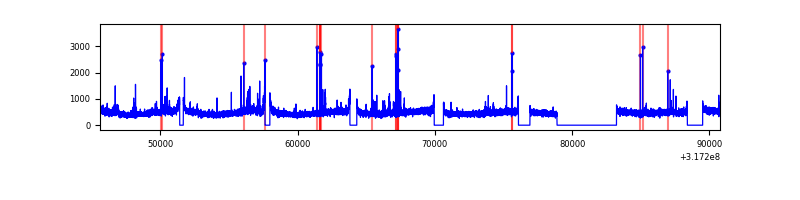 |
| C | 45147 | 37075 | 162 | 162 | 0.36% | 0.44% | 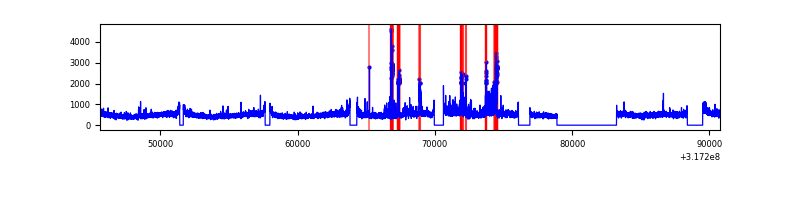 |
| D | 45147 | 37077 | 3031 | 3031 | 6.71% | 8.17% | 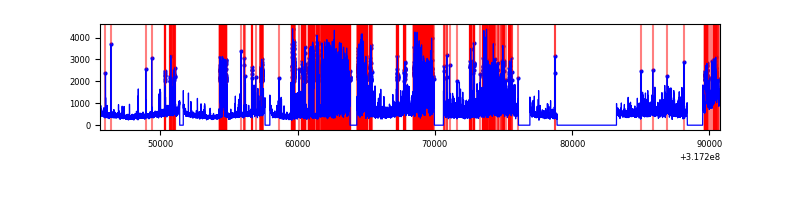 |
Top three noisy pixels from each quadrant. If the there are fewer than three noisy pixels in the level2.evt file, extra rows are filled as -1
| Pixel properties | Quadrant properties | ||||||
|---|---|---|---|---|---|---|---|
| Quadrant | DetID | PixID | Counts | Sigma | Mean | Median | Sigma |
| A | 6 | 16 | 295051 | 319.17 | 4557 | 4464 | 910.4 |
| A | 13 | 254 | 56939 | 57.64 | 4557 | 4464 | 910.4 |
| A | 2 | 79 | 44703 | 44.2 | 4557 | 4464 | 910.4 |
| B | 0 | 229 | 169285 | 192.42 | 4521 | 4408 | 856.9 |
| B | 0 | 190 | 113175 | 126.94 | 4521 | 4408 | 856.9 |
| B | 12 | 111 | 106601 | 119.27 | 4521 | 4408 | 856.9 |
| C | 10 | 9 | 1617326 | 1588.25 | 4348 | 4374 | 1015.6 |
| C | 14 | 238 | 687979 | 673.13 | 4348 | 4374 | 1015.6 |
| C | 0 | 207 | 287162 | 278.46 | 4348 | 4374 | 1015.6 |
| D | 1 | 52 | 8718276 | 8310.08 | 4278 | 4154 | 1048.6 |
| D | 7 | 238 | 1940584 | 1846.64 | 4278 | 4154 | 1048.6 |
| D | 7 | 223 | 996668 | 946.49 | 4278 | 4154 | 1048.6 |
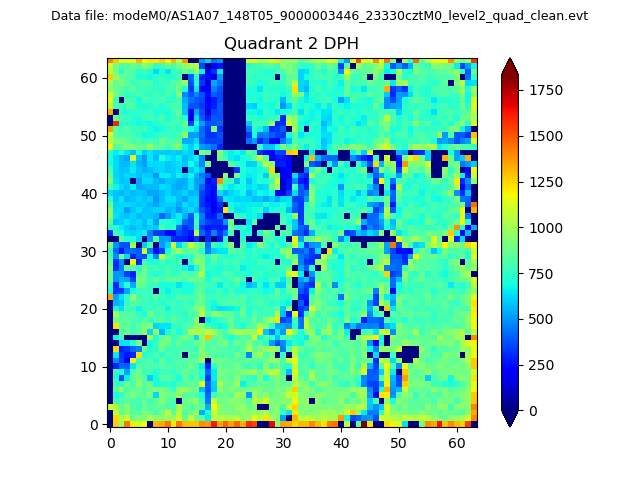
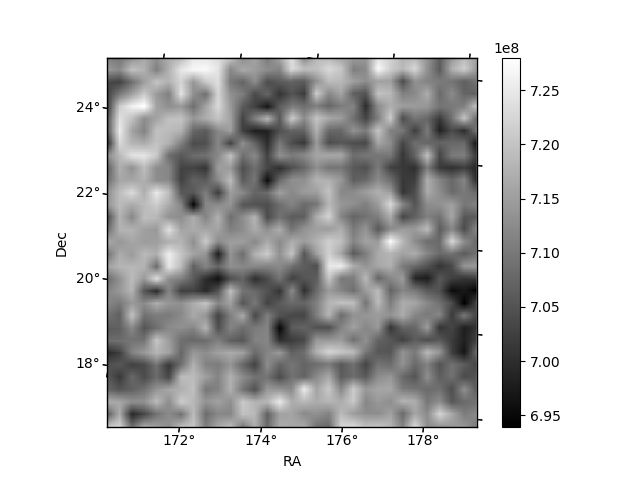
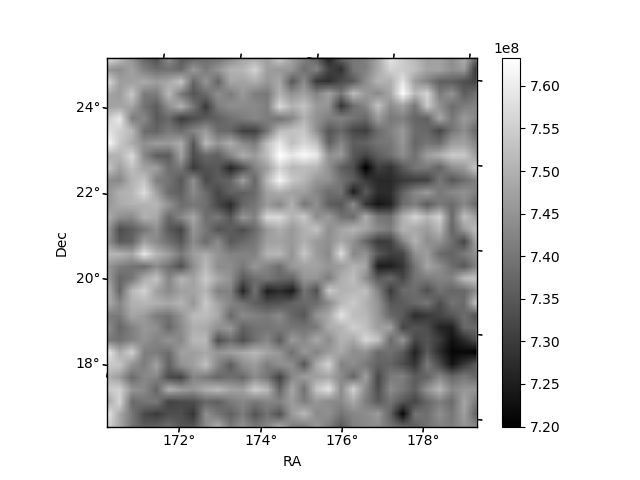
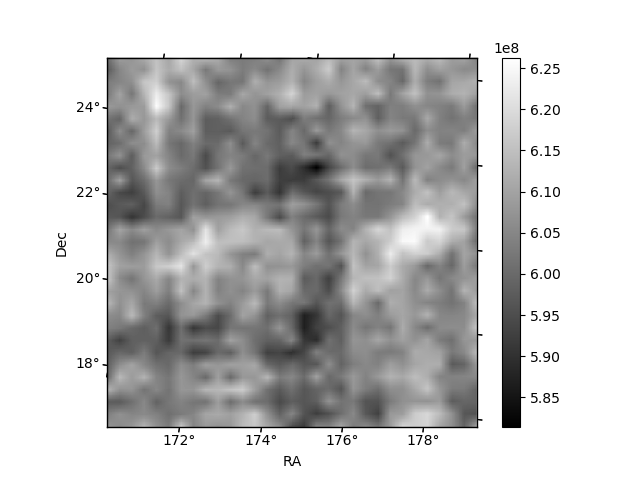
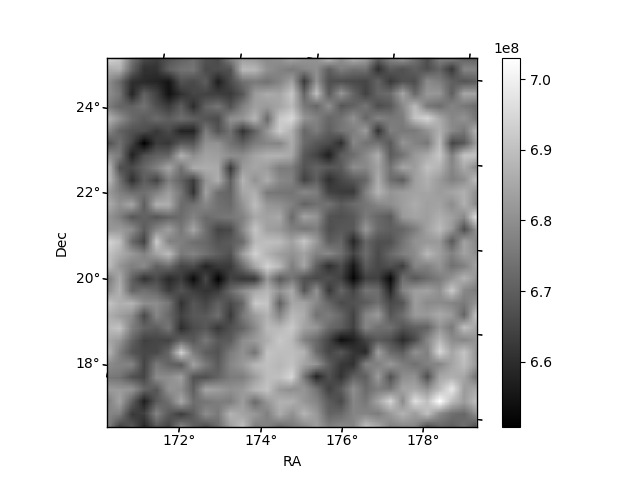
Histogram calculated using DETX and DETY for each event in the final _common_clean file
| Quadrant A |  |
 |
Quadrant B |
|---|---|---|---|
| Quadrant D | 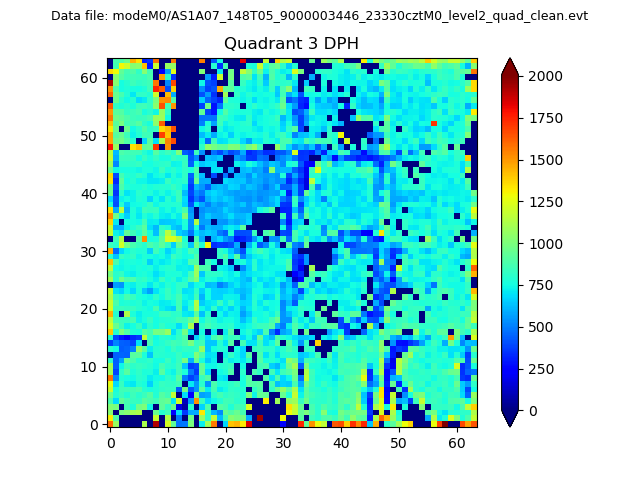 |
 |
Quadrant C |
| Plot type | Count rate plots | Images |
|---|---|---|
| Comparison with Poisson distribution Blue bars denote a histogram of data divided into 1 sec bins. Red curve is a Poisson curve with rate = median count rate of data. |
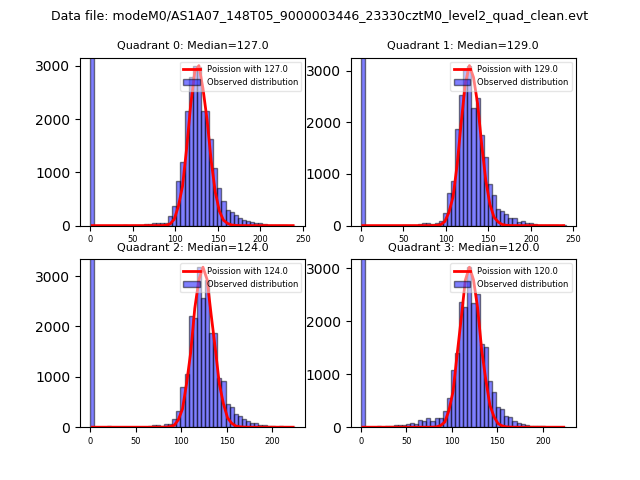 |
 |
| Quadrant-wise count rates Data is divided into 100 sec bins |
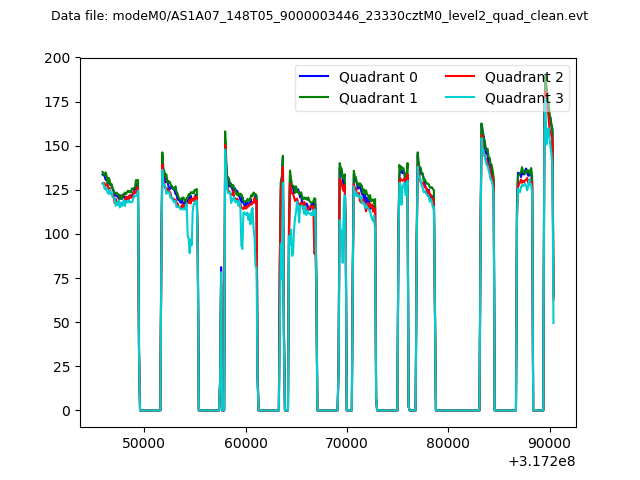 |
|
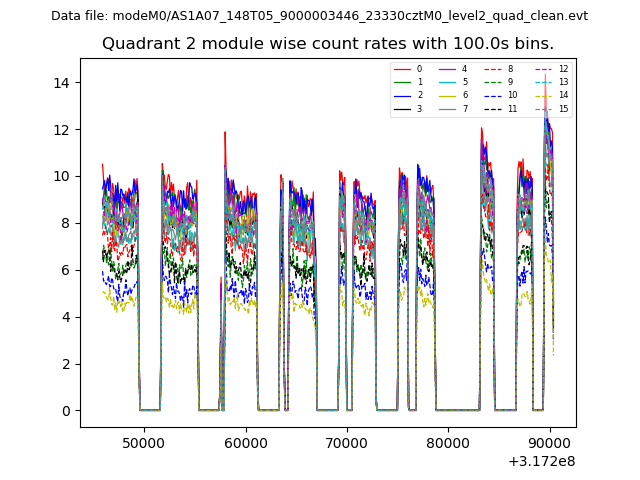
| Module-wise count rates for Quadrant A Data is divided into 100 sec bins |
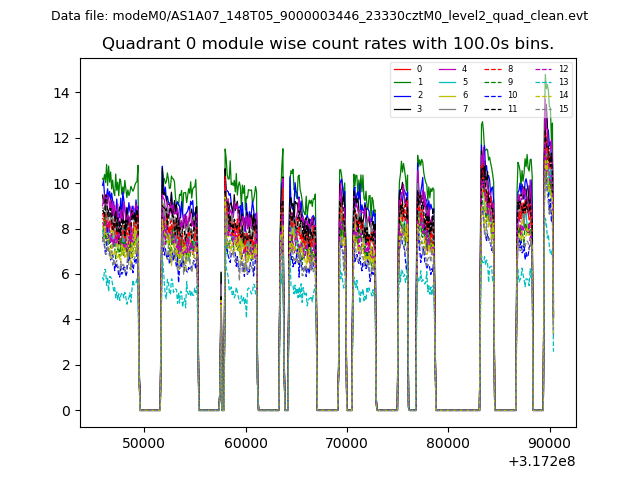 |
 |
| Module-wise count rates for Quadrant B Data is divided into 100 sec bins |
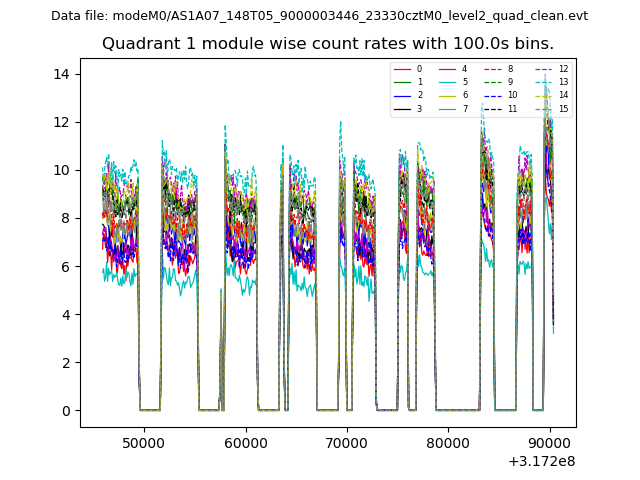 |
 |
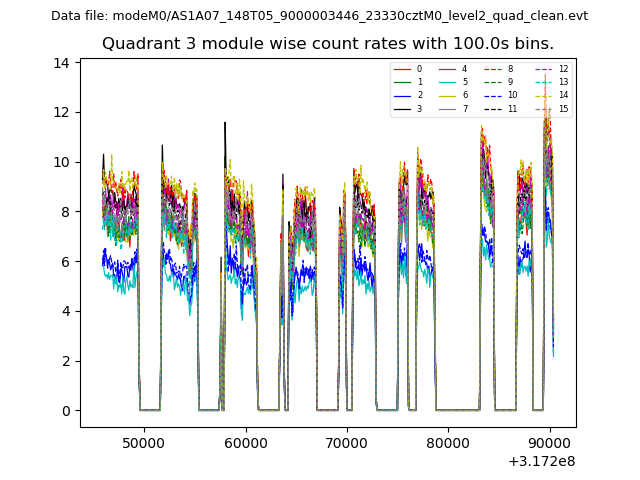
| Module-wise count rates for Quadrant C Data is divided into 100 sec bins |
 |
 |
| Module-wise count rates for Quadrant D Data is divided into 100 sec bins |
 |
 |
| Parameter | Plot |
|---|---|
| CZT HV Monitor | 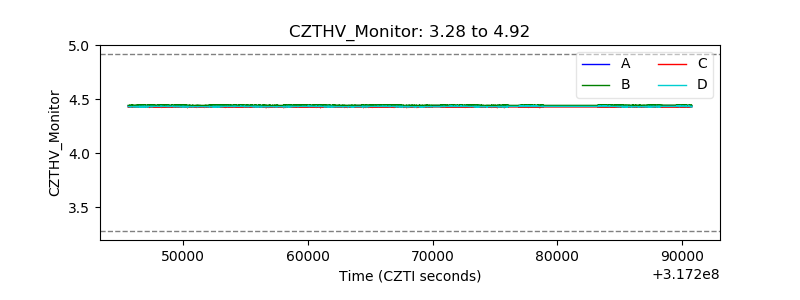 |
| D_VDD | 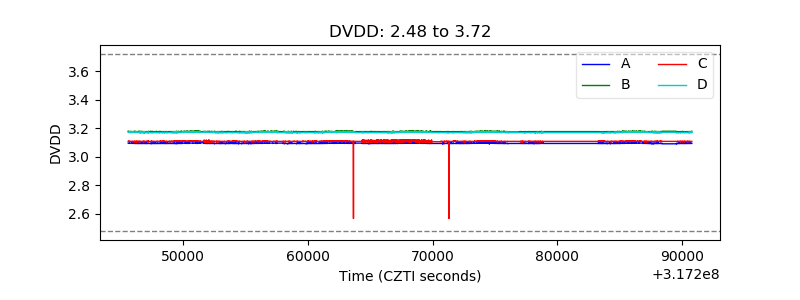 |
| Temperature 1 | 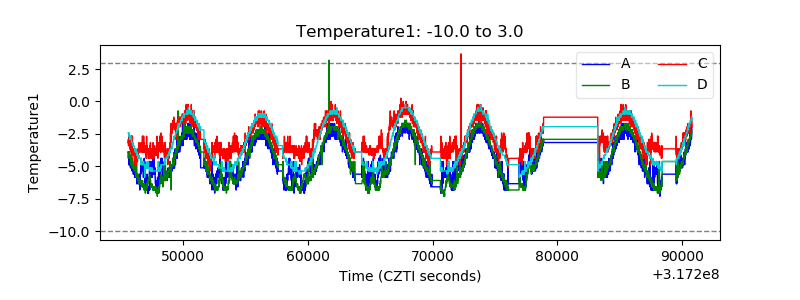 |
| Veto HV Monitor | 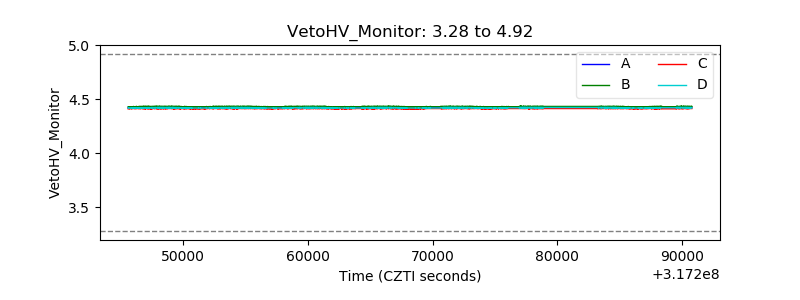 |
| Veto LLD | 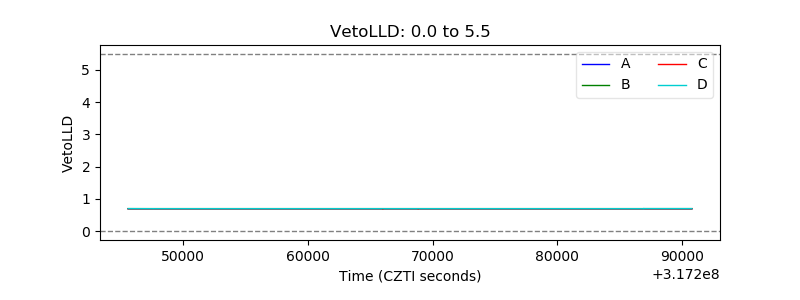 |
| Alpha Counter | 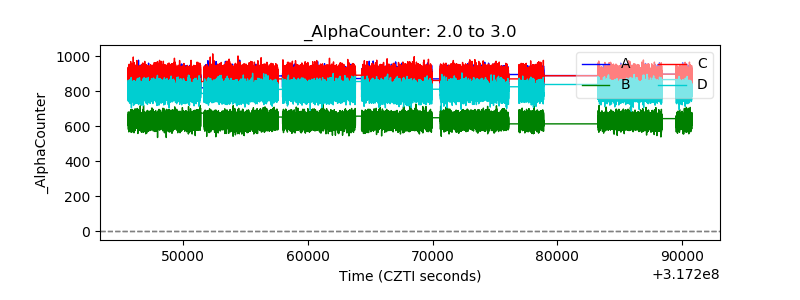 |
| _CPM_Rate | 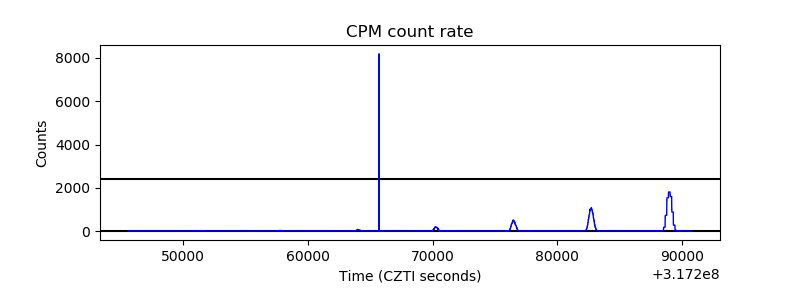 |
| CZT Counter | 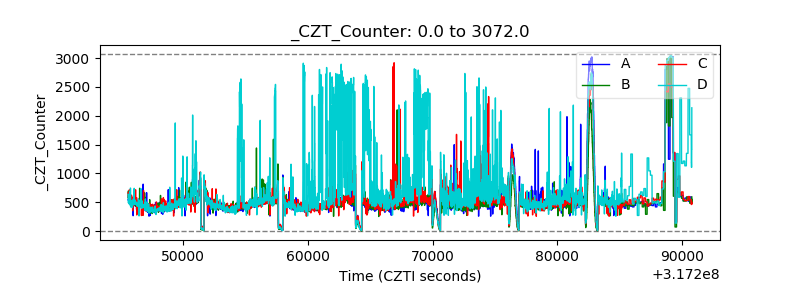 |
| +2.5 Volts monitor |  |
| +5 Volts monitor | 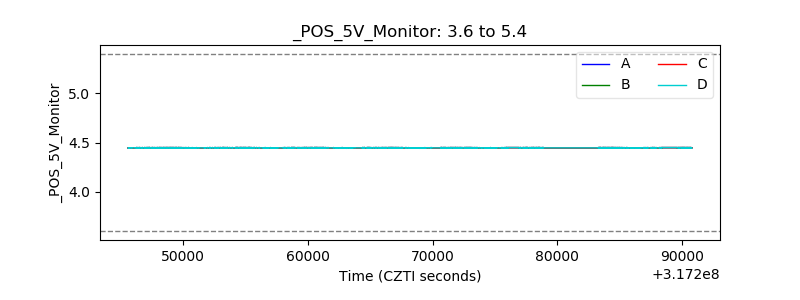 |
| _ROLL_ROT | 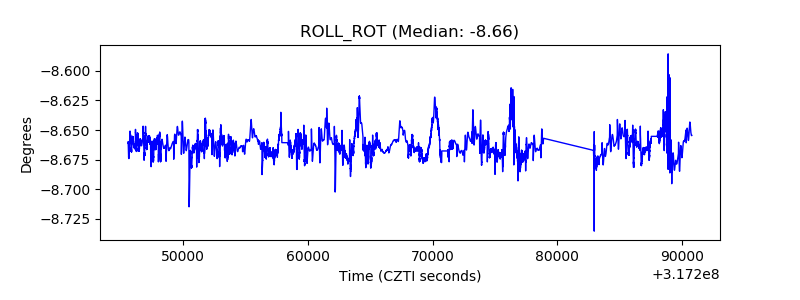 |
| _Roll_DEC | 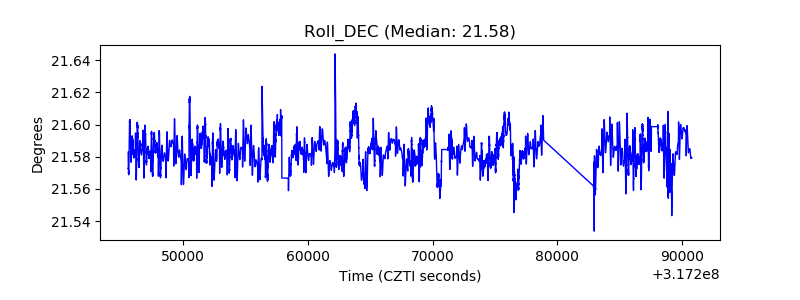 |
| _Roll_RA | 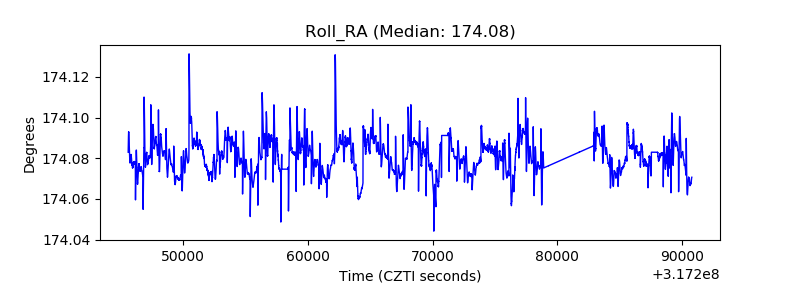 |
| Veto Counter | 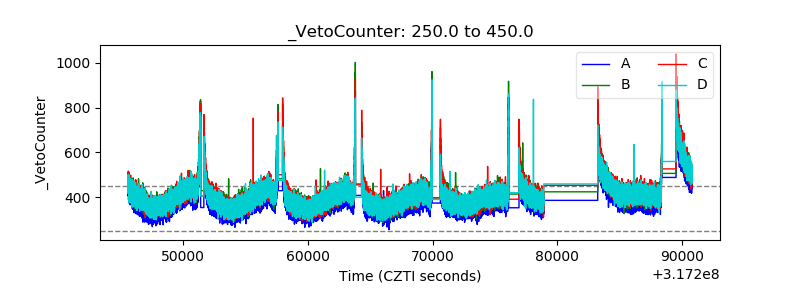 |