| Param | Original file | Final file |
|---|---|---|
| Filename | modeM0/AS1A07_148T05_9000003446_23331cztM0_level2.evt | modeM0/AS1A07_148T05_9000003446_23331cztM0_level2_quad_clean.evt |
| Size (bytes) | 814,472,640 | 78,272,640 |
| Size | 776.7 MB | 74.6 MB |
| Events in quadrant A | 3,418,891 | 528,753 |
| Events in quadrant B | 3,397,775 | 531,945 |
| Events in quadrant C | 3,512,648 | 511,074 |
| Events in quadrant D | 13,909,987 | 356,297 |
| Mode M0 | |||
|---|---|---|---|
| Quadrant | BADHDUFLAG | Total packets | Discarded packets |
| A | 0 | 14101 | 2 |
| B | 0 | 13906 | 2 |
| C | 0 | 14239 | 2 |
| D | 0 | 45599 | 2 |
| Mode SS | |||
|---|---|---|---|
| Quadrant | BADHDUFLAG | Total packets | Discarded packets |
| A | 0 | 128 | 0 |
| B | 0 | 128 | 0 |
| C | 0 | 128 | 0 |
| D | 0 | 128 | 0 |
| Mode M9 | |||
|---|---|---|---|
| Quadrant | BADHDUFLAG | Total packets | Discarded packets |
| A | 0 | 15 | 0 |
| B | 0 | 16 | 0 |
| C | 0 | 16 | 0 |
| D | 0 | 16 | 0 |
| Quadrant | Total seconds | Saturated seconds | Saturation percentage |
|---|---|---|---|
| A | 6321 | 62 | 0.980857% |
| B | 6320 | 65 | 1.028481% |
| C | 6320 | 83 | 1.313291% |
| D | 6320 | 4630 | 73.259494% |
Noise dominated data is calculated using 1-second bins in cleaned event files. If a bin has >2000 counts, and if more than 50% of those come from <1% of pixels, then it is considered to be noise-dominated and hence unusable.
| Quadrant | # 1 sec bins | Bins with >0 counts | Bins with >2000 counts | High rate bins dominated by noise | Noise dominated (total time) | Noise dominated (detector-on time) | Marked lightcurve |
|---|---|---|---|---|---|---|---|
| A | 7541 | 6321 | 4 | 4 | 0.05% | 0.06% | 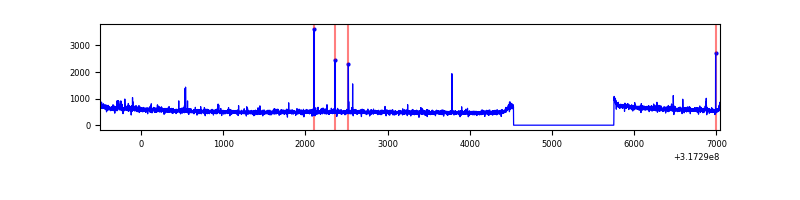 |
| B | 7540 | 6320 | 4 | 4 | 0.05% | 0.06% | 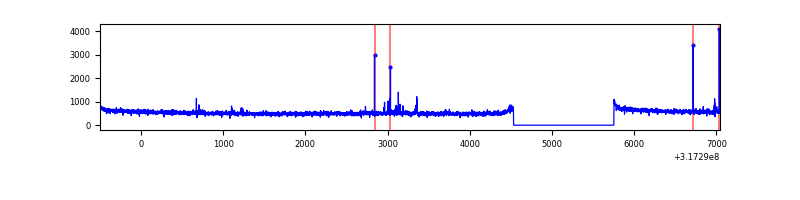 |
| C | 7540 | 6320 | 0 | 0 | 0.00% | 0.00% | 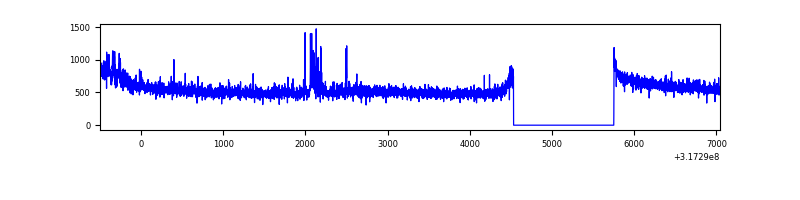 |
| D | 7540 | 6320 | 4506 | 4506 | 59.76% | 71.30% | 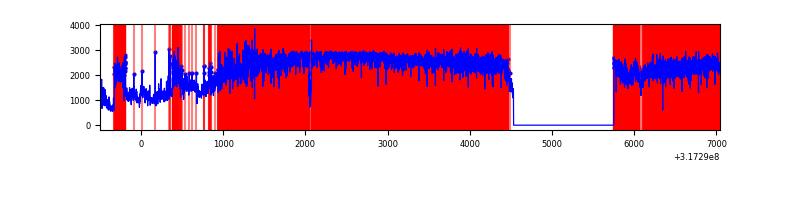 |
Top three noisy pixels from each quadrant. If the there are fewer than three noisy pixels in the level2.evt file, extra rows are filled as -1
| Pixel properties | Quadrant properties | ||||||
|---|---|---|---|---|---|---|---|
| Quadrant | DetID | PixID | Counts | Sigma | Mean | Median | Sigma |
| A | 6 | 16 | 58806 | 333.32 | 872 | 858 | 173.9 |
| A | 13 | 254 | 9401 | 49.14 | 872 | 858 | 173.9 |
| A | 0 | 226 | 7620 | 38.9 | 872 | 858 | 173.9 |
| B | 0 | 229 | 27130 | 163.93 | 855 | 836 | 160.4 |
| B | 12 | 111 | 18967 | 113.04 | 855 | 836 | 160.4 |
| B | 11 | 111 | 16868 | 99.95 | 855 | 836 | 160.4 |
| C | 14 | 238 | 133219 | 689.58 | 830 | 838 | 192.0 |
| C | 10 | 9 | 112164 | 579.9 | 830 | 838 | 192.0 |
| C | 7 | 247 | 25551 | 128.73 | 830 | 838 | 192.0 |
| D | 7 | 223 | 11066381 | 74468.01 | 615 | 597 | 148.6 |
| D | 7 | 238 | 314097 | 2109.72 | 615 | 597 | 148.6 |
| D | 1 | 52 | 147359 | 987.65 | 615 | 597 | 148.6 |
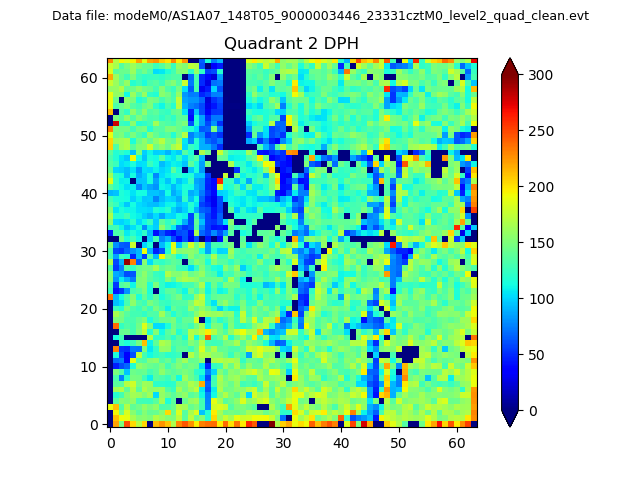
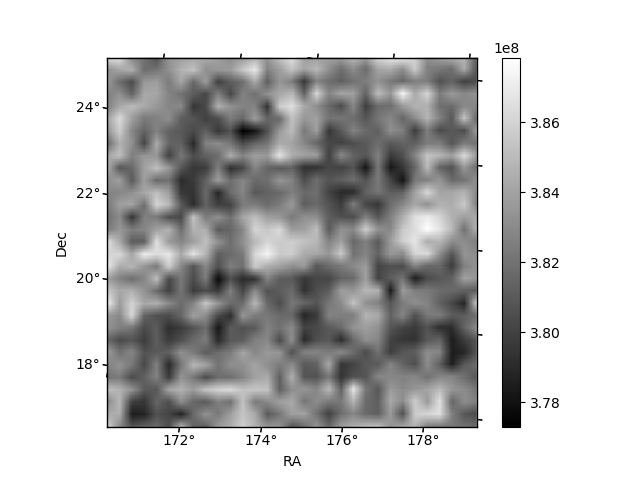
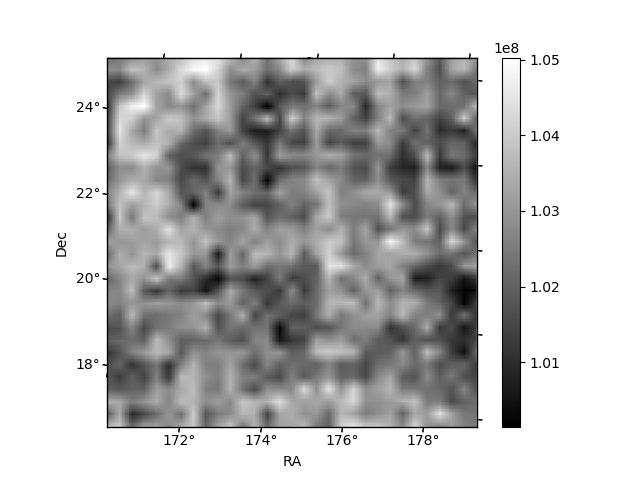
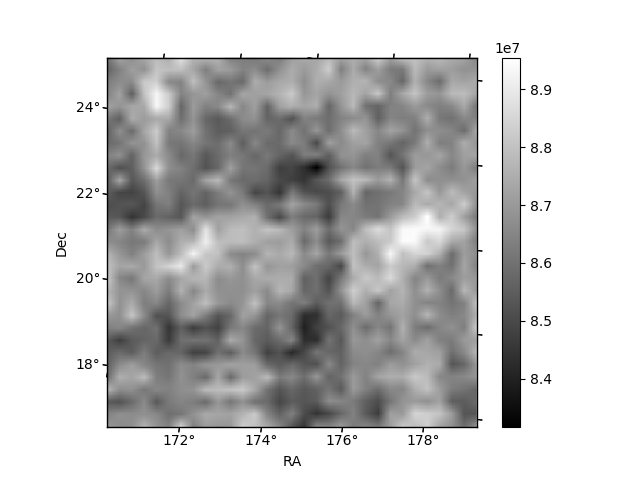
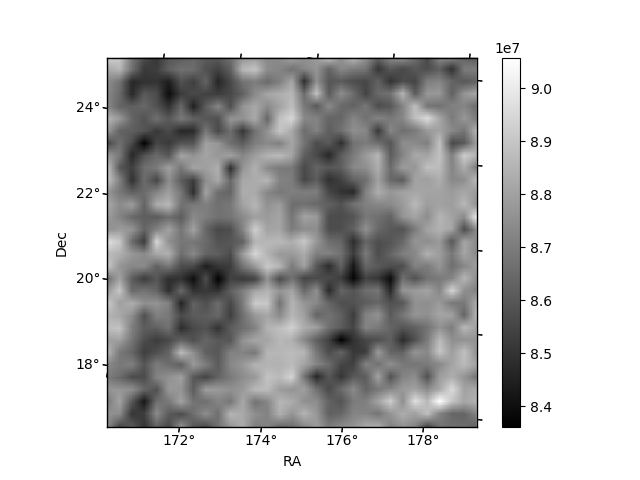
Histogram calculated using DETX and DETY for each event in the final _common_clean file
| Quadrant A | 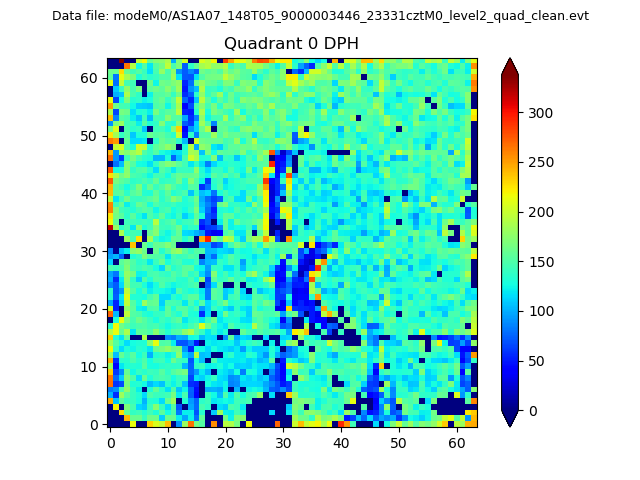 |
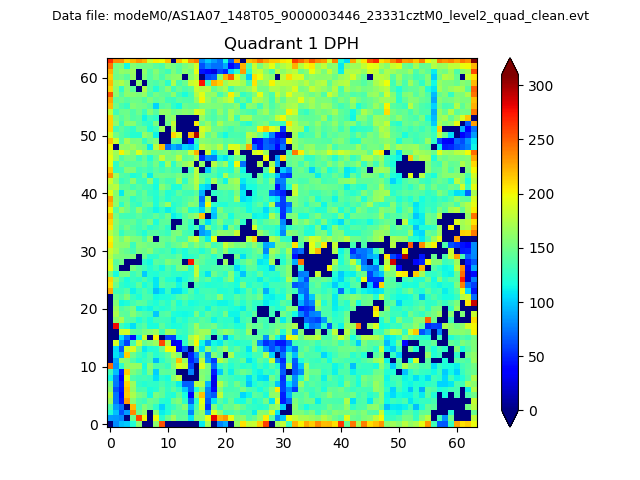 |
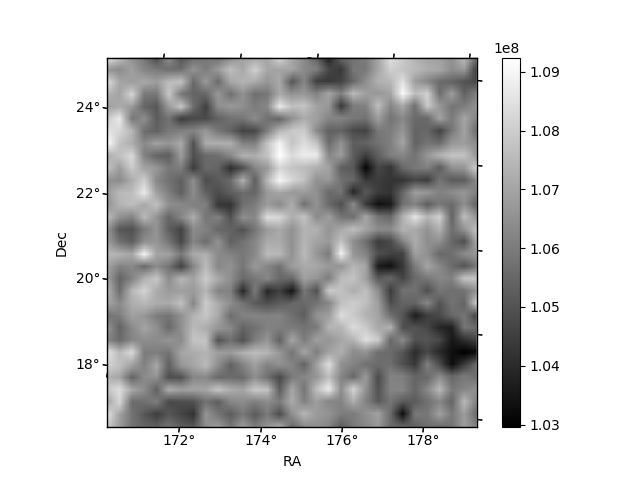
Quadrant B |
|---|---|---|---|
| Quadrant D | 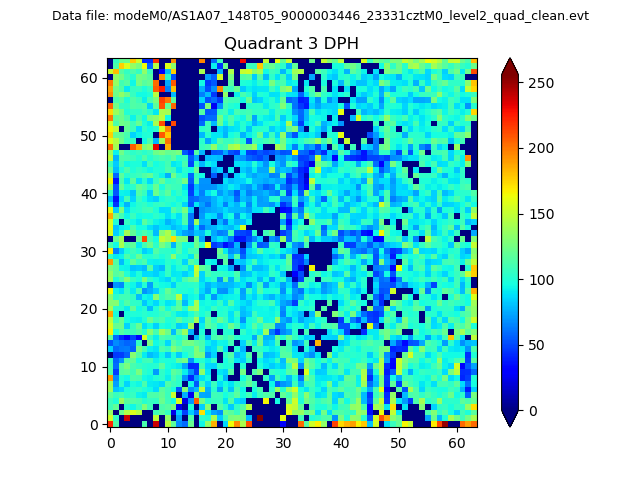 |
 |
Quadrant C |
| Plot type | Count rate plots | Images |
|---|---|---|
| Comparison with Poisson distribution Blue bars denote a histogram of data divided into 1 sec bins. Red curve is a Poisson curve with rate = median count rate of data. |
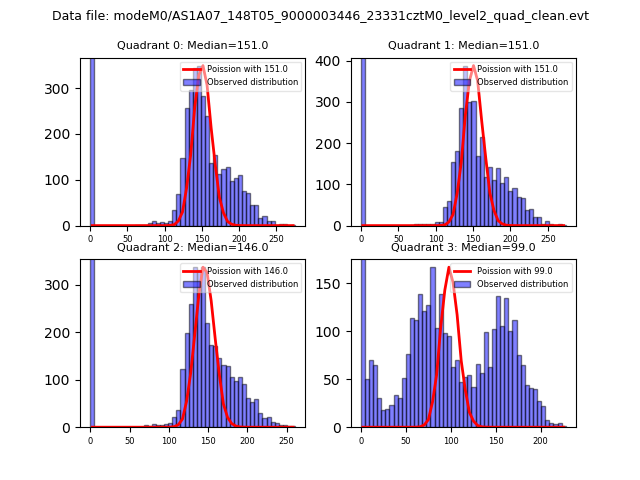 |
 |
| Quadrant-wise count rates Data is divided into 100 sec bins |
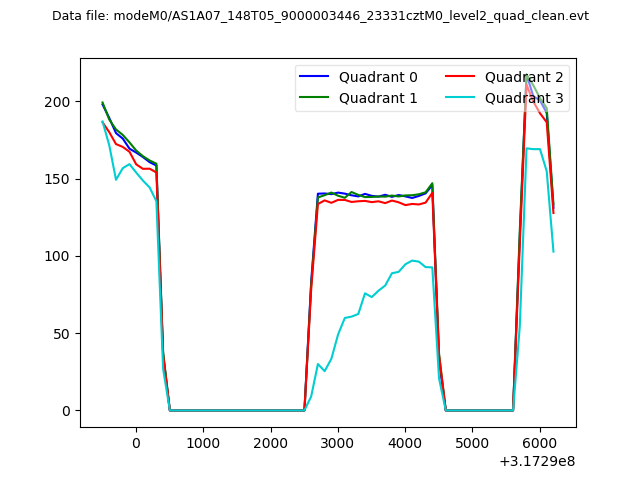 |
|
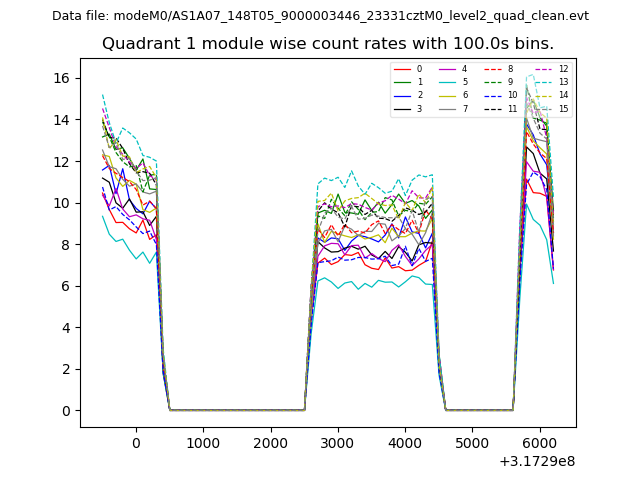
| Module-wise count rates for Quadrant A Data is divided into 100 sec bins |
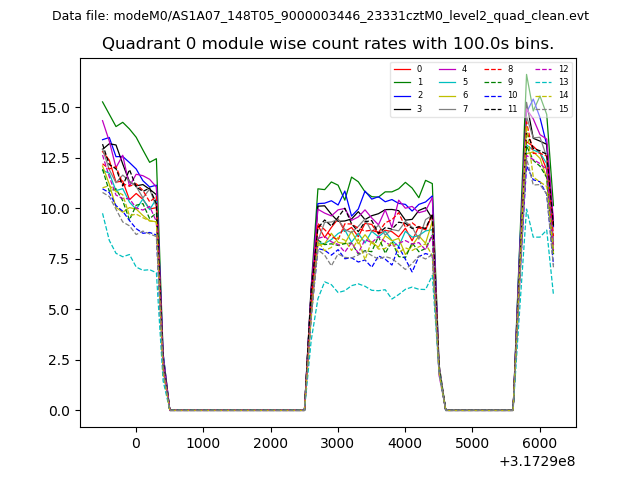 |
 |
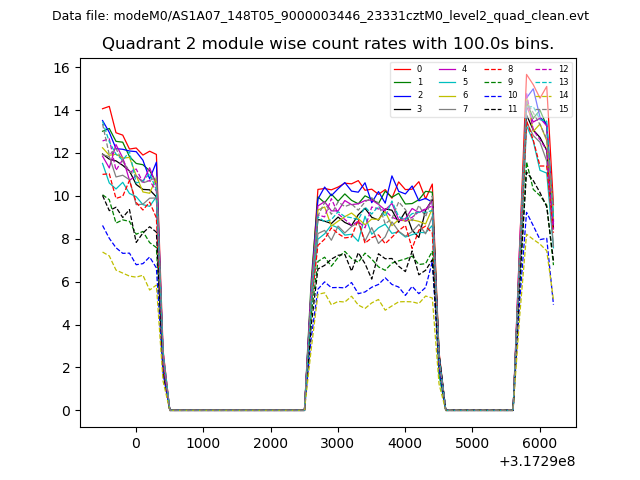
| Module-wise count rates for Quadrant B Data is divided into 100 sec bins |
 |
 |
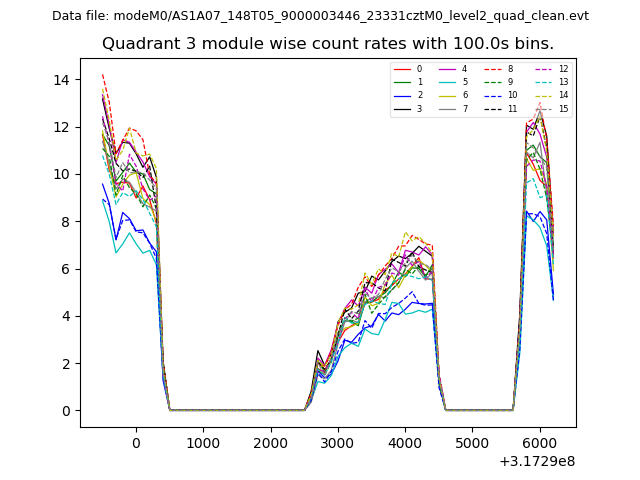
| Module-wise count rates for Quadrant C Data is divided into 100 sec bins |
 |
 |
| Module-wise count rates for Quadrant D Data is divided into 100 sec bins |
 |
 |
| Parameter | Plot |
|---|---|
| CZT HV Monitor | 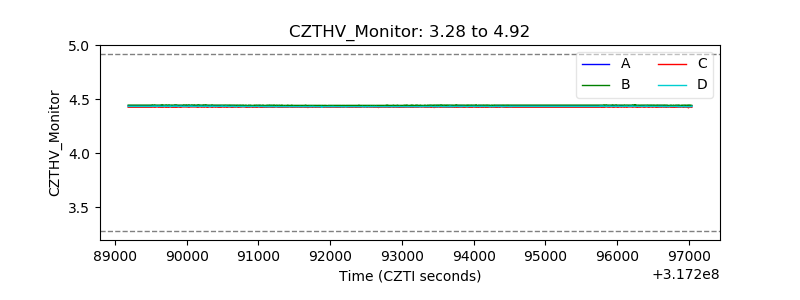 |
| D_VDD | 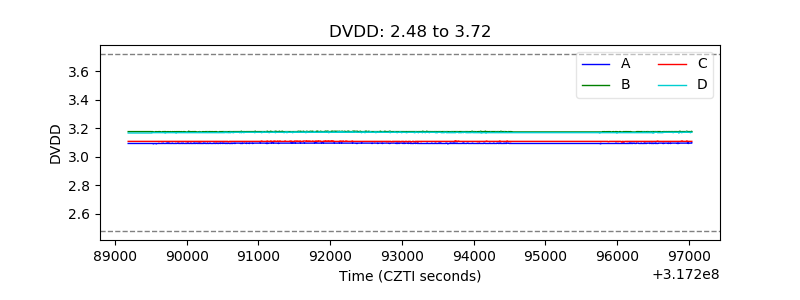 |
| Temperature 1 | 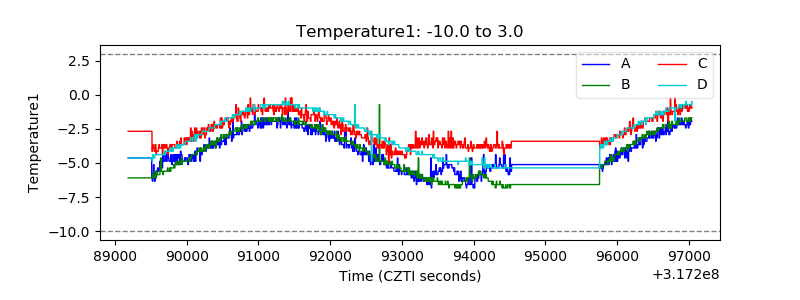 |
| Veto HV Monitor | 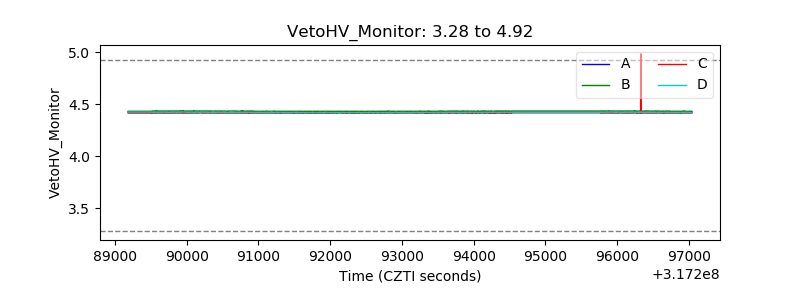 |
| Veto LLD | 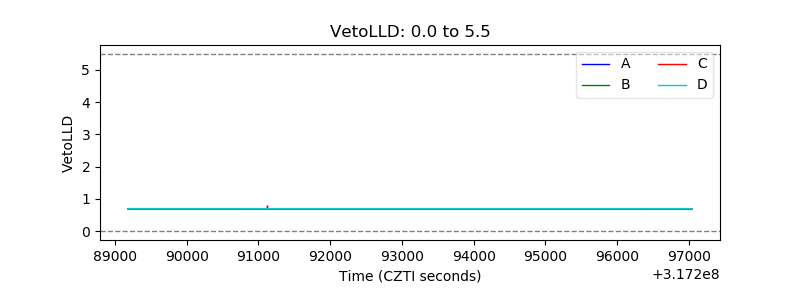 |
| Alpha Counter |  |
| _CPM_Rate | 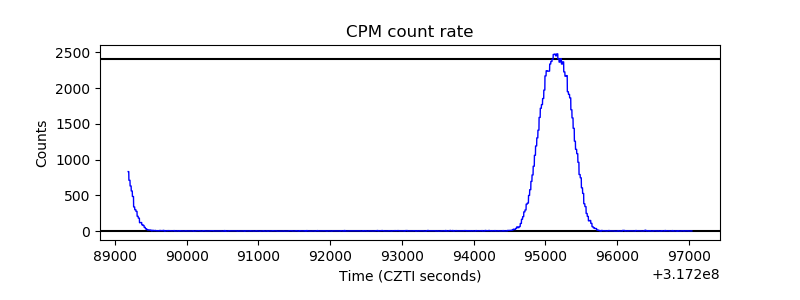 |
| CZT Counter |  |
| +2.5 Volts monitor |  |
| +5 Volts monitor |  |
| _ROLL_ROT | 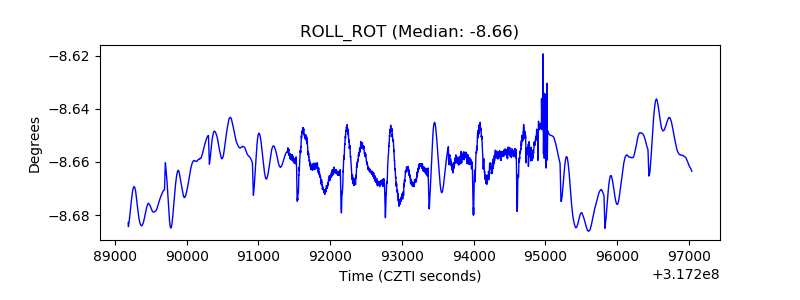 |
| _Roll_DEC | 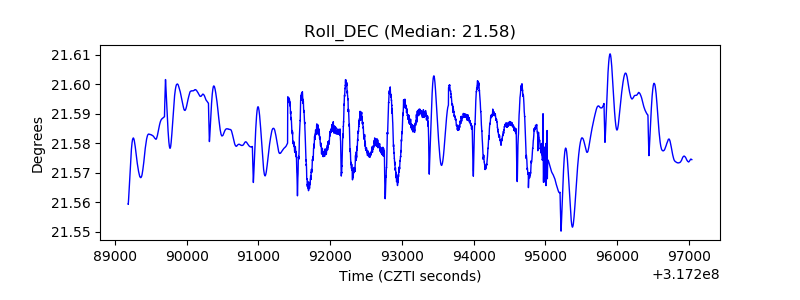 |
| _Roll_RA | 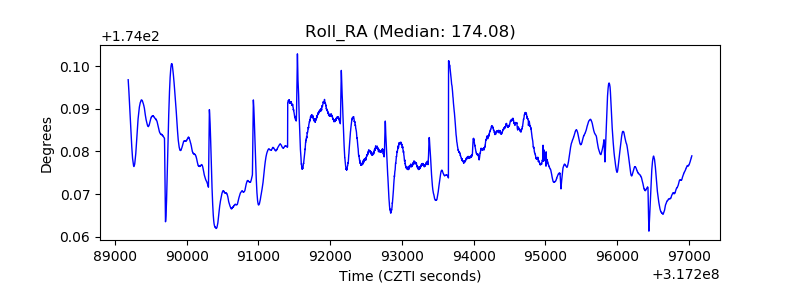 |
| Veto Counter | 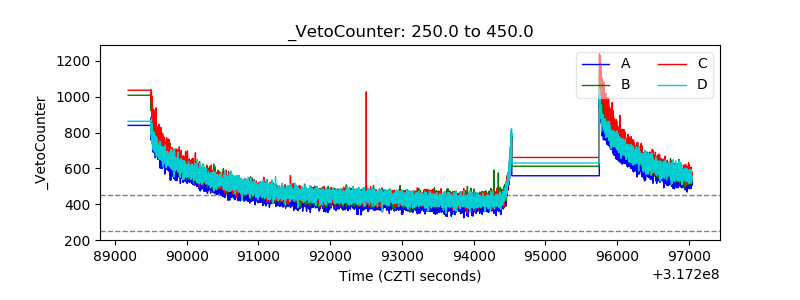 |