| Param | Original file | Final file |
|---|---|---|
| Filename | modeM0/AS1A07_148T05_9000003446_23332cztM0_level2.evt | modeM0/AS1A07_148T05_9000003446_23332cztM0_level2_quad_clean.evt |
| Size (bytes) | 859,452,480 | 70,499,520 |
| Size | 819.6 MB | 67.2 MB |
| Events in quadrant A | 4,441,595 | 445,123 |
| Events in quadrant B | 3,702,373 | 457,694 |
| Events in quadrant C | 3,730,872 | 440,119 |
| Events in quadrant D | 13,713,464 | 335,308 |
| Mode M0 | |||
|---|---|---|---|
| Quadrant | BADHDUFLAG | Total packets | Discarded packets |
| A | 0 | 17549 | 2 |
| B | 0 | 15088 | 3 |
| C | 0 | 15189 | 2 |
| D | 0 | 45197 | 2 |
| Mode SS | |||
|---|---|---|---|
| Quadrant | BADHDUFLAG | Total packets | Discarded packets |
| A | 0 | 132 | 0 |
| B | 0 | 132 | 0 |
| C | 0 | 132 | 0 |
| D | 0 | 132 | 0 |
| Mode M9 | |||
|---|---|---|---|
| Quadrant | BADHDUFLAG | Total packets | Discarded packets |
| A | 0 | 14 | 0 |
| B | 0 | 15 | 0 |
| C | 0 | 15 | 0 |
| D | 0 | 15 | 0 |
| Quadrant | Total seconds | Saturated seconds | Saturation percentage |
|---|---|---|---|
| A | 6535 | 242 | 3.703137% |
| B | 6534 | 77 | 1.178451% |
| C | 6534 | 103 | 1.576370% |
| D | 6534 | 3777 | 57.805326% |
Noise dominated data is calculated using 1-second bins in cleaned event files. If a bin has >2000 counts, and if more than 50% of those come from <1% of pixels, then it is considered to be noise-dominated and hence unusable.
| Quadrant | # 1 sec bins | Bins with >0 counts | Bins with >2000 counts | High rate bins dominated by noise | Noise dominated (total time) | Noise dominated (detector-on time) | Marked lightcurve |
|---|---|---|---|---|---|---|---|
| A | 7840 | 6535 | 168 | 168 | 2.14% | 2.57% | 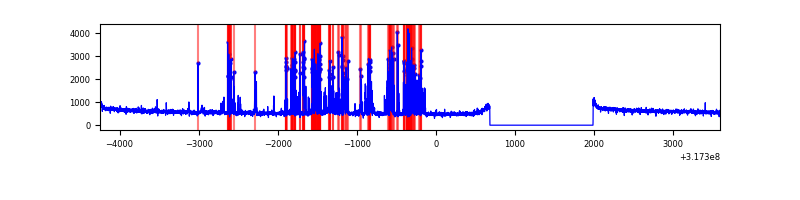 |
| B | 7839 | 6534 | 8 | 8 | 0.10% | 0.12% | 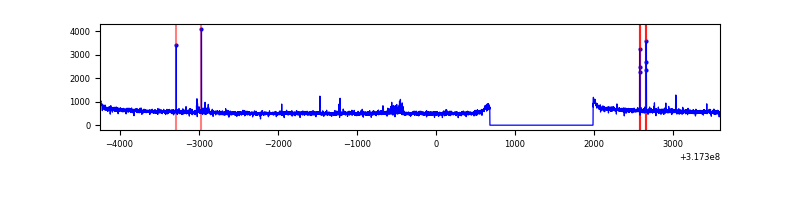 |
| C | 7839 | 6534 | 0 | 0 | 0.00% | 0.00% | 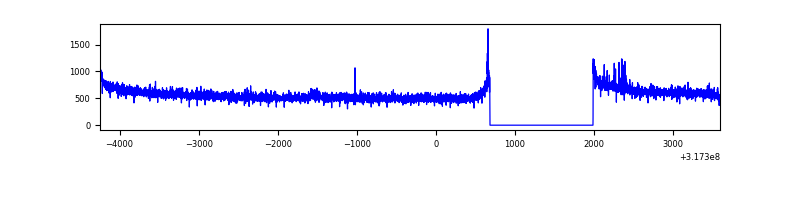 |
| D | 7839 | 6534 | 3727 | 3727 | 47.54% | 57.04% | 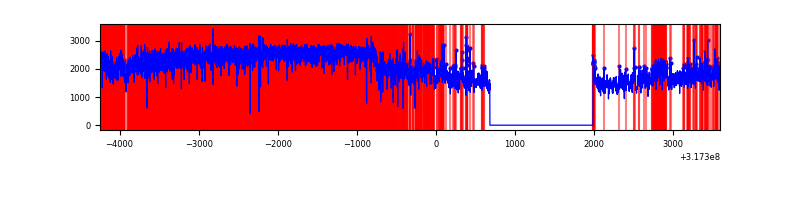 |
Top three noisy pixels from each quadrant. If the there are fewer than three noisy pixels in the level2.evt file, extra rows are filled as -1
| Pixel properties | Quadrant properties | ||||||
|---|---|---|---|---|---|---|---|
| Quadrant | DetID | PixID | Counts | Sigma | Mean | Median | Sigma |
| A | 6 | 16 | 827344 | 4425.19 | 939 | 926 | 186.8 |
| A | 13 | 254 | 9679 | 46.87 | 939 | 926 | 186.8 |
| A | 0 | 226 | 8152 | 38.69 | 939 | 926 | 186.8 |
| B | 0 | 230 | 37163 | 210.54 | 927 | 910 | 172.2 |
| B | 4 | 216 | 24673 | 138.0 | 927 | 910 | 172.2 |
| B | 12 | 111 | 19491 | 107.91 | 927 | 910 | 172.2 |
| C | 14 | 238 | 146411 | 698.38 | 905 | 914 | 208.3 |
| C | 10 | 9 | 23832 | 110.01 | 905 | 914 | 208.3 |
| C | 7 | 247 | 22655 | 104.36 | 905 | 914 | 208.3 |
| D | 7 | 223 | 10177906 | 56618.38 | 747 | 726 | 179.8 |
| D | 7 | 238 | 353815 | 1964.33 | 747 | 726 | 179.8 |
| D | 1 | 52 | 185687 | 1028.99 | 747 | 726 | 179.8 |
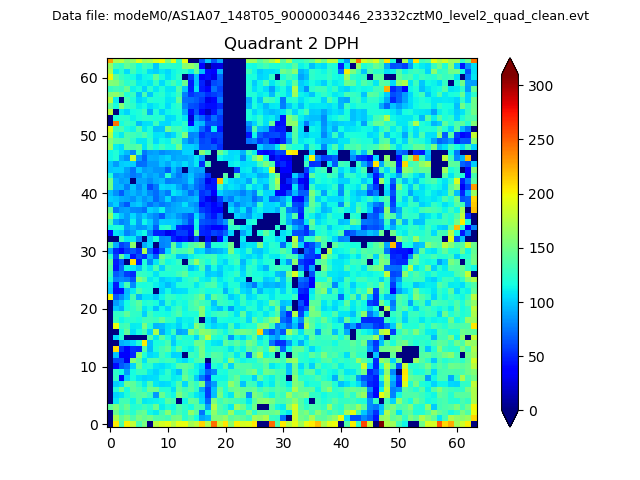
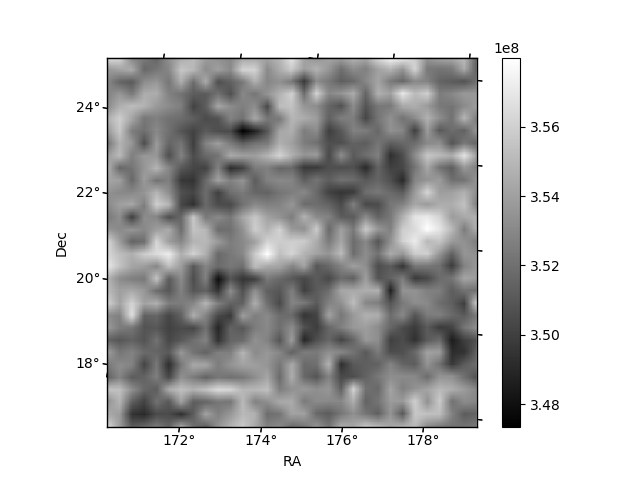
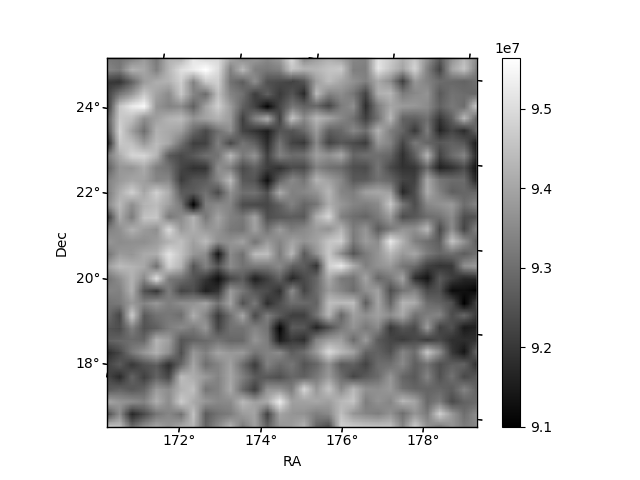
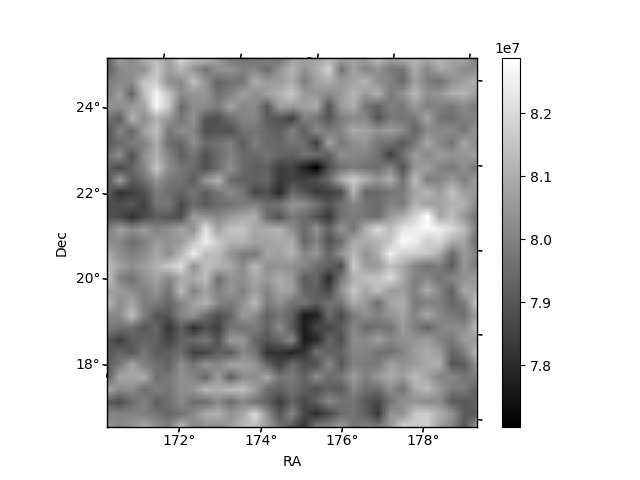
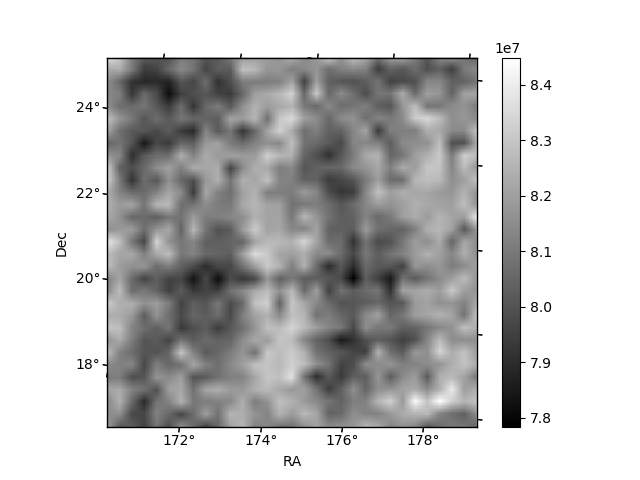
Histogram calculated using DETX and DETY for each event in the final _common_clean file
| Quadrant A | 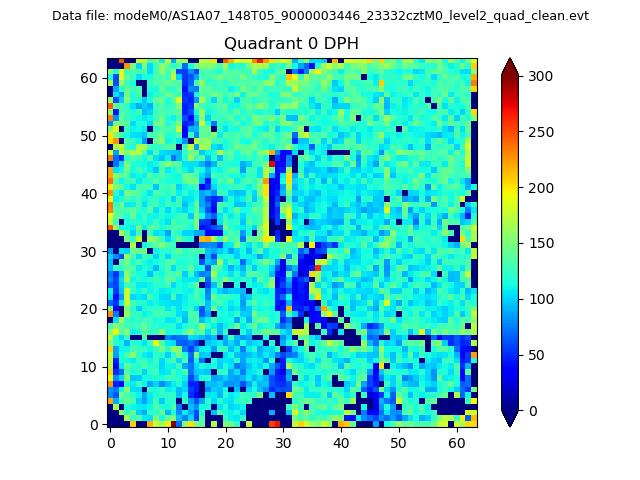 |
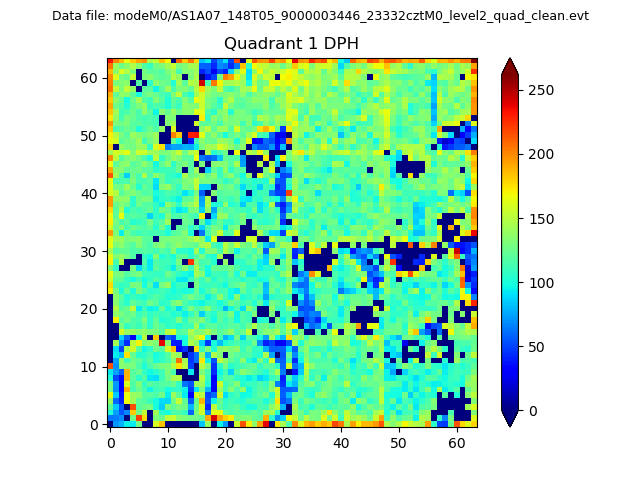 |
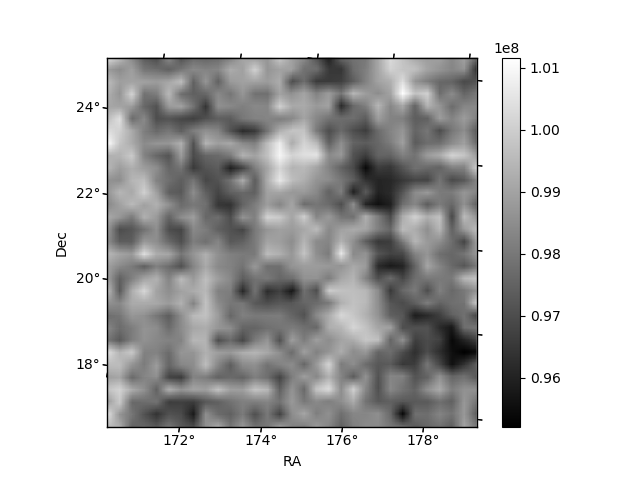
Quadrant B |
|---|---|---|---|
| Quadrant D | 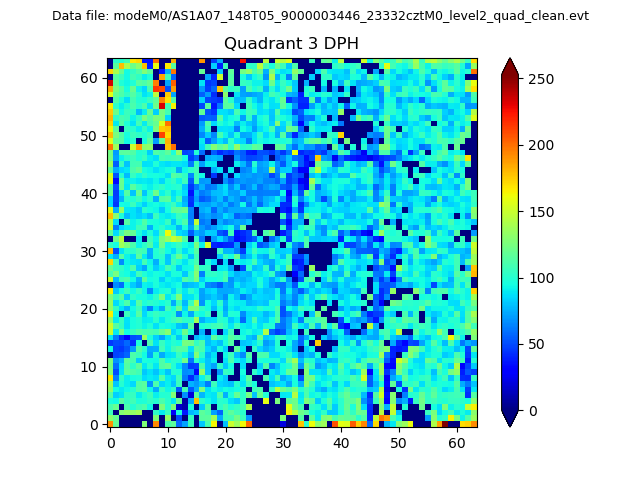 |
 |
Quadrant C |
| Plot type | Count rate plots | Images |
|---|---|---|
| Comparison with Poisson distribution Blue bars denote a histogram of data divided into 1 sec bins. Red curve is a Poisson curve with rate = median count rate of data. |
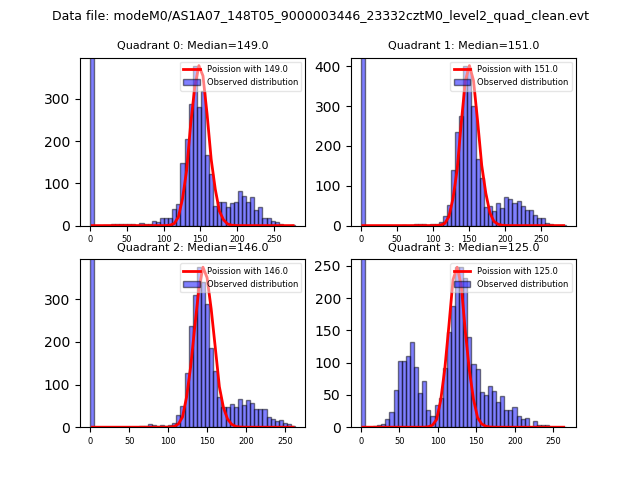 |
 |
| Quadrant-wise count rates Data is divided into 100 sec bins |
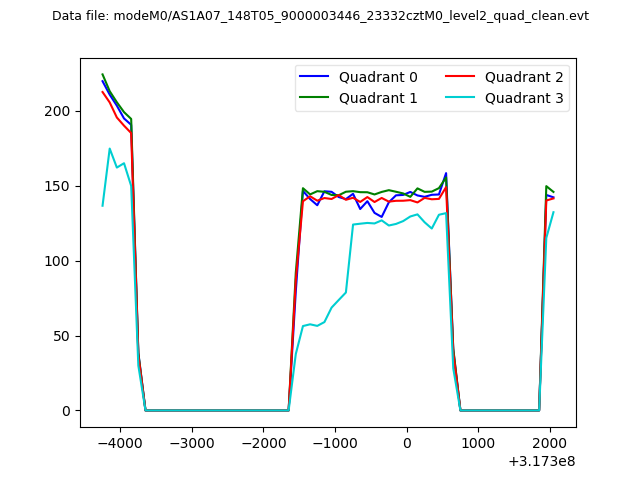 |
|
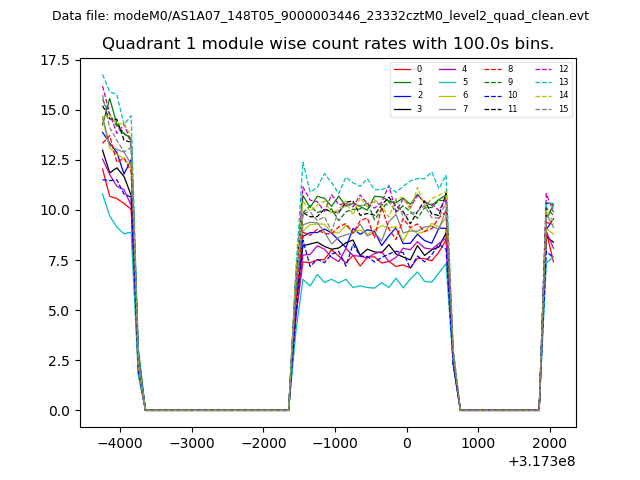
| Module-wise count rates for Quadrant A Data is divided into 100 sec bins |
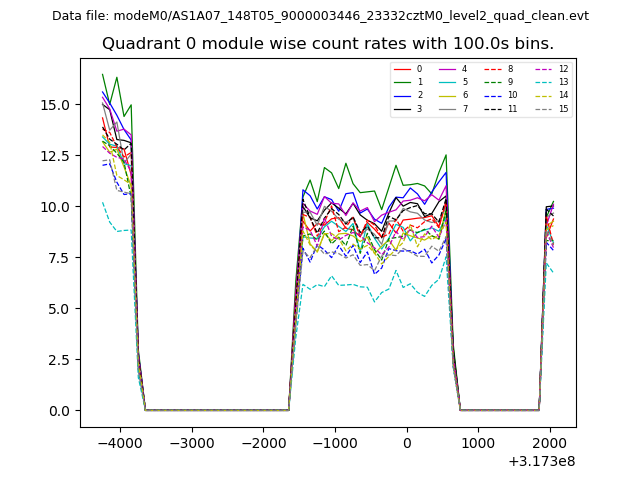 |
 |
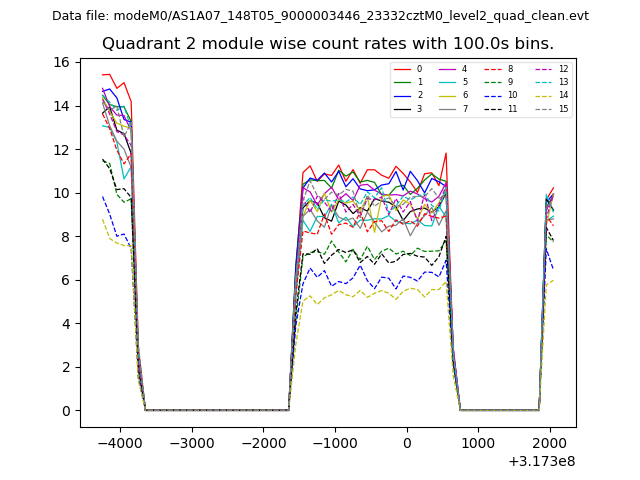
| Module-wise count rates for Quadrant B Data is divided into 100 sec bins |
 |
 |
| Module-wise count rates for Quadrant C Data is divided into 100 sec bins |
 |
 |
| Module-wise count rates for Quadrant D Data is divided into 100 sec bins |
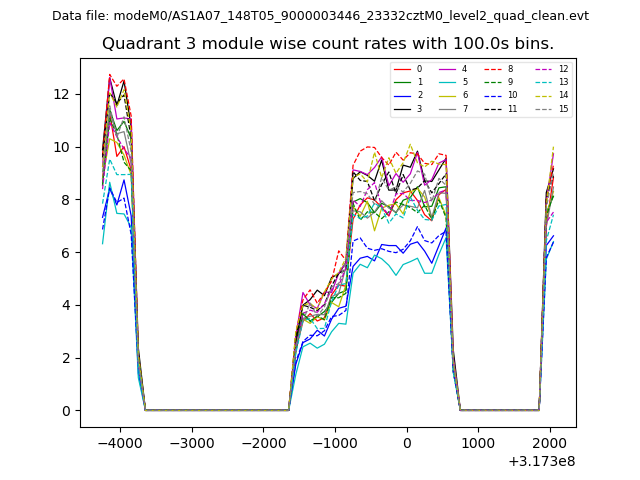 |
 |
| Parameter | Plot |
|---|---|
| CZT HV Monitor | 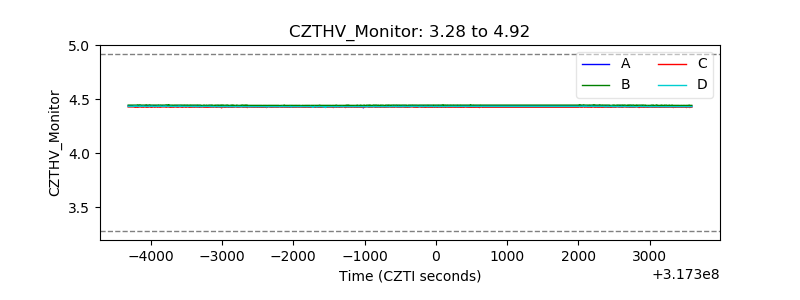 |
| D_VDD | 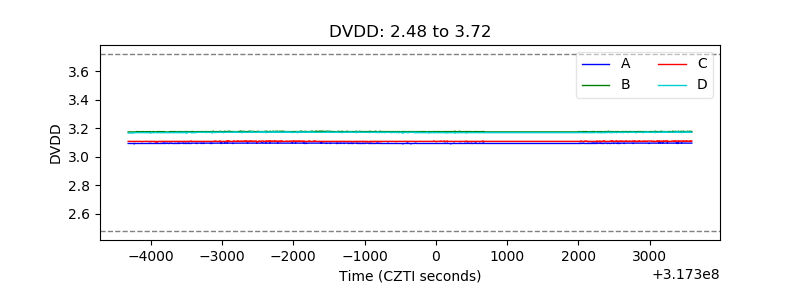 |
| Temperature 1 | 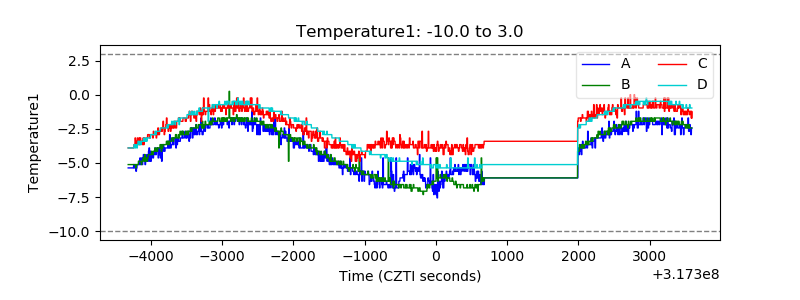 |
| Veto HV Monitor | 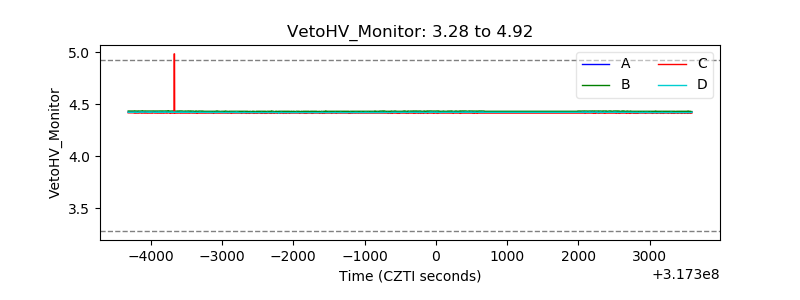 |
| Veto LLD | 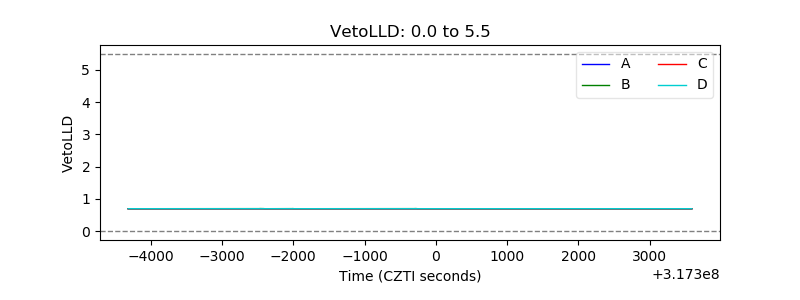 |
| Alpha Counter | 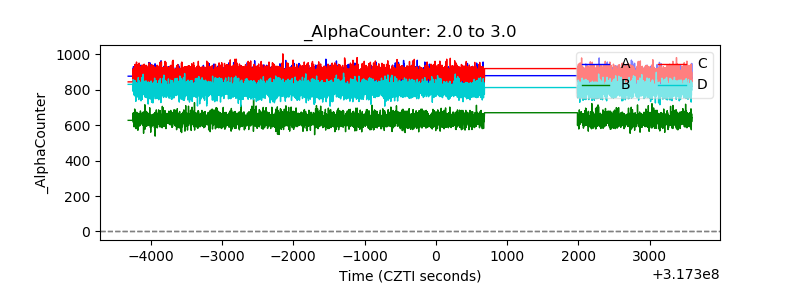 |
| _CPM_Rate | 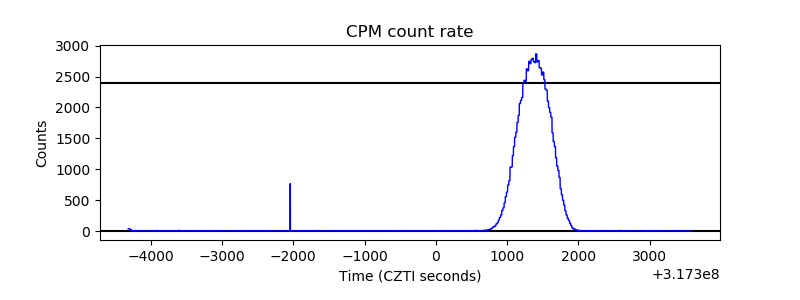 |
| CZT Counter | 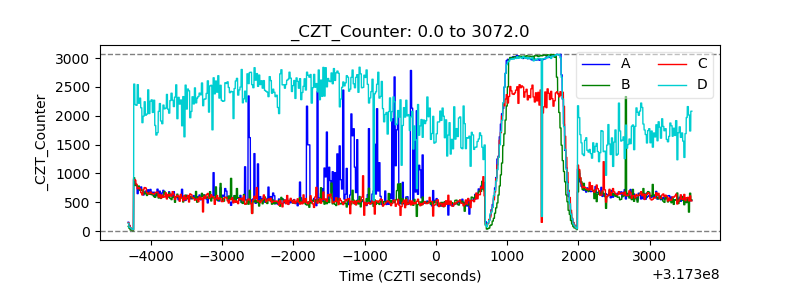 |
| +2.5 Volts monitor | 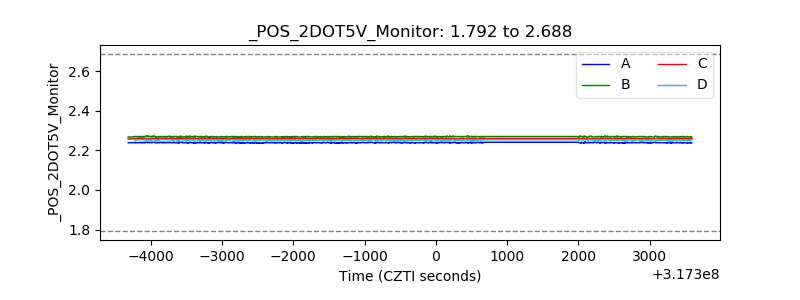 |
| +5 Volts monitor |  |
| _ROLL_ROT | 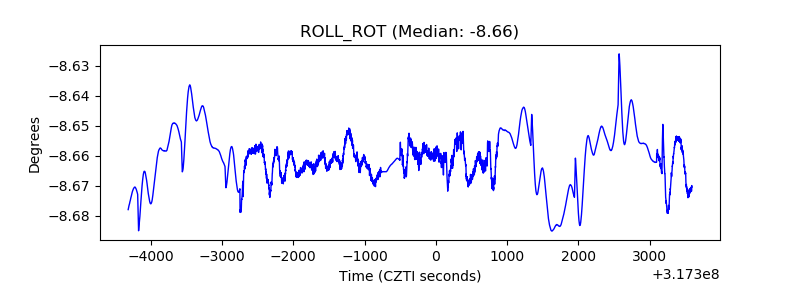 |
| _Roll_DEC | 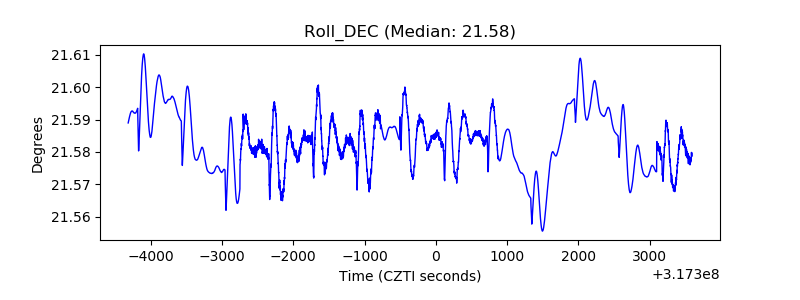 |
| _Roll_RA | 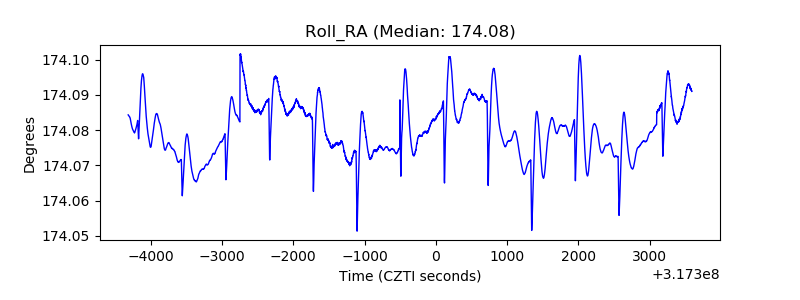 |
| Veto Counter | 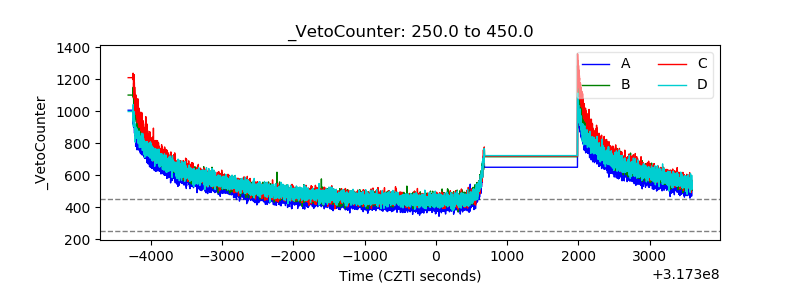 |