| Param | Original file | Final file |
|---|---|---|
| Filename | modeM0/AS1A07_148T05_9000003446_23333cztM0_level2.evt | modeM0/AS1A07_148T05_9000003446_23333cztM0_level2_quad_clean.evt |
| Size (bytes) | 471,499,200 | 47,741,760 |
| Size | 449.7 MB | 45.5 MB |
| Events in quadrant A | 2,260,671 | 297,920 |
| Events in quadrant B | 2,294,809 | 297,820 |
| Events in quadrant C | 2,422,732 | 288,408 |
| Events in quadrant D | 7,016,017 | 264,134 |
| Mode M0 | |||
|---|---|---|---|
| Quadrant | BADHDUFLAG | Total packets | Discarded packets |
| A | 0 | 9301 | 0 |
| B | 0 | 9406 | 0 |
| C | 0 | 9808 | 0 |
| D | 0 | 23828 | 0 |
| Mode SS | |||
|---|---|---|---|
| Quadrant | BADHDUFLAG | Total packets | Discarded packets |
| A | 0 | 84 | 0 |
| B | 0 | 84 | 0 |
| C | 0 | 84 | 0 |
| D | 0 | 84 | 0 |
| Quadrant | Total seconds | Saturated seconds | Saturation percentage |
|---|---|---|---|
| A | 4215 | 4 | 0.094899% |
| B | 4216 | 10 | 0.237192% |
| C | 4216 | 30 | 0.711575% |
| D | 4216 | 689 | 16.342505% |
Noise dominated data is calculated using 1-second bins in cleaned event files. If a bin has >2000 counts, and if more than 50% of those come from <1% of pixels, then it is considered to be noise-dominated and hence unusable.
| Quadrant | # 1 sec bins | Bins with >0 counts | Bins with >2000 counts | High rate bins dominated by noise | Noise dominated (total time) | Noise dominated (detector-on time) | Marked lightcurve |
|---|---|---|---|---|---|---|---|
| A | 4215 | 4215 | 0 | 0 | 0.00% | 0.00% | 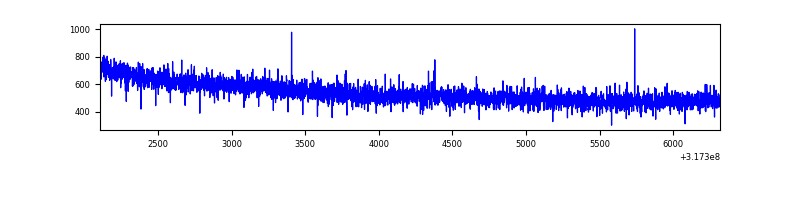 |
| B | 4216 | 4216 | 7 | 7 | 0.17% | 0.17% | 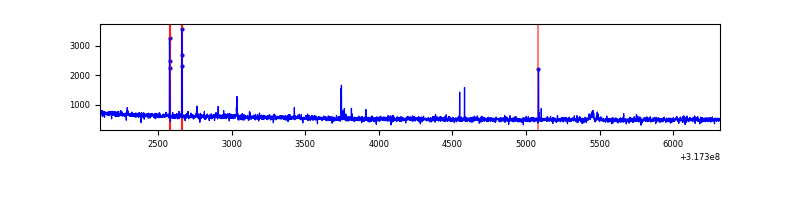 |
| C | 4216 | 4216 | 11 | 11 | 0.26% | 0.26% | 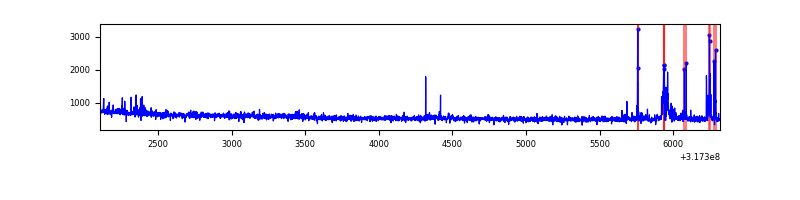 |
| D | 4216 | 4216 | 760 | 760 | 18.03% | 18.03% | 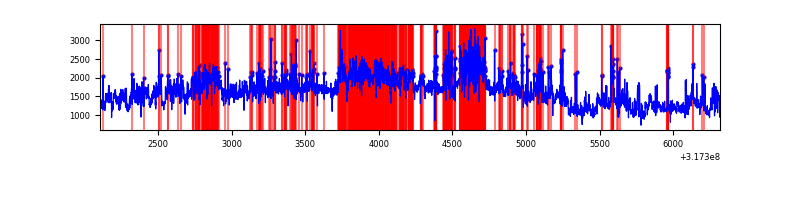 |
Top three noisy pixels from each quadrant. If the there are fewer than three noisy pixels in the level2.evt file, extra rows are filled as -1
| Pixel properties | Quadrant properties | ||||||
|---|---|---|---|---|---|---|---|
| Quadrant | DetID | PixID | Counts | Sigma | Mean | Median | Sigma |
| A | 6 | 16 | 12629 | 103.19 | 583 | 575 | 116.8 |
| A | 13 | 254 | 6249 | 48.57 | 583 | 575 | 116.8 |
| A | 0 | 226 | 5150 | 39.16 | 583 | 575 | 116.8 |
| B | 4 | 216 | 20661 | 188.21 | 575 | 564 | 106.8 |
| B | 0 | 230 | 13623 | 122.3 | 575 | 564 | 106.8 |
| B | 12 | 111 | 11708 | 104.36 | 575 | 564 | 106.8 |
| C | 10 | 9 | 110085 | 842.72 | 564 | 571 | 130.0 |
| C | 14 | 238 | 91046 | 696.21 | 564 | 571 | 130.0 |
| C | 7 | 247 | 16459 | 122.26 | 564 | 571 | 130.0 |
| D | 7 | 223 | 4111686 | 30642.89 | 555 | 541 | 134.2 |
| D | 1 | 52 | 575042 | 4282.11 | 555 | 541 | 134.2 |
| D | 7 | 238 | 169159 | 1256.81 | 555 | 541 | 134.2 |
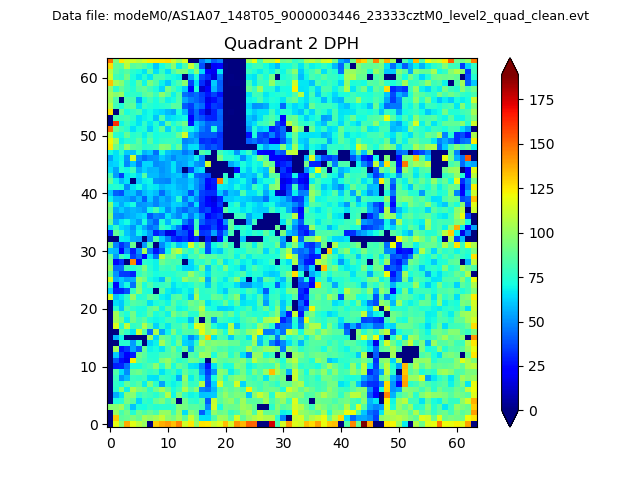
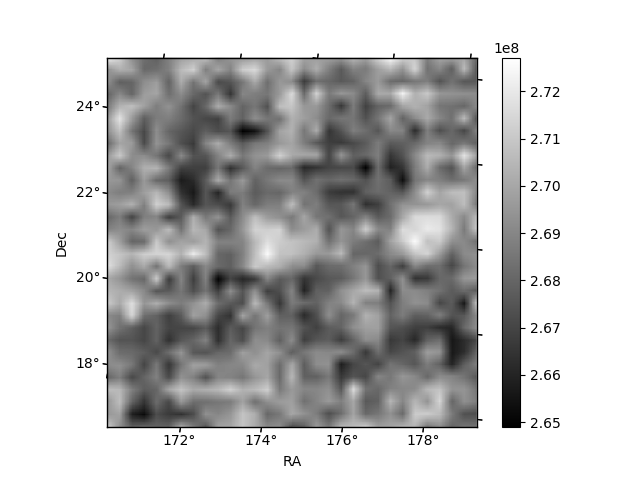
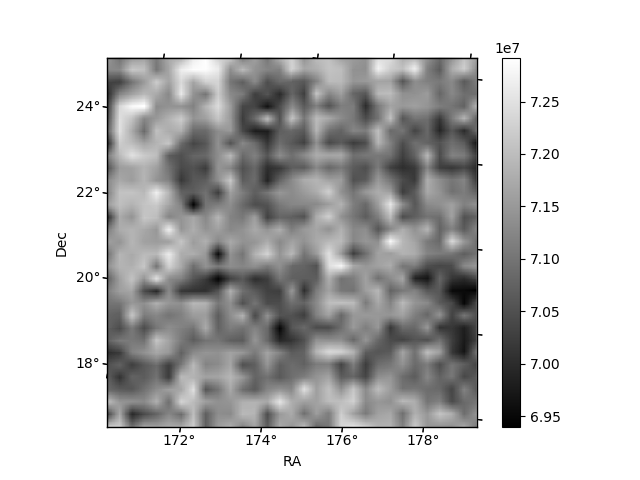
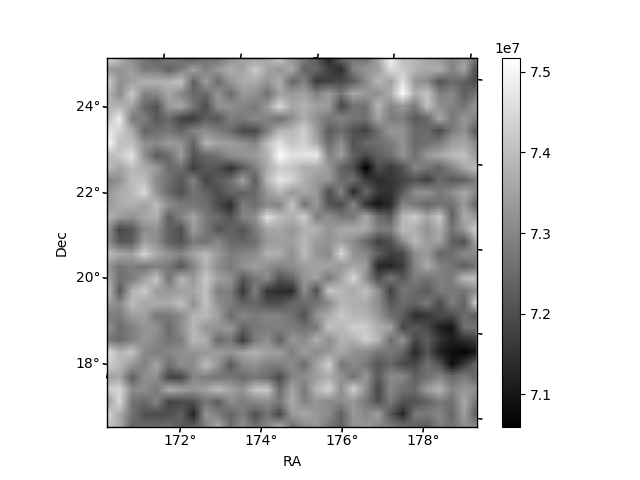
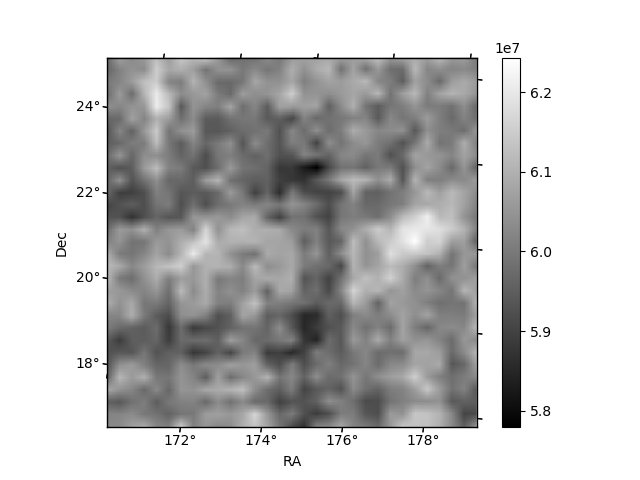
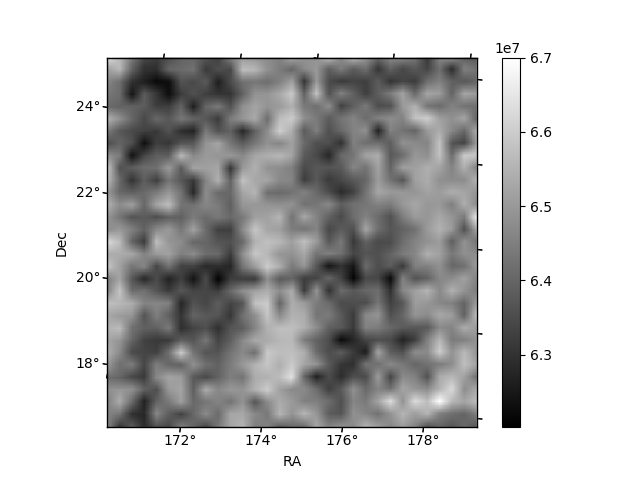
Histogram calculated using DETX and DETY for each event in the final _common_clean file
| Quadrant A | 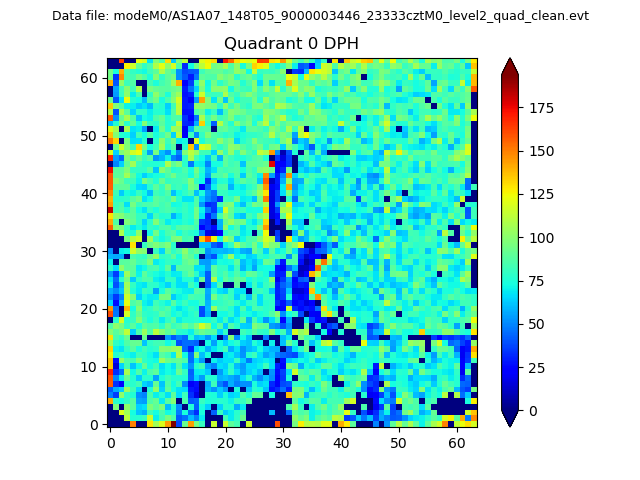 |
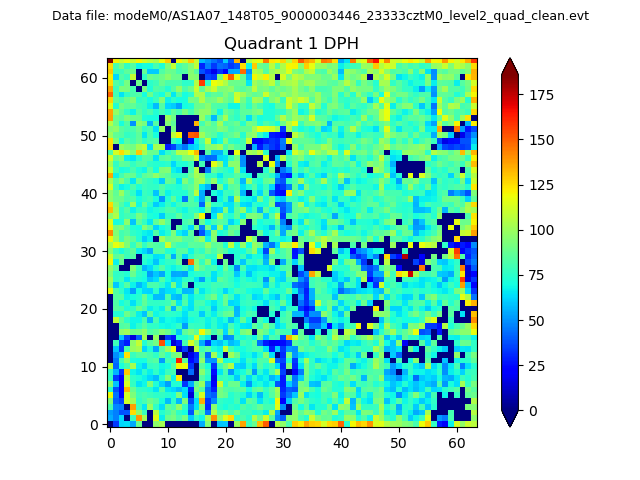 |
Quadrant B |
|---|---|---|---|
| Quadrant D | 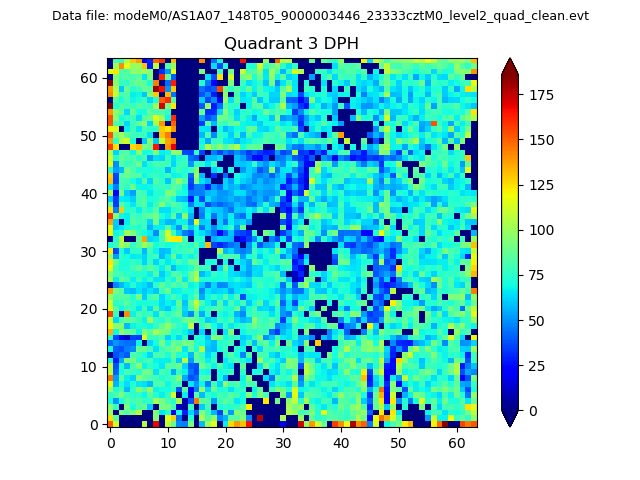 |
 |
Quadrant C |
| Plot type | Count rate plots | Images |
|---|---|---|
| Comparison with Poisson distribution Blue bars denote a histogram of data divided into 1 sec bins. Red curve is a Poisson curve with rate = median count rate of data. |
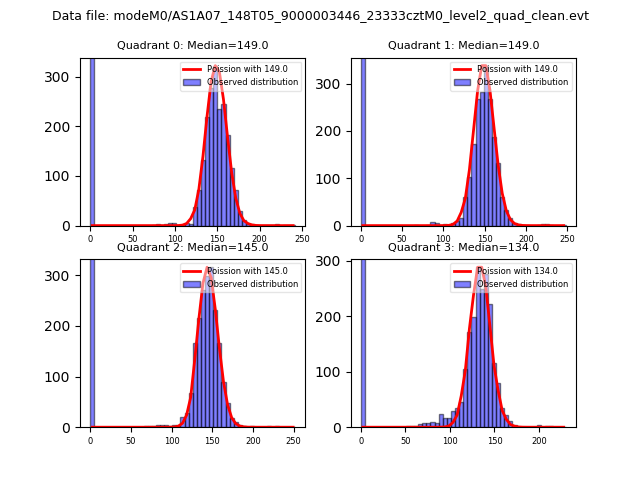 |
 |
| Quadrant-wise count rates Data is divided into 100 sec bins |
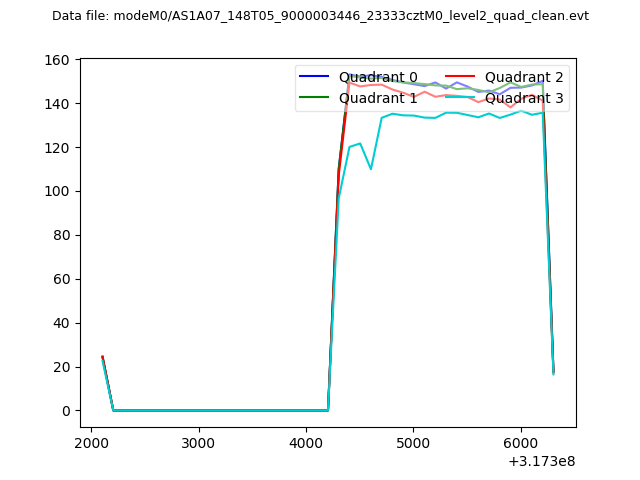 |
|
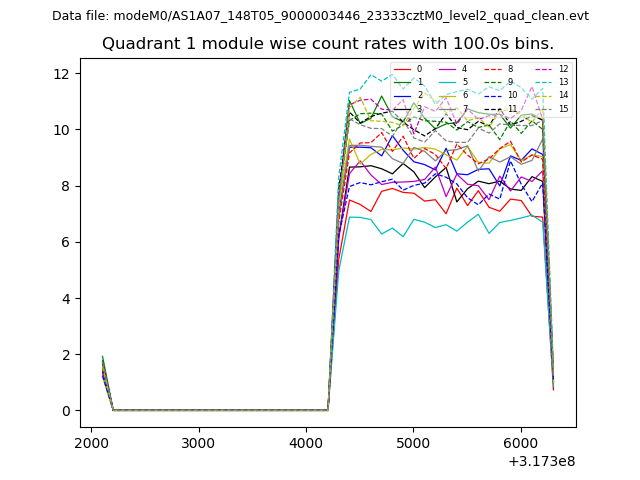
| Module-wise count rates for Quadrant A Data is divided into 100 sec bins |
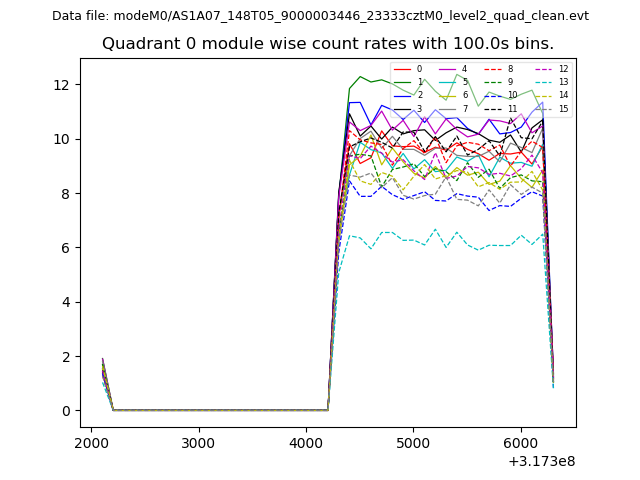 |
 |
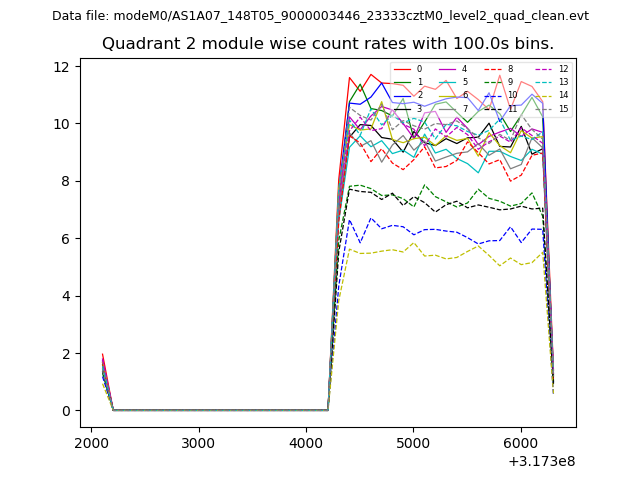
| Module-wise count rates for Quadrant B Data is divided into 100 sec bins |
 |
 |
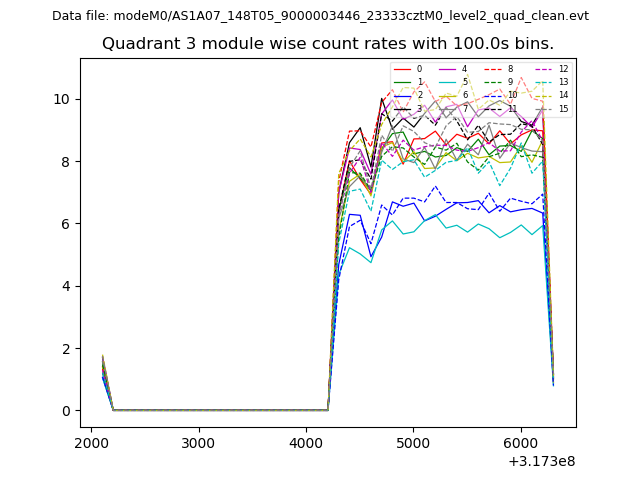
| Module-wise count rates for Quadrant C Data is divided into 100 sec bins |
 |
 |
| Module-wise count rates for Quadrant D Data is divided into 100 sec bins |
 |
 |
| Parameter | Plot |
|---|---|
| CZT HV Monitor | 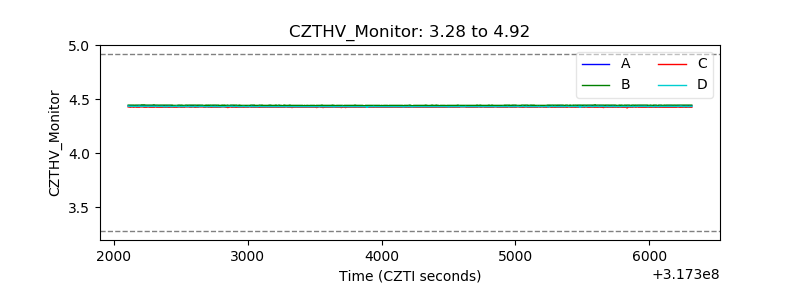 |
| D_VDD | 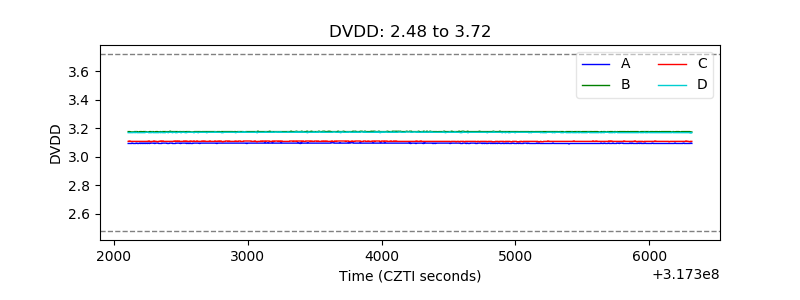 |
| Temperature 1 | 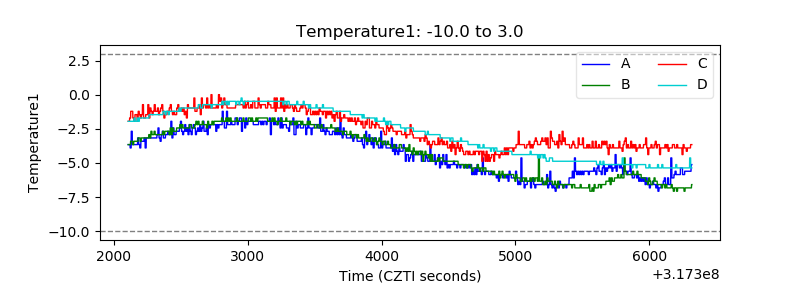 |
| Veto HV Monitor | 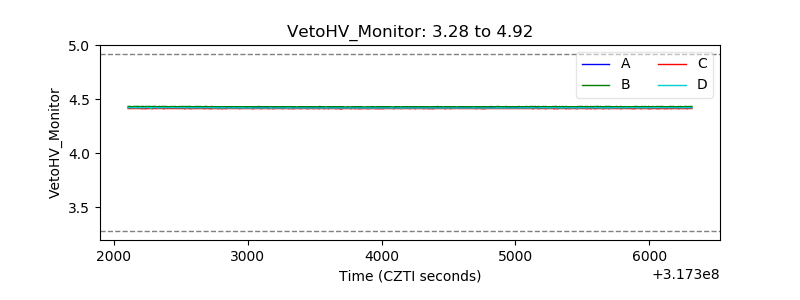 |
| Veto LLD | 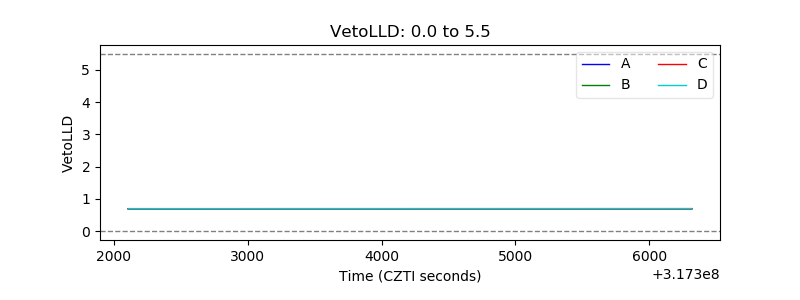 |
| Alpha Counter | 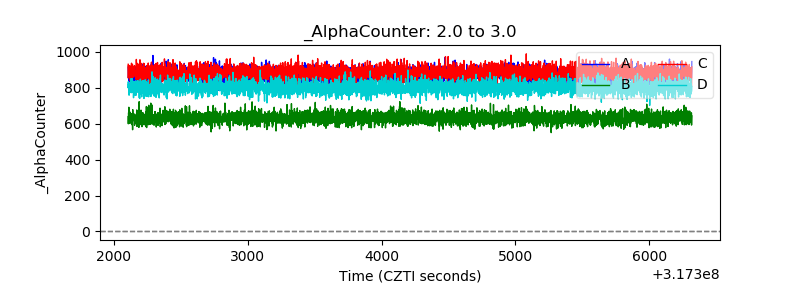 |
| _CPM_Rate | 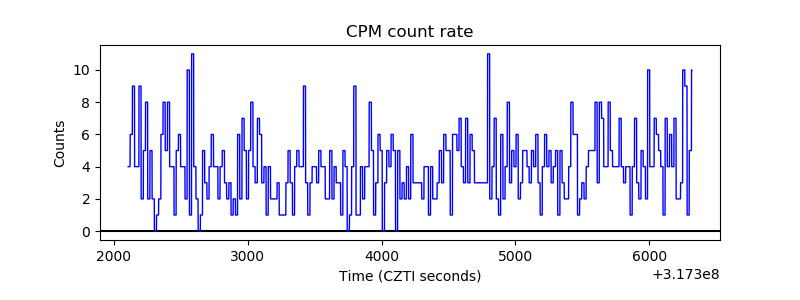 |
| CZT Counter |  |
| +2.5 Volts monitor |  |
| +5 Volts monitor | 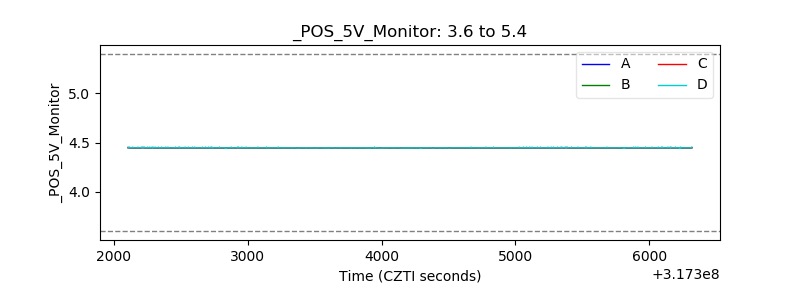 |
| _ROLL_ROT | 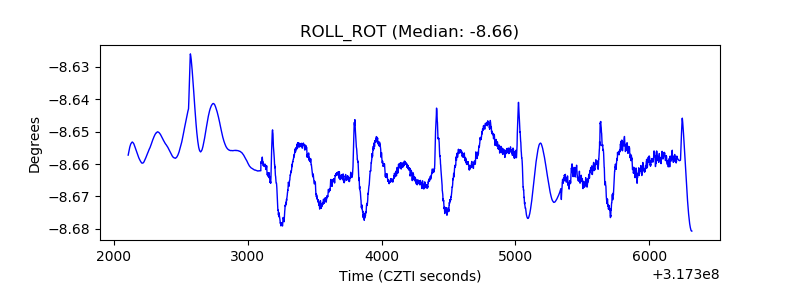 |
| _Roll_DEC | 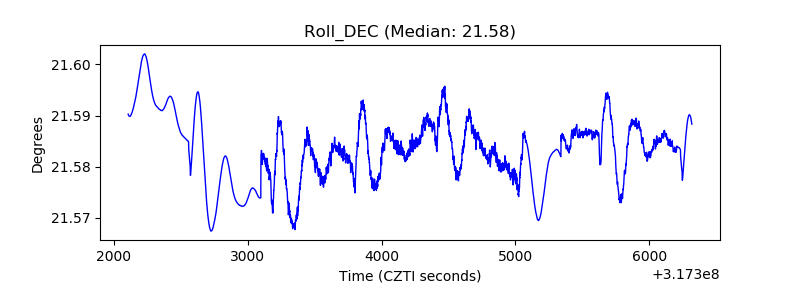 |
| _Roll_RA | 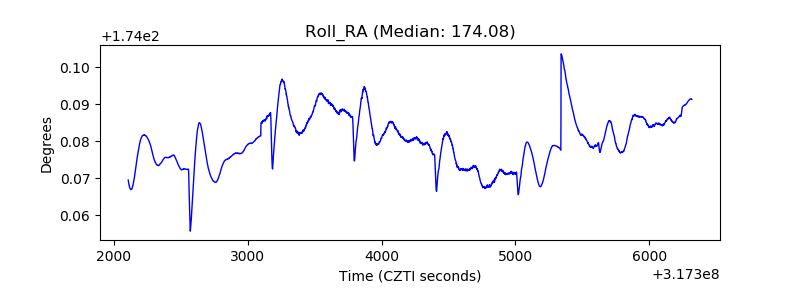 |
| Veto Counter |  |