| Param | Original file | Final file |
|---|---|---|
| Filename | modeM0/AS1A07_135T02_9000003450_23337cztM0_level2.evt | modeM0/AS1A07_135T02_9000003450_23337cztM0_level2_quad_clean.evt |
| Size (bytes) | 829,837,440 | 71,521,920 |
| Size | 791.4 MB | 68.2 MB |
| Events in quadrant A | 3,483,971 | 445,075 |
| Events in quadrant B | 3,535,811 | 452,536 |
| Events in quadrant C | 3,561,307 | 443,245 |
| Events in quadrant D | 14,068,597 | 327,638 |
| Mode M9 | |||
|---|---|---|---|
| Quadrant | BADHDUFLAG | Total packets | Discarded packets |
| A | 0 | 4 | 1 |
| B | 0 | 5 | 1 |
| C | 0 | 5 | 1 |
| D | 0 | 5 | 1 |
| Mode M0 | |||
|---|---|---|---|
| Quadrant | BADHDUFLAG | Total packets | Discarded packets |
| A | 0 | 15034 | 219 |
| B | 0 | 15095 | 227 |
| C | 0 | 15131 | 238 |
| D | 0 | 47191 | 701 |
| Mode SS | |||
|---|---|---|---|
| Quadrant | BADHDUFLAG | Total packets | Discarded packets |
| A | 0 | 148 | 4 |
| B | 0 | 147 | 3 |
| C | 0 | 146 | 4 |
| D | 0 | 148 | 6 |
| Quadrant | Total seconds | Saturated seconds | Saturation percentage |
|---|---|---|---|
| A | 7122 | 80 | 1.123280% |
| B | 7121 | 100 | 1.404297% |
| C | 7121 | 155 | 2.176661% |
| D | 7102 | 4900 | 68.994649% |
Noise dominated data is calculated using 1-second bins in cleaned event files. If a bin has >2000 counts, and if more than 50% of those come from <1% of pixels, then it is considered to be noise-dominated and hence unusable.
| Quadrant | # 1 sec bins | Bins with >0 counts | Bins with >2000 counts | High rate bins dominated by noise | Noise dominated (total time) | Noise dominated (detector-on time) | Marked lightcurve |
|---|---|---|---|---|---|---|---|
| A | 7777 | 7137 | 0 | 0 | 0.00% | 0.00% | 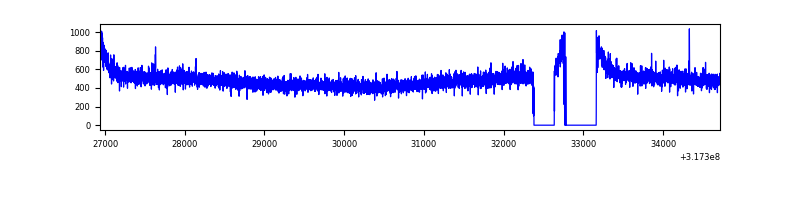 |
| B | 7777 | 7129 | 0 | 0 | 0.00% | 0.00% | 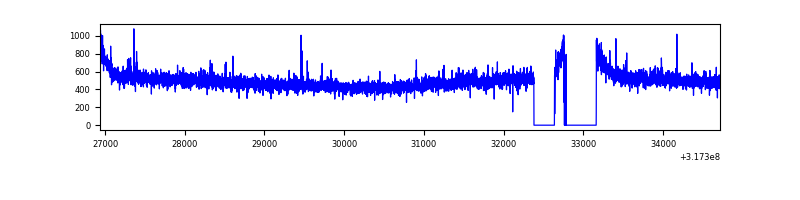 |
| C | 7777 | 7132 | 0 | 0 | 0.00% | 0.00% | 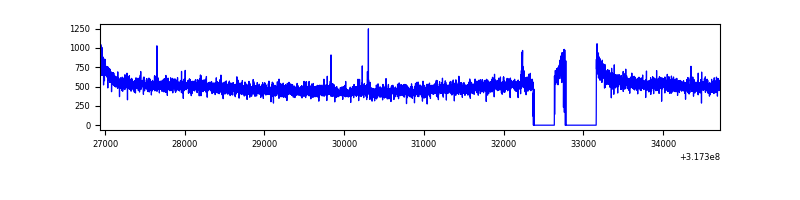 |
| D | 7777 | 7105 | 4948 | 4948 | 63.62% | 69.64% | 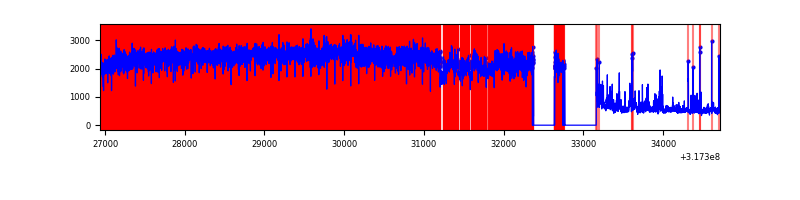 |
Top three noisy pixels from each quadrant. If the there are fewer than three noisy pixels in the level2.evt file, extra rows are filled as -1
| Pixel properties | Quadrant properties | ||||||
|---|---|---|---|---|---|---|---|
| Quadrant | DetID | PixID | Counts | Sigma | Mean | Median | Sigma |
| A | 13 | 254 | 10882 | 54.51 | 902 | 881 | 183.5 |
| A | 3 | 137 | 8146 | 39.6 | 902 | 881 | 183.5 |
| A | 0 | 226 | 7696 | 37.15 | 902 | 881 | 183.5 |
| B | 12 | 111 | 21114 | 117.06 | 893 | 870 | 172.9 |
| B | 11 | 111 | 18942 | 104.5 | 893 | 870 | 172.9 |
| B | 14 | 111 | 16109 | 88.12 | 893 | 870 | 172.9 |
| C | 14 | 238 | 135610 | 655.75 | 869 | 873 | 205.5 |
| C | 7 | 247 | 15863 | 72.95 | 869 | 873 | 205.5 |
| C | 10 | 9 | 9881 | 43.84 | 869 | 873 | 205.5 |
| D | 7 | 223 | 10818670 | 62789.4 | 704 | 685 | 172.3 |
| D | 1 | 52 | 268420 | 1553.98 | 704 | 685 | 172.3 |
| D | 12 | 227 | 137621 | 794.8 | 704 | 685 | 172.3 |
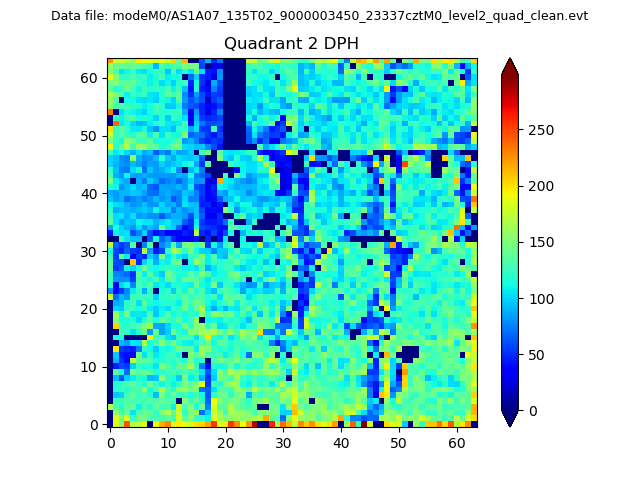
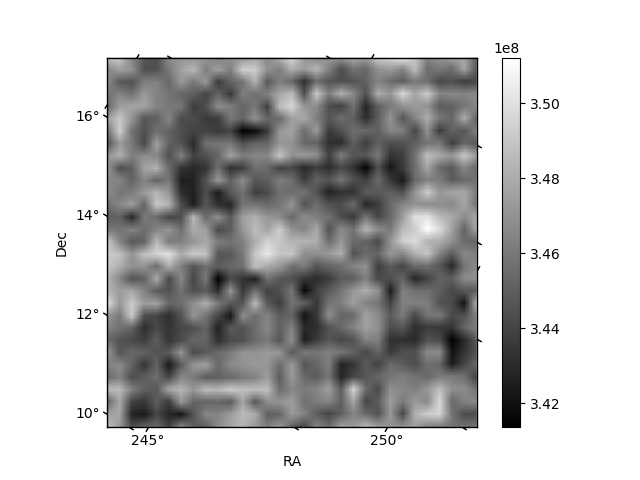
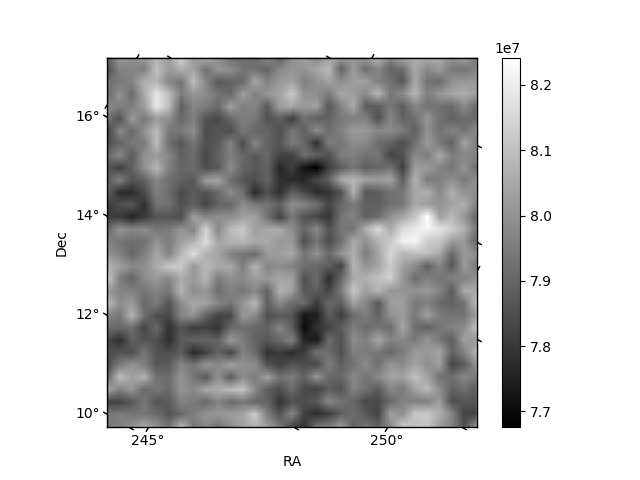
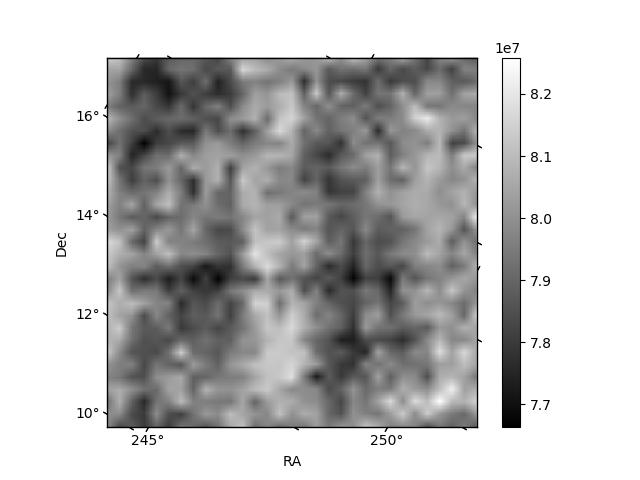
Histogram calculated using DETX and DETY for each event in the final _common_clean file
| Quadrant A | 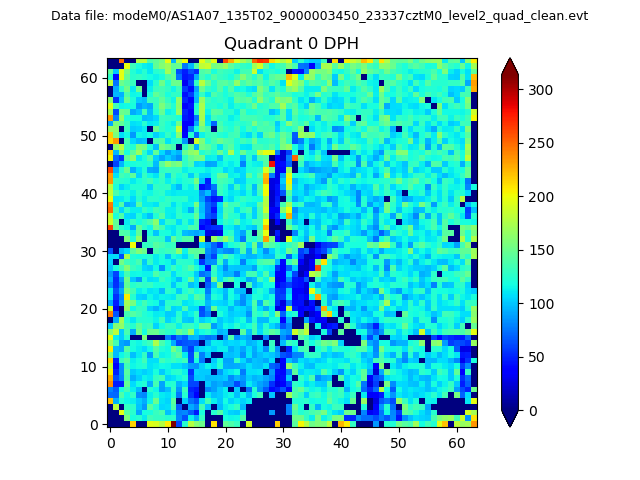 |
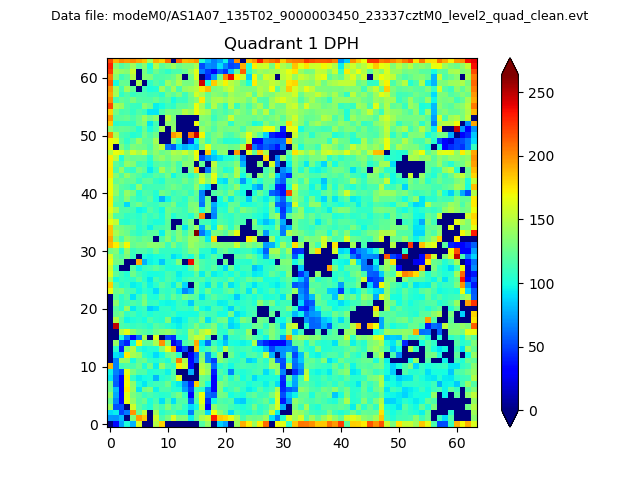 |
Quadrant B |
|---|---|---|---|
| Quadrant D | 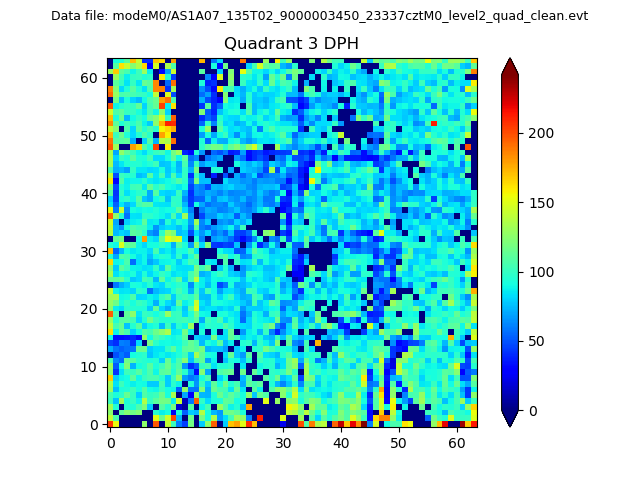 |
 |
Quadrant C |
| Plot type | Count rate plots | Images |
|---|---|---|
| Comparison with Poisson distribution Blue bars denote a histogram of data divided into 1 sec bins. Red curve is a Poisson curve with rate = median count rate of data. |
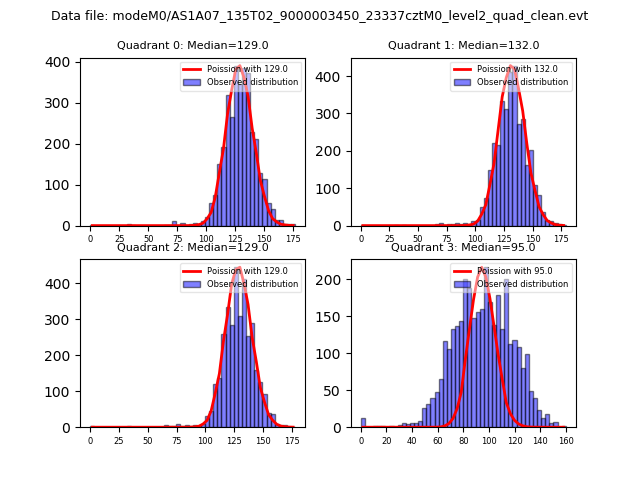 |
 |
| Quadrant-wise count rates Data is divided into 100 sec bins |
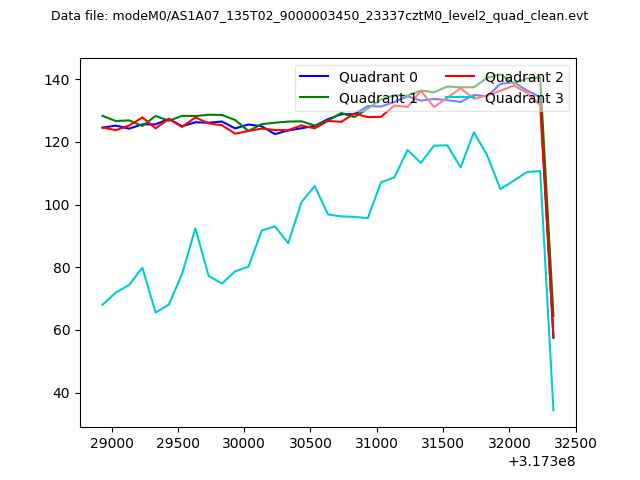 |
|
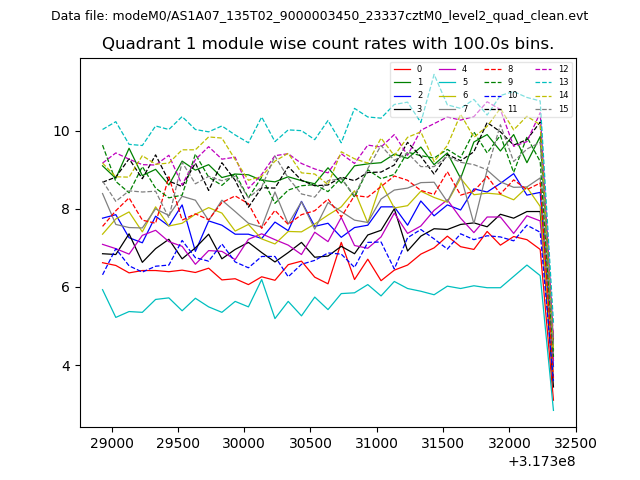
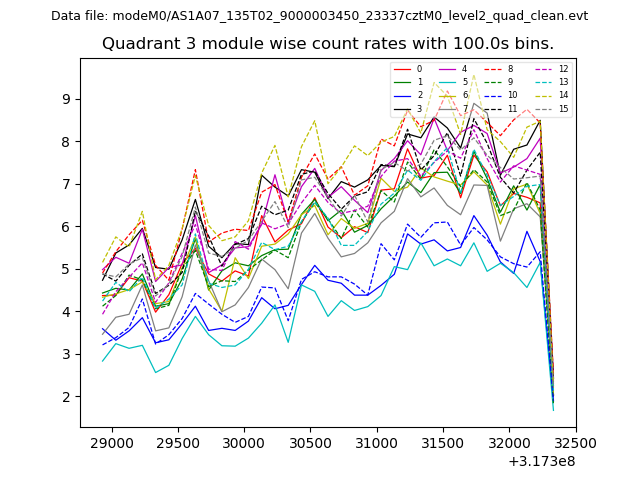
| Module-wise count rates for Quadrant A Data is divided into 100 sec bins |
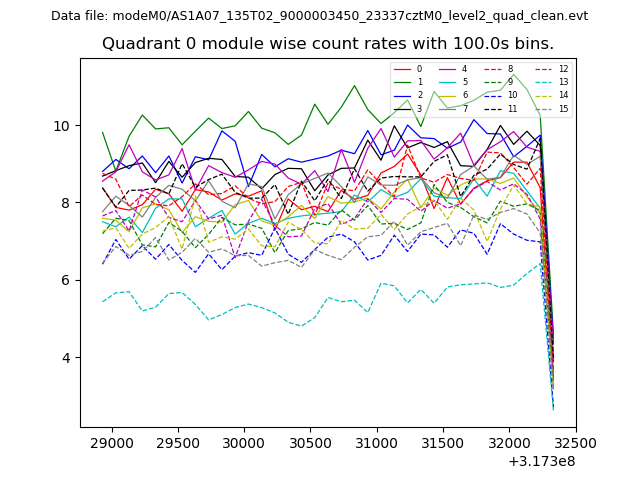 |
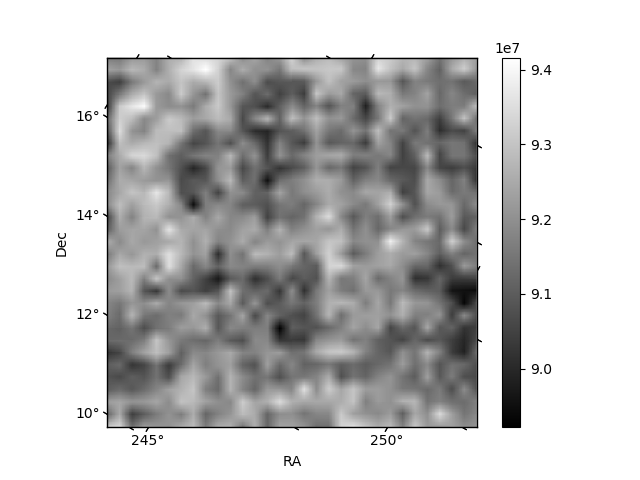 |
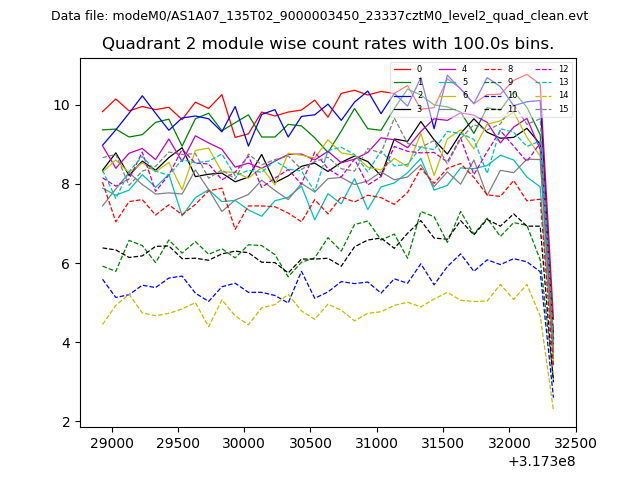
| Module-wise count rates for Quadrant B Data is divided into 100 sec bins |
 |
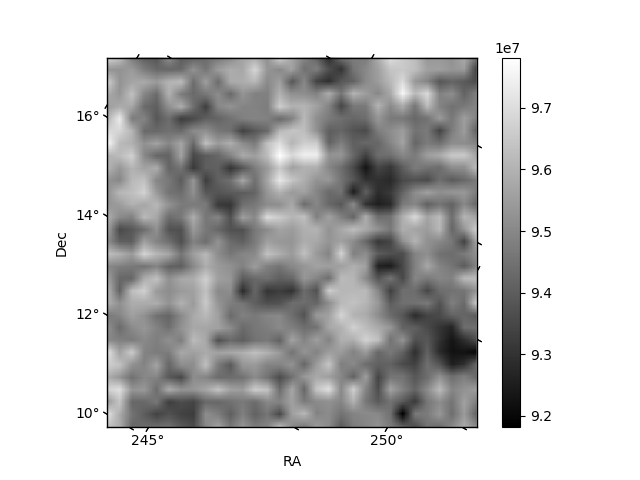 |
| Module-wise count rates for Quadrant C Data is divided into 100 sec bins |
 |
 |
| Module-wise count rates for Quadrant D Data is divided into 100 sec bins |
 |
 |
| Parameter | Plot |
|---|---|
| CZT HV Monitor | 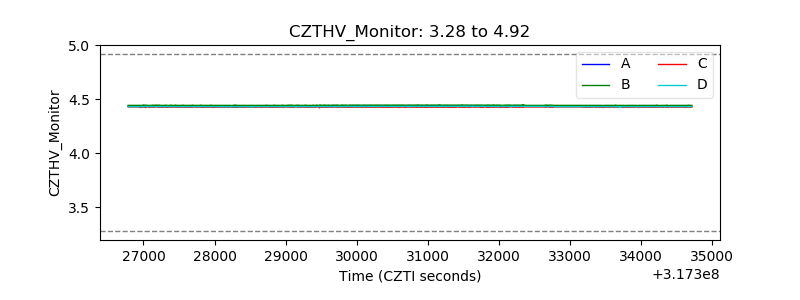 |
| D_VDD | 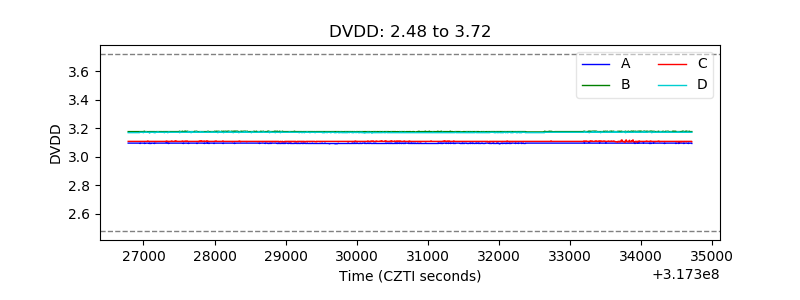 |
| Temperature 1 | 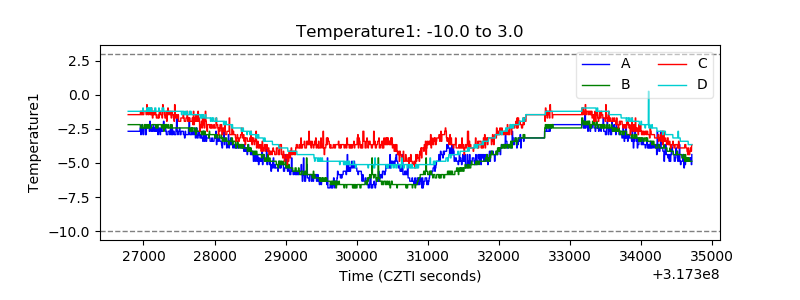 |
| Veto HV Monitor | 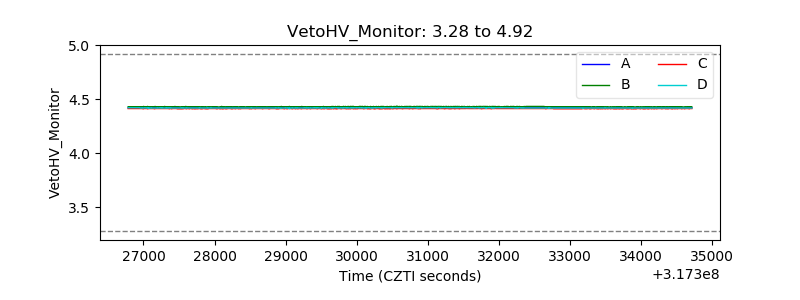 |
| Veto LLD | 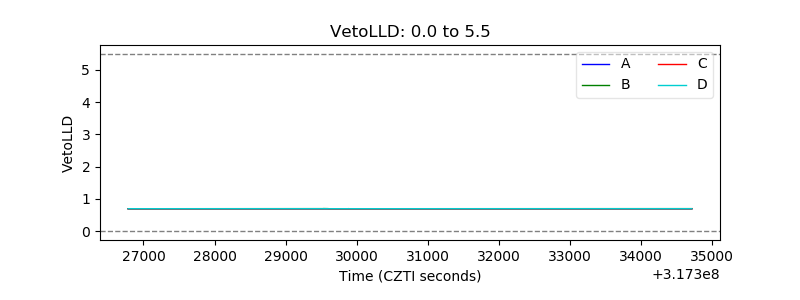 |
| Alpha Counter | 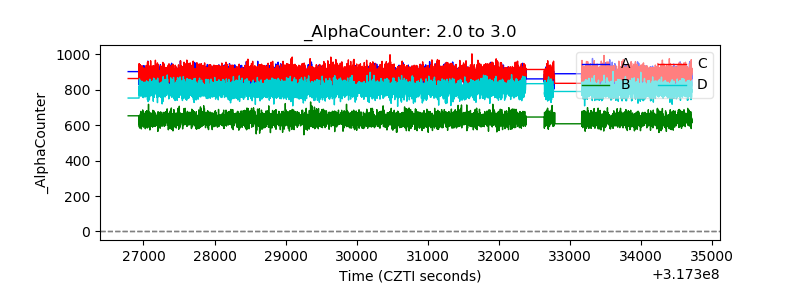 |
| _CPM_Rate | 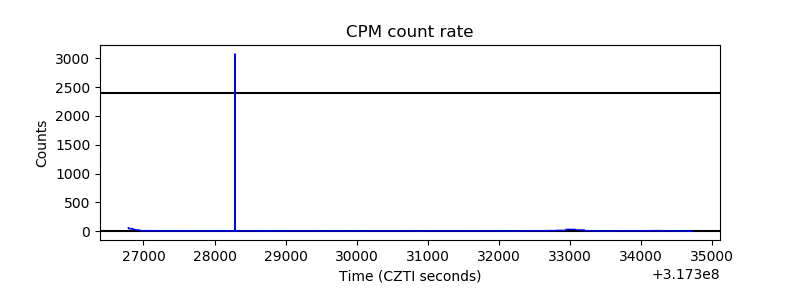 |
| CZT Counter | 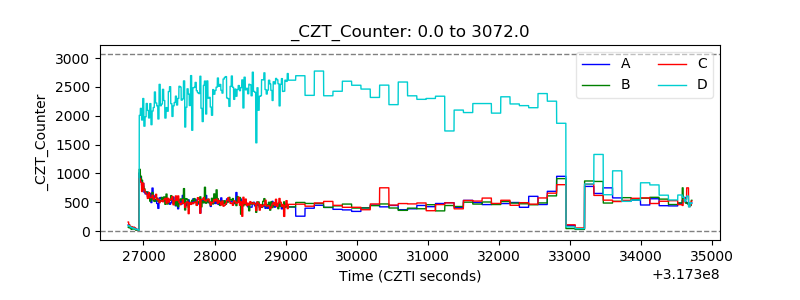 |
| +2.5 Volts monitor |  |
| +5 Volts monitor |  |
| _ROLL_ROT | 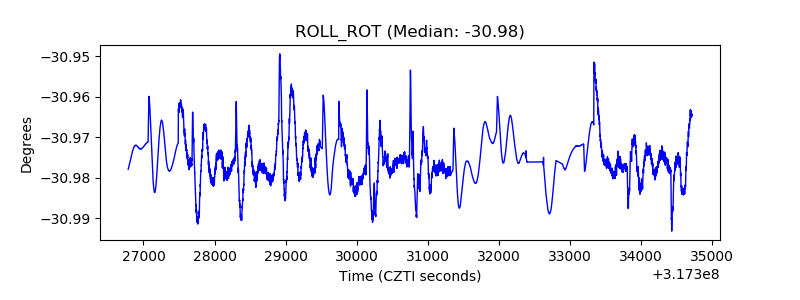 |
| _Roll_DEC | 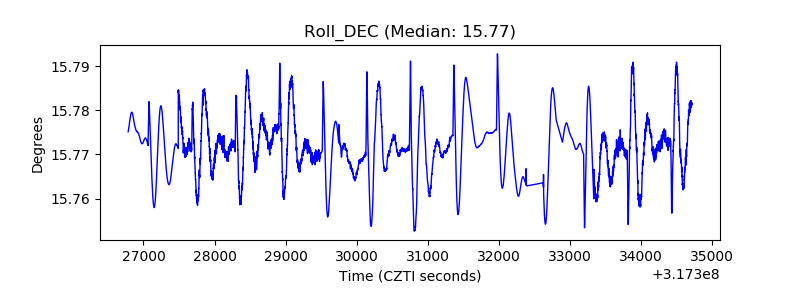 |
| _Roll_RA | 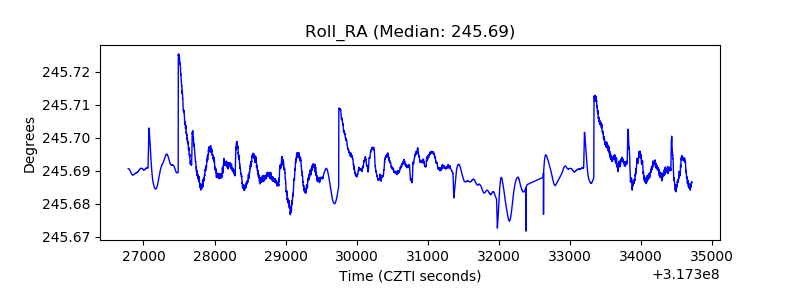 |
| Veto Counter | 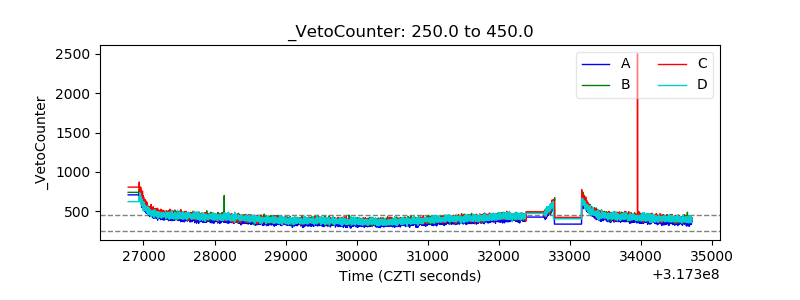 |