| Param | Original file | Final file |
|---|---|---|
| Filename | modeM0/AS1A07_135T02_9000003450_23338cztM0_level2.evt | modeM0/AS1A07_135T02_9000003450_23338cztM0_level2_quad_clean.evt |
| Size (bytes) | 511,649,280 | 83,741,760 |
| Size | 487.9 MB | 79.9 MB |
| Events in quadrant A | 3,491,655 | 508,248 |
| Events in quadrant B | 3,561,197 | 517,903 |
| Events in quadrant C | 3,672,585 | 507,733 |
| Events in quadrant D | 4,275,591 | 495,245 |
| Mode M9 | |||
|---|---|---|---|
| Quadrant | BADHDUFLAG | Total packets | Discarded packets |
| A | 0 | 2 | 0 |
| B | 0 | 2 | 0 |
| C | 0 | 2 | 0 |
| D | 0 | 2 | 0 |
| Mode M0 | |||
|---|---|---|---|
| Quadrant | BADHDUFLAG | Total packets | Discarded packets |
| A | 0 | 14990 | 1 |
| B | 0 | 15122 | 1 |
| C | 0 | 15275 | 1 |
| D | 0 | 17614 | 1 |
| Mode SS | |||
|---|---|---|---|
| Quadrant | BADHDUFLAG | Total packets | Discarded packets |
| A | 0 | 148 | 0 |
| B | 0 | 148 | 0 |
| C | 0 | 148 | 0 |
| D | 0 | 148 | 0 |
| Quadrant | Total seconds | Saturated seconds | Saturation percentage |
|---|---|---|---|
| A | 7276 | 71 | 0.975811% |
| B | 7277 | 98 | 1.346709% |
| C | 7277 | 152 | 2.088773% |
| D | 7277 | 225 | 3.091933% |
Noise dominated data is calculated using 1-second bins in cleaned event files. If a bin has >2000 counts, and if more than 50% of those come from <1% of pixels, then it is considered to be noise-dominated and hence unusable.
| Quadrant | # 1 sec bins | Bins with >0 counts | Bins with >2000 counts | High rate bins dominated by noise | Noise dominated (total time) | Noise dominated (detector-on time) | Marked lightcurve |
|---|---|---|---|---|---|---|---|
| A | 7536 | 7277 | 0 | 0 | 0.00% | 0.00% |  |
| B | 7537 | 7278 | 0 | 0 | 0.00% | 0.00% |  |
| C | 7537 | 7277 | 5 | 5 | 0.07% | 0.07% |  |
| D | 7537 | 7278 | 144 | 144 | 1.91% | 1.98% |  |
Top three noisy pixels from each quadrant. If the there are fewer than three noisy pixels in the level2.evt file, extra rows are filled as -1
| Pixel properties | Quadrant properties | ||||||
|---|---|---|---|---|---|---|---|
| Quadrant | DetID | PixID | Counts | Sigma | Mean | Median | Sigma |
| A | 13 | 254 | 11898 | 59.99 | 903 | 884 | 183.6 |
| A | 3 | 137 | 8108 | 39.35 | 903 | 884 | 183.6 |
| A | 0 | 226 | 7820 | 37.78 | 903 | 884 | 183.6 |
| B | 12 | 111 | 21109 | 116.96 | 896 | 872 | 173.0 |
| B | 11 | 111 | 18862 | 103.97 | 896 | 872 | 173.0 |
| B | 14 | 111 | 16317 | 89.26 | 896 | 872 | 173.0 |
| C | 14 | 238 | 136187 | 661.02 | 870 | 877 | 204.7 |
| C | 2 | 16 | 42598 | 203.82 | 870 | 877 | 204.7 |
| C | 10 | 9 | 40535 | 193.74 | 870 | 877 | 204.7 |
| D | 1 | 52 | 657890 | 3059.18 | 877 | 849 | 214.8 |
| D | 12 | 227 | 123274 | 570.01 | 877 | 849 | 214.8 |
| D | 7 | 238 | 57491 | 263.72 | 877 | 849 | 214.8 |
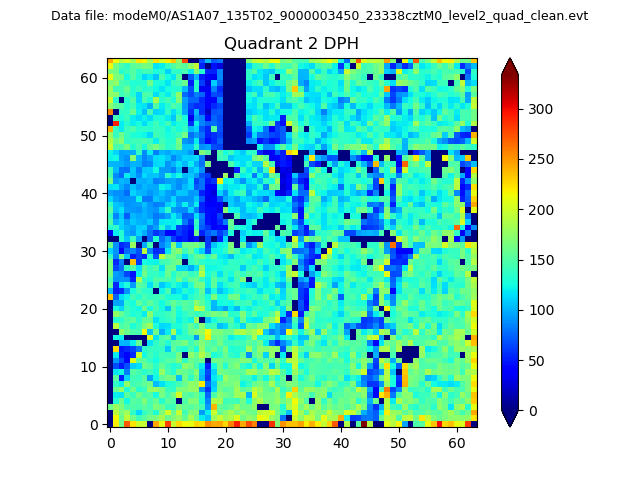
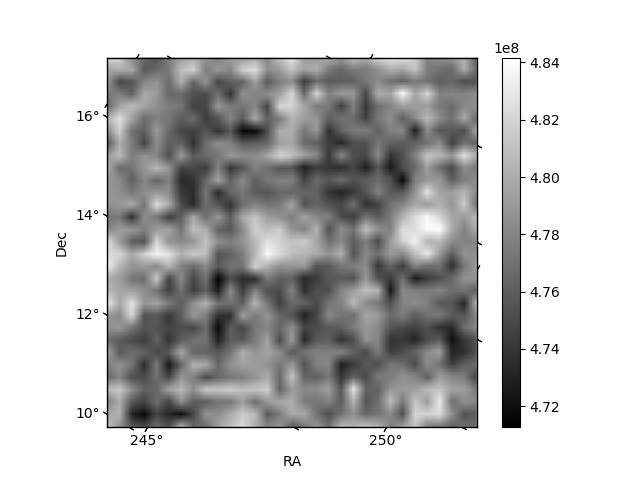
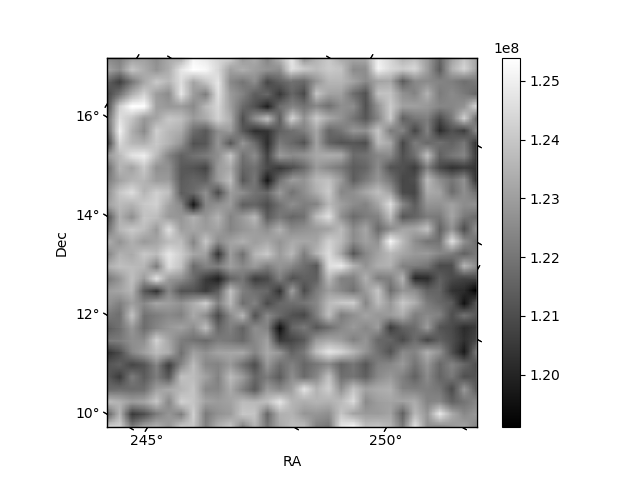
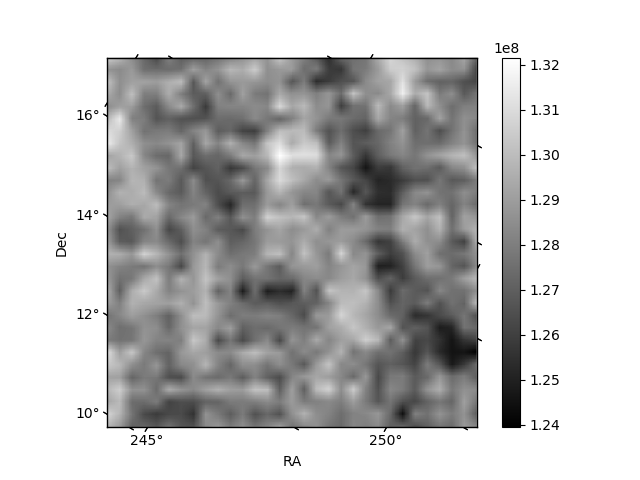
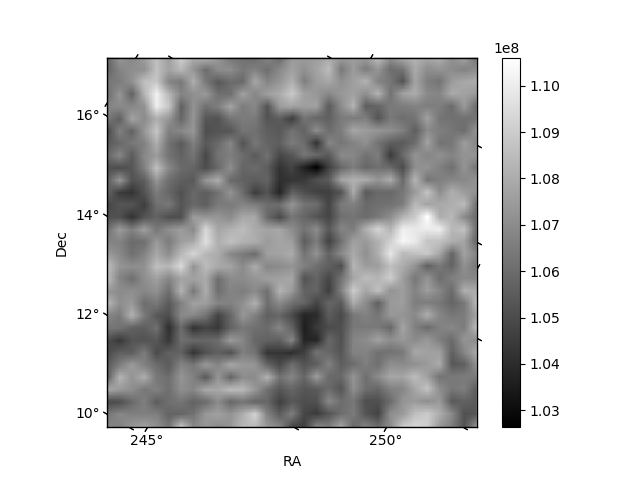
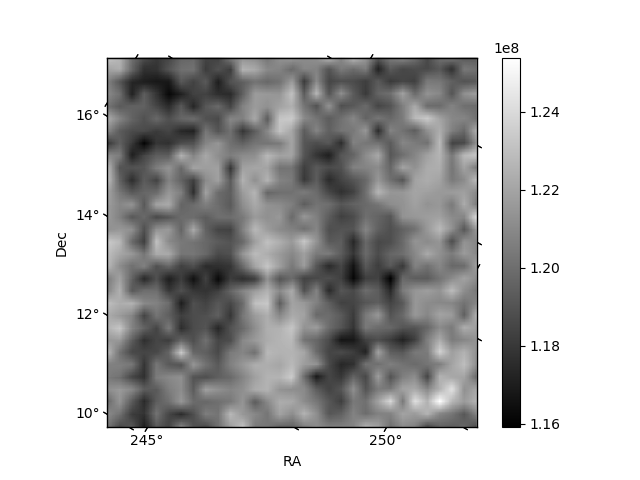
Histogram calculated using DETX and DETY for each event in the final _common_clean file
| Quadrant A | 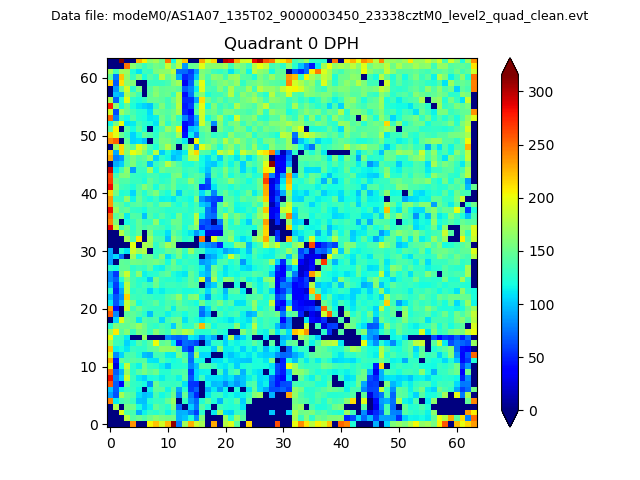 |
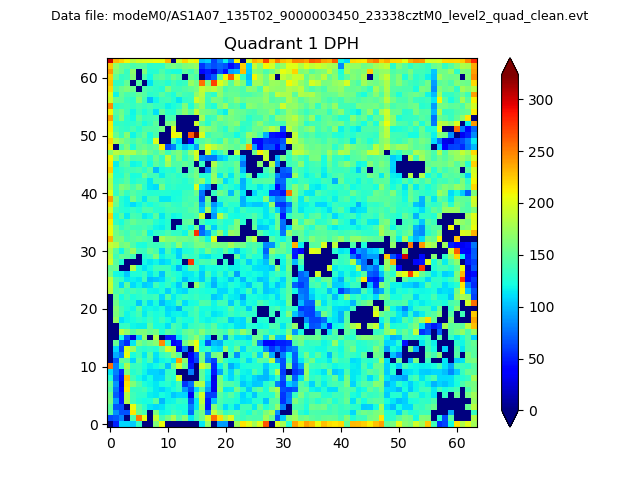 |
Quadrant B |
|---|---|---|---|
| Quadrant D | 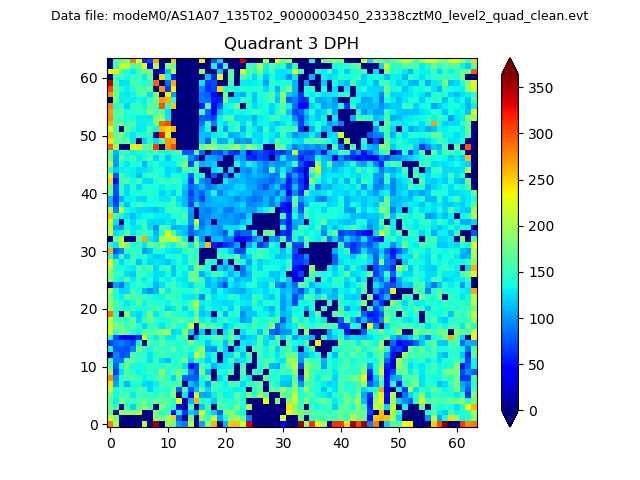 |
 |
Quadrant C |
| Plot type | Count rate plots | Images |
|---|---|---|
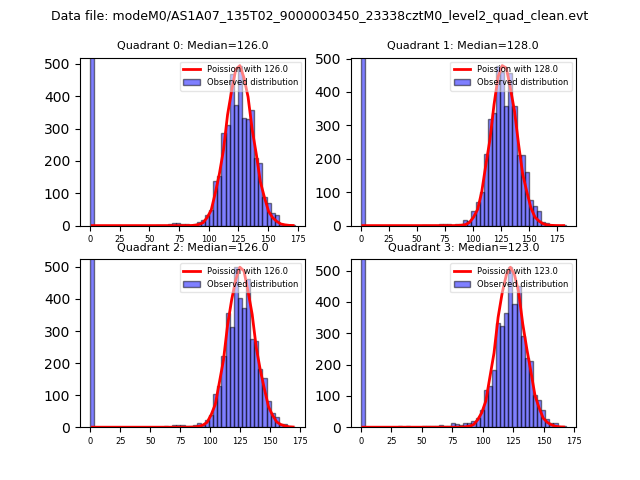
| Comparison with Poisson distribution Blue bars denote a histogram of data divided into 1 sec bins. Red curve is a Poisson curve with rate = median count rate of data. |
 |
 |
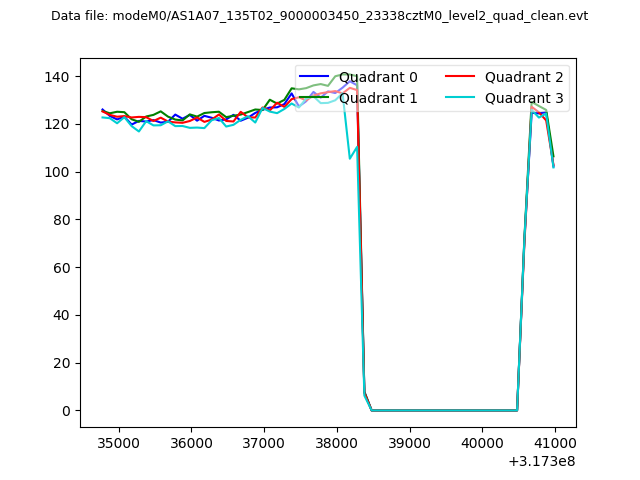
| Quadrant-wise count rates Data is divided into 100 sec bins |
 |
|
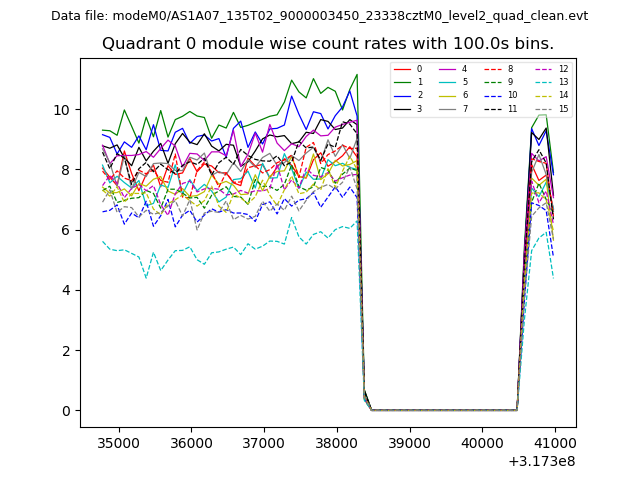
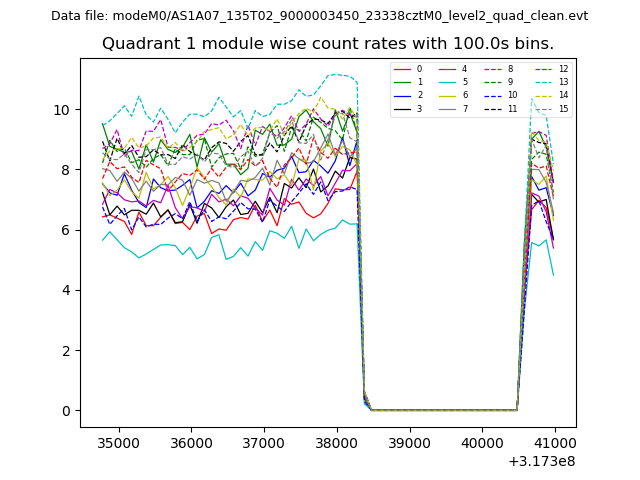
| Module-wise count rates for Quadrant A Data is divided into 100 sec bins |
 |
 |
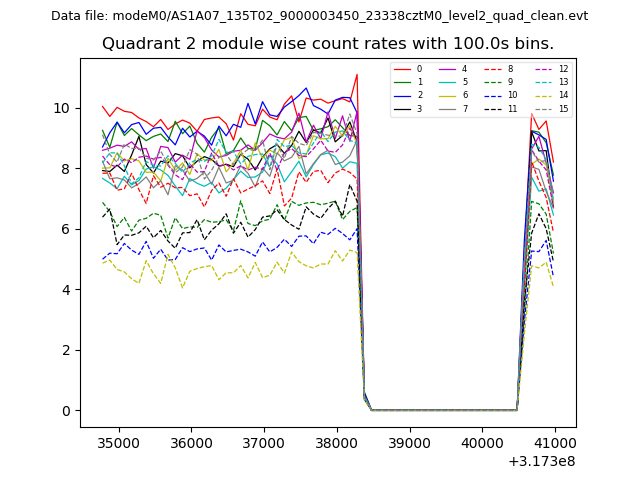
| Module-wise count rates for Quadrant B Data is divided into 100 sec bins |
 |
 |
| Module-wise count rates for Quadrant C Data is divided into 100 sec bins |
 |
 |
| Module-wise count rates for Quadrant D Data is divided into 100 sec bins |
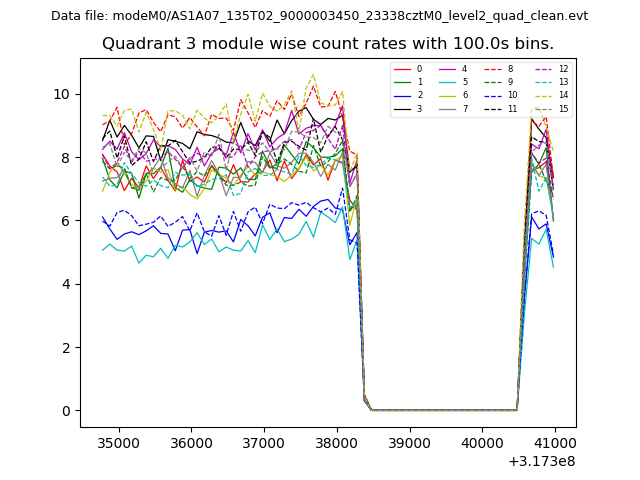 |
 |
| Parameter | Plot |
|---|---|
| CZT HV Monitor |  |
| D_VDD | 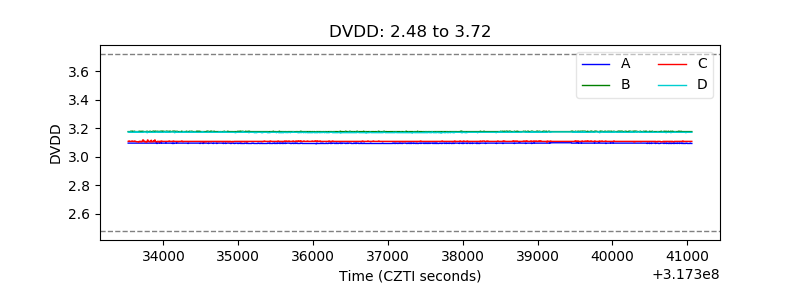 |
| Temperature 1 | 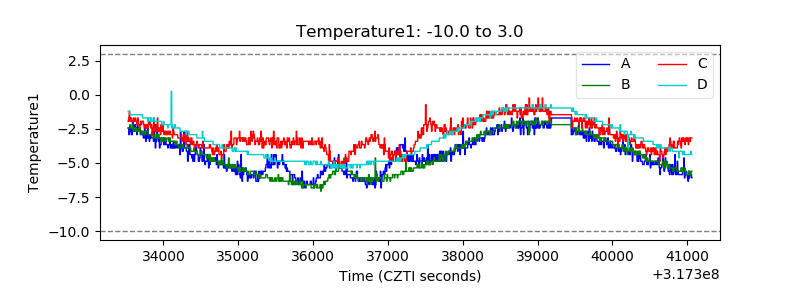 |
| Veto HV Monitor | 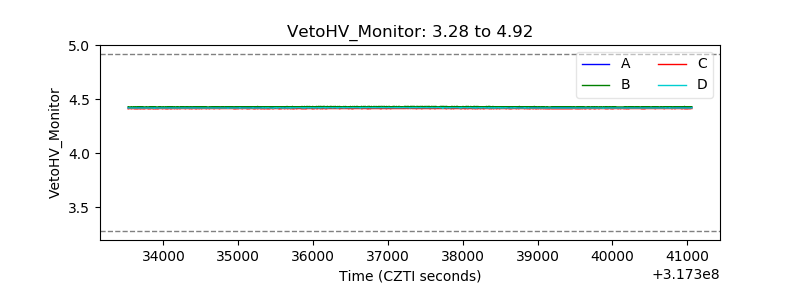 |
| Veto LLD | 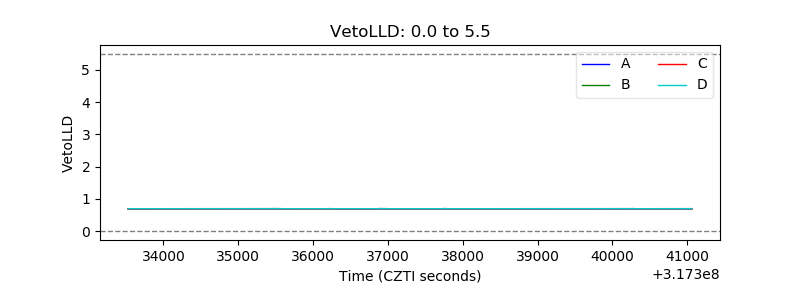 |
| Alpha Counter | 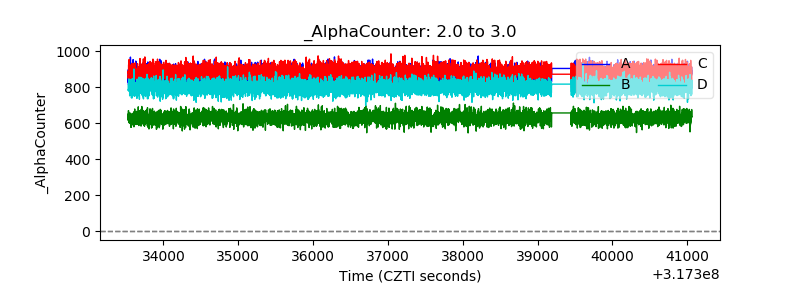 |
| _CPM_Rate | 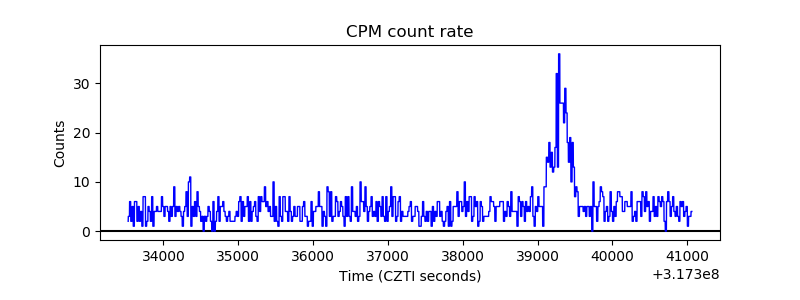 |
| CZT Counter | 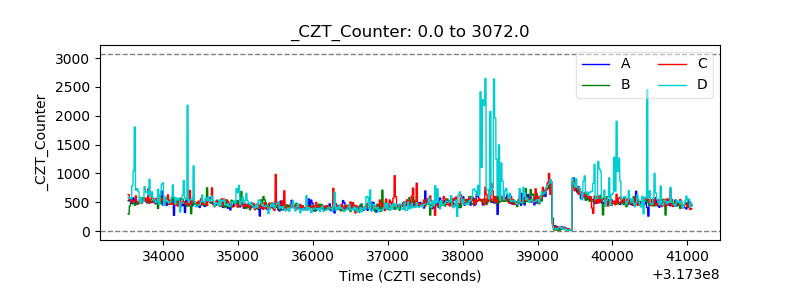 |
| +2.5 Volts monitor |  |
| +5 Volts monitor |  |
| _ROLL_ROT | 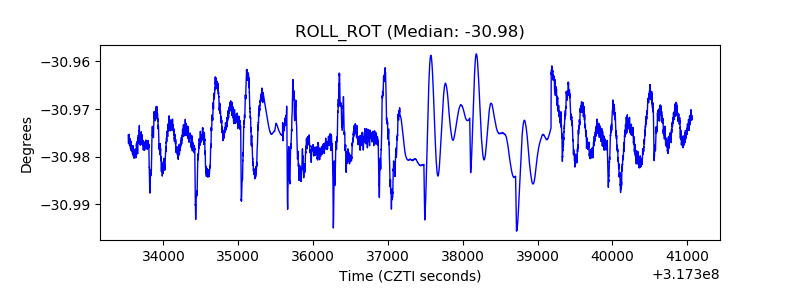 |
| _Roll_DEC | 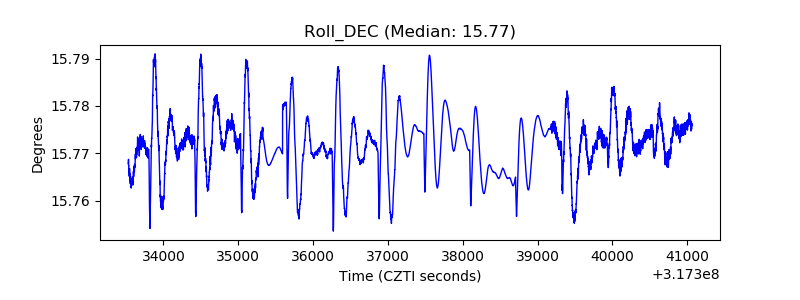 |
| _Roll_RA | 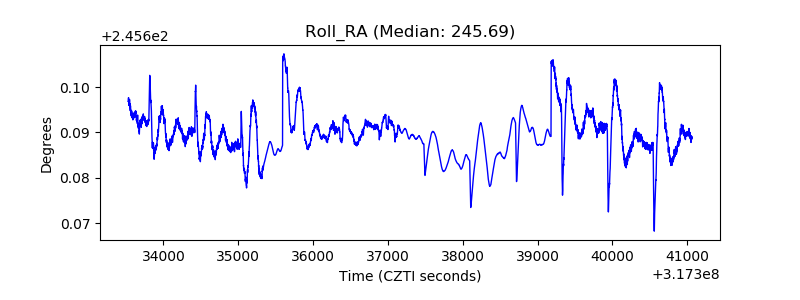 |
| Veto Counter | 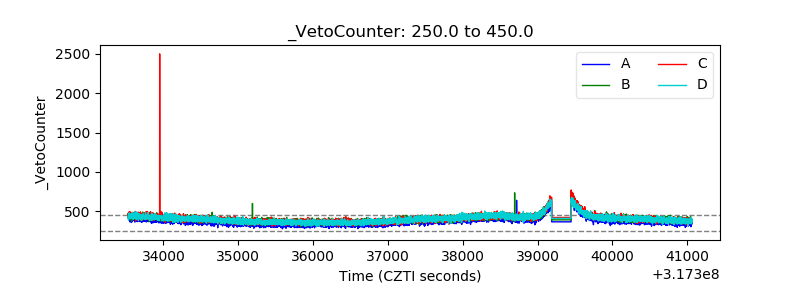 |