| Param | Original file | Final file |
|---|---|---|
| Filename | modeM0/AS1A07_135T02_9000003450_23339cztM0_level2.evt | modeM0/AS1A07_135T02_9000003450_23339cztM0_level2_quad_clean.evt |
| Size (bytes) | 317,001,600 | 58,933,440 |
| Size | 302.3 MB | 56.2 MB |
| Events in quadrant A | 2,235,968 | 366,323 |
| Events in quadrant B | 2,288,323 | 371,432 |
| Events in quadrant C | 2,345,359 | 364,983 |
| Events in quadrant D | 2,410,980 | 352,642 |
| Mode M9 | |||
|---|---|---|---|
| Quadrant | BADHDUFLAG | Total packets | Discarded packets |
| A | 0 | 5 | 0 |
| B | 0 | 5 | 0 |
| C | 0 | 5 | 0 |
| D | 0 | 5 | 0 |
| Mode M0 | |||
|---|---|---|---|
| Quadrant | BADHDUFLAG | Total packets | Discarded packets |
| A | 0 | 12143 | 2539 |
| B | 0 | 12300 | 2569 |
| C | 0 | 12451 | 2683 |
| D | 0 | 12904 | 2731 |
| Mode SS | |||
|---|---|---|---|
| Quadrant | BADHDUFLAG | Total packets | Discarded packets |
| A | 0 | 121 | 23 |
| B | 0 | 121 | 23 |
| C | 0 | 121 | 23 |
| D | 0 | 122 | 20 |
| Quadrant | Total seconds | Saturated seconds | Saturation percentage |
|---|---|---|---|
| A | 4678 | 16 | 0.342027% |
| B | 4663 | 25 | 0.536136% |
| C | 4685 | 59 | 1.259338% |
| D | 4638 | 25 | 0.539025% |
Noise dominated data is calculated using 1-second bins in cleaned event files. If a bin has >2000 counts, and if more than 50% of those come from <1% of pixels, then it is considered to be noise-dominated and hence unusable.
| Quadrant | # 1 sec bins | Bins with >0 counts | Bins with >2000 counts | High rate bins dominated by noise | Noise dominated (total time) | Noise dominated (detector-on time) | Marked lightcurve |
|---|---|---|---|---|---|---|---|
| A | 5990 | 4981 | 0 | 0 | 0.00% | 0.00% | 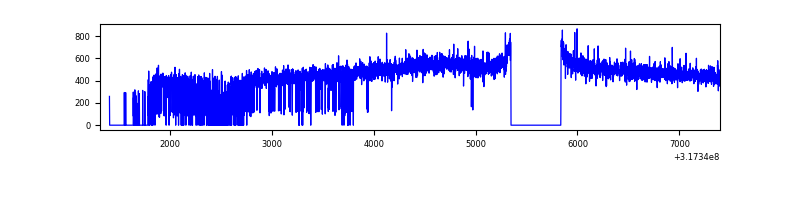 |
| B | 5959 | 4961 | 2 | 2 | 0.03% | 0.04% | 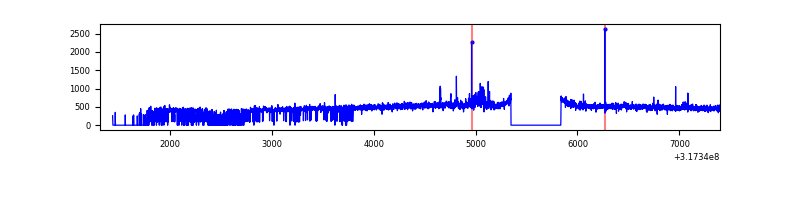 |
| C | 5988 | 4985 | 0 | 0 | 0.00% | 0.00% | 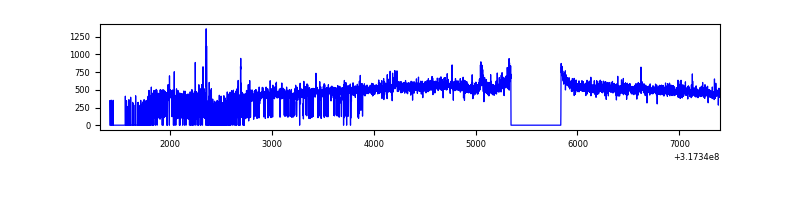 |
| D | 6083 | 4927 | 13 | 13 | 0.21% | 0.26% | 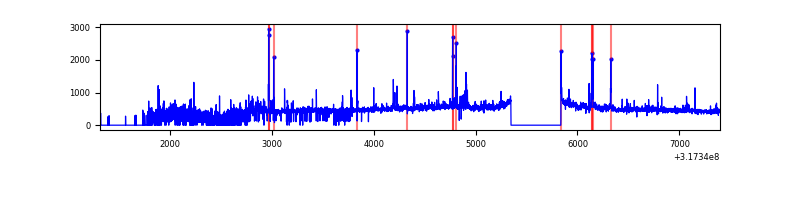 |
Top three noisy pixels from each quadrant. If the there are fewer than three noisy pixels in the level2.evt file, extra rows are filled as -1
| Pixel properties | Quadrant properties | ||||||
|---|---|---|---|---|---|---|---|
| Quadrant | DetID | PixID | Counts | Sigma | Mean | Median | Sigma |
| A | 13 | 254 | 6589 | 50.89 | 579 | 566 | 118.4 |
| A | 3 | 137 | 5228 | 39.39 | 579 | 566 | 118.4 |
| A | 0 | 226 | 4939 | 36.95 | 579 | 566 | 118.4 |
| B | 0 | 190 | 34254 | 301.09 | 572 | 557 | 111.9 |
| B | 12 | 111 | 13642 | 116.92 | 572 | 557 | 111.9 |
| B | 11 | 111 | 12122 | 103.34 | 572 | 557 | 111.9 |
| C | 14 | 238 | 88247 | 665.66 | 559 | 562 | 131.7 |
| C | 10 | 9 | 32751 | 244.36 | 559 | 562 | 131.7 |
| C | 3 | 233 | 24377 | 180.79 | 559 | 562 | 131.7 |
| D | 1 | 52 | 140644 | 1007.57 | 561 | 545 | 139.0 |
| D | 12 | 227 | 79764 | 569.73 | 561 | 545 | 139.0 |
| D | 12 | 233 | 27109 | 191.04 | 561 | 545 | 139.0 |
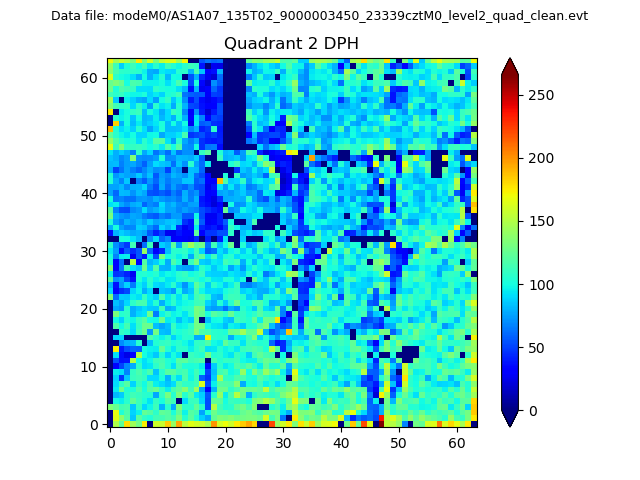
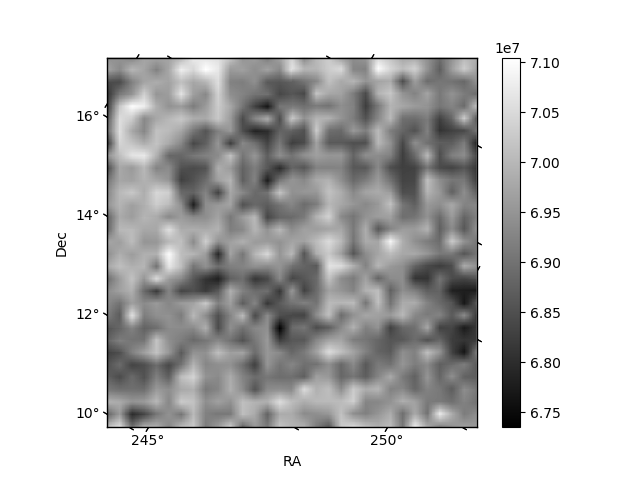
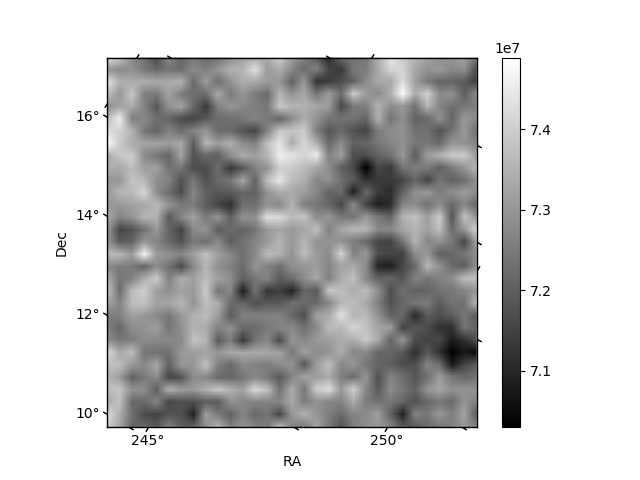
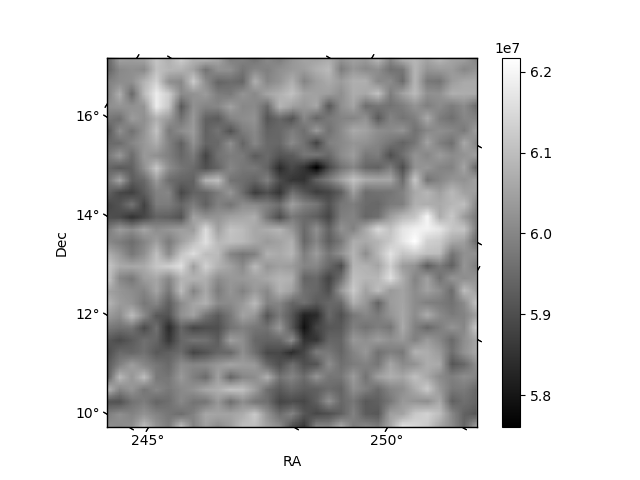
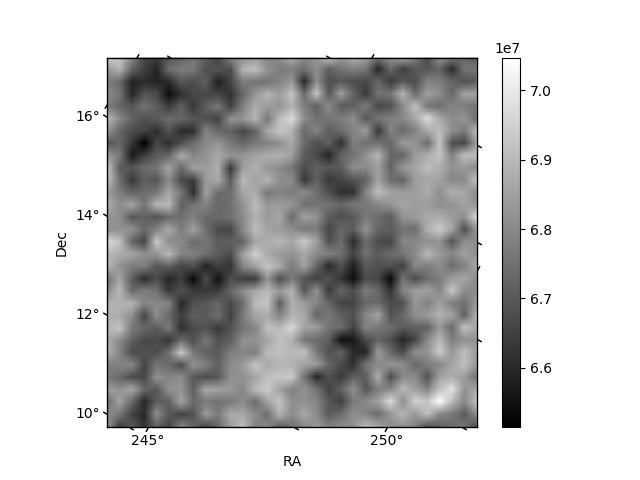
Histogram calculated using DETX and DETY for each event in the final _common_clean file
| Quadrant A | 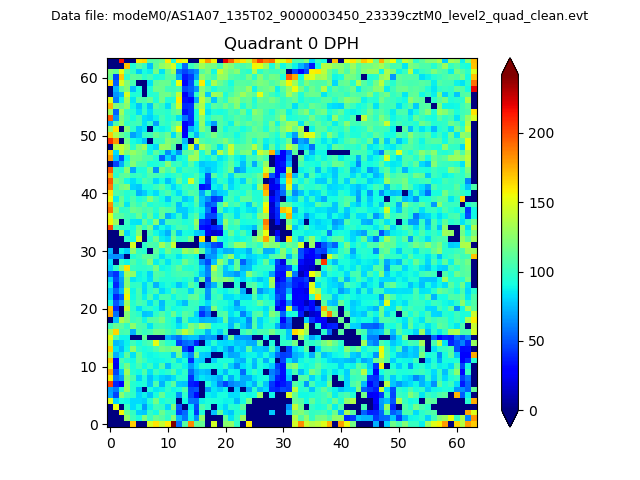 |
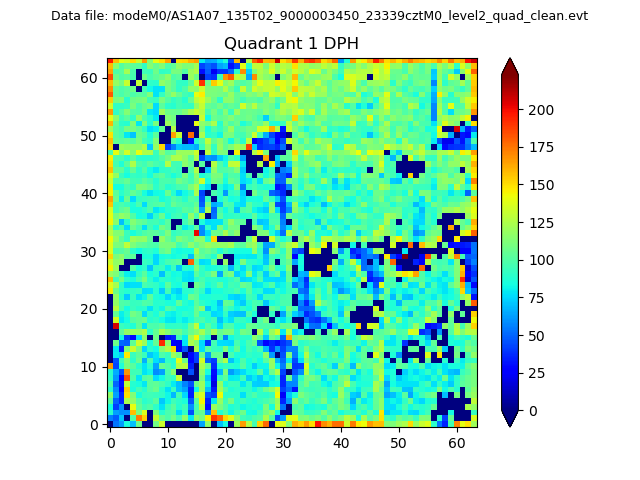 |
Quadrant B |
|---|---|---|---|
| Quadrant D | 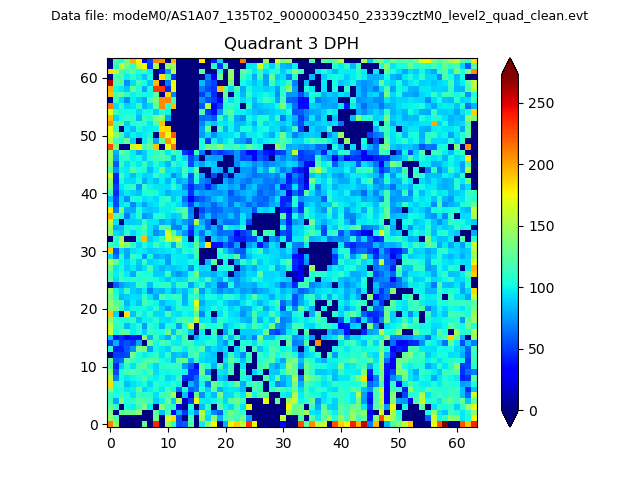 |
 |
Quadrant C |
| Plot type | Count rate plots | Images |
|---|---|---|
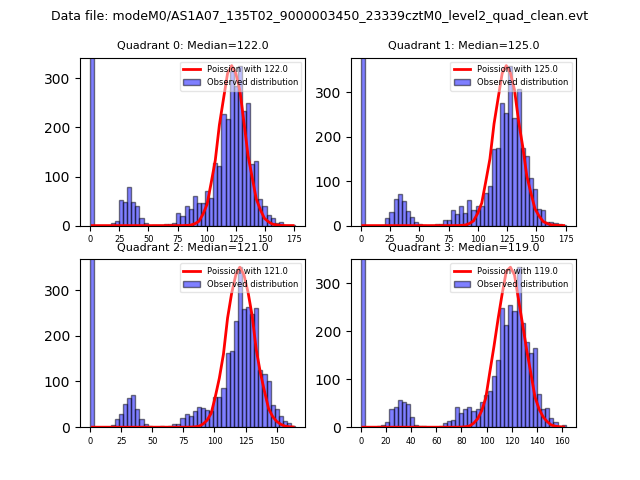
| Comparison with Poisson distribution Blue bars denote a histogram of data divided into 1 sec bins. Red curve is a Poisson curve with rate = median count rate of data. |
 |
 |
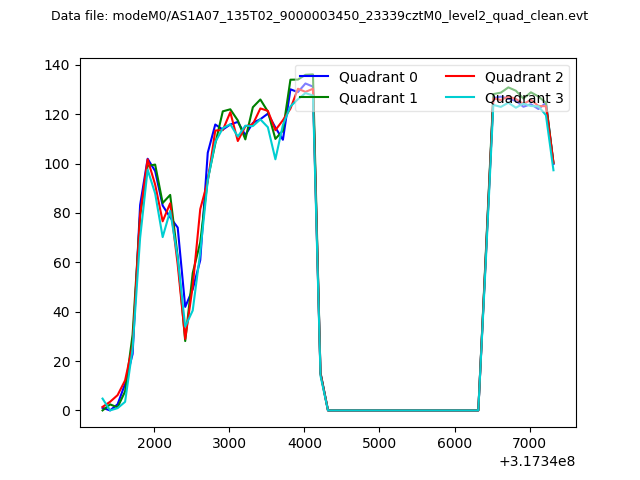
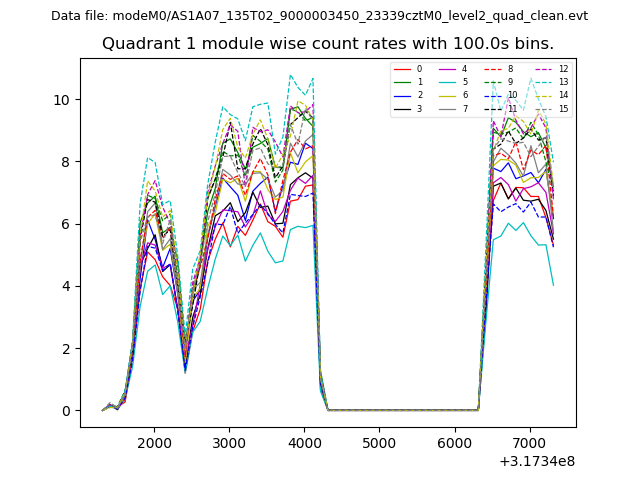
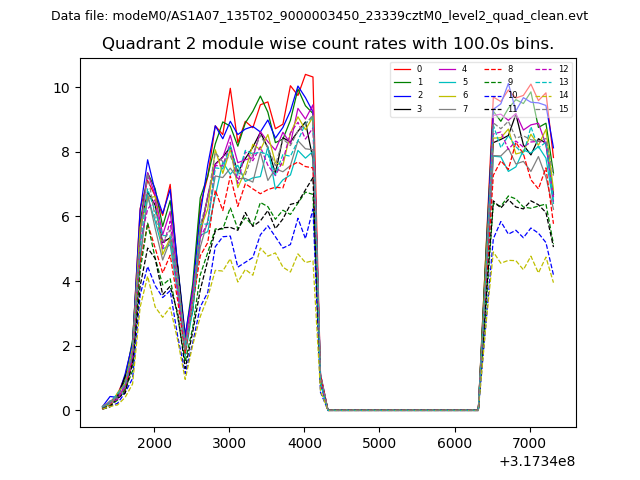
| Quadrant-wise count rates Data is divided into 100 sec bins |
 |
|
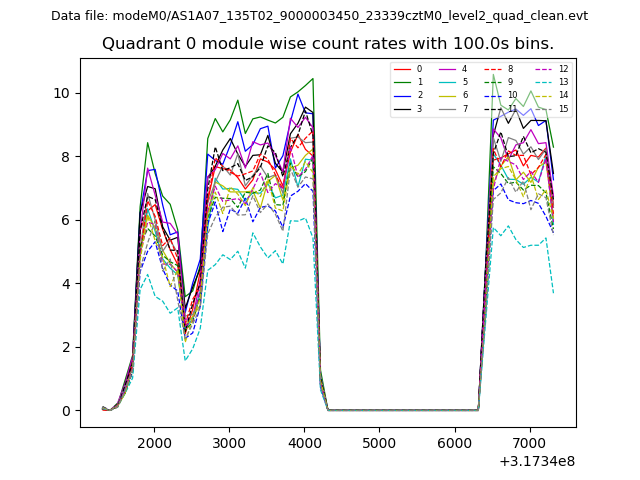
| Module-wise count rates for Quadrant A Data is divided into 100 sec bins |
 |
 |
| Module-wise count rates for Quadrant B Data is divided into 100 sec bins |
 |
 |
| Module-wise count rates for Quadrant C Data is divided into 100 sec bins |
 |
 |
| Module-wise count rates for Quadrant D Data is divided into 100 sec bins |
 |
 |
| Parameter | Plot |
|---|---|
| CZT HV Monitor | 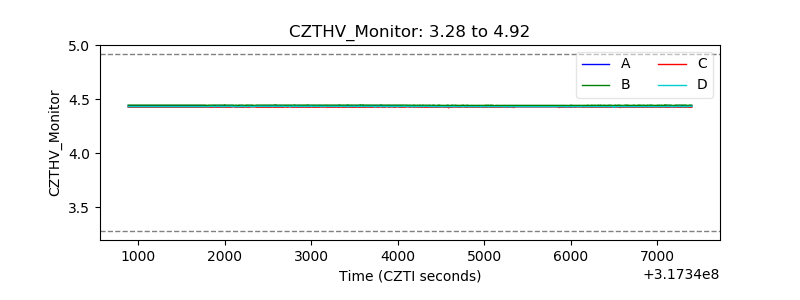 |
| D_VDD |  |
| Temperature 1 | 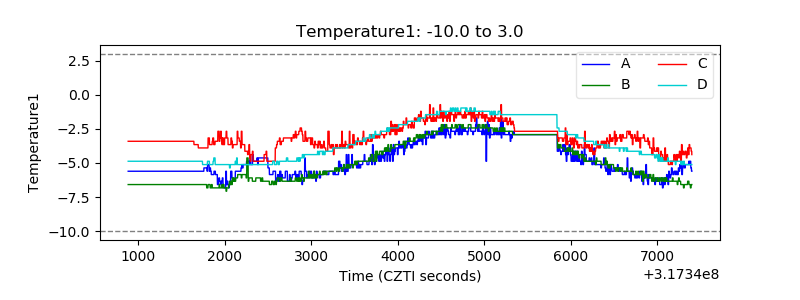 |
| Veto HV Monitor | 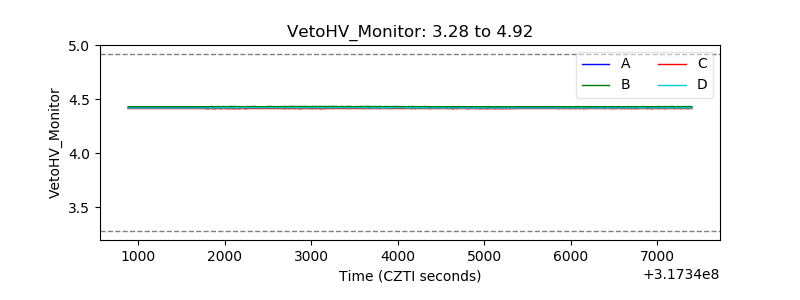 |
| Veto LLD | 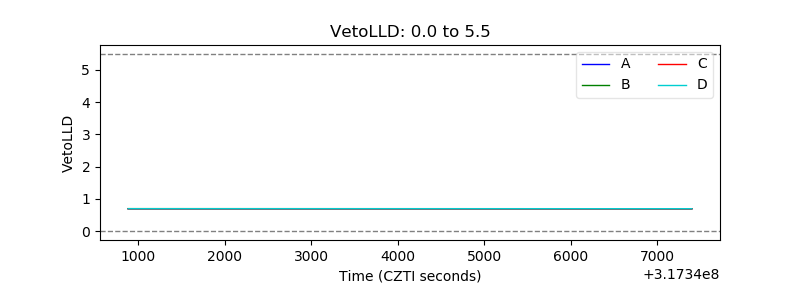 |
| Alpha Counter | 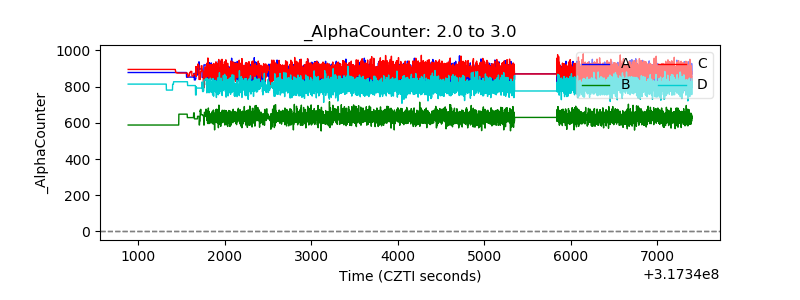 |
| _CPM_Rate | 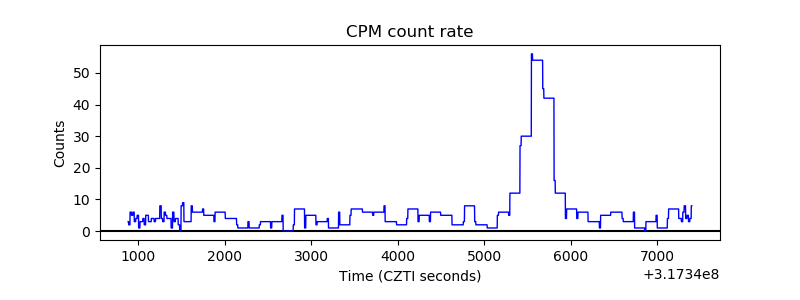 |
| CZT Counter | 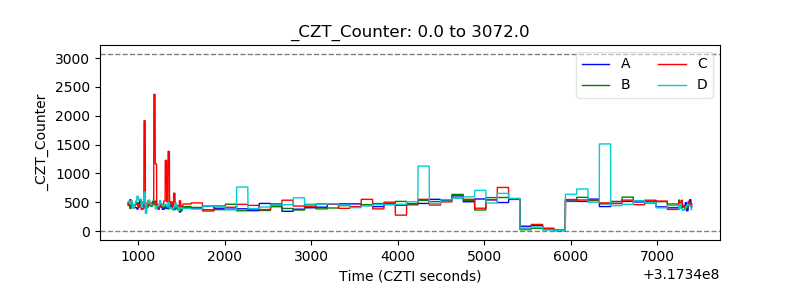 |
| +2.5 Volts monitor |  |
| +5 Volts monitor |  |
| _ROLL_ROT | 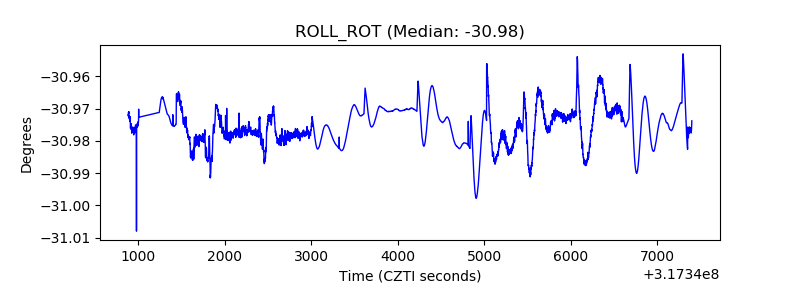 |
| _Roll_DEC | 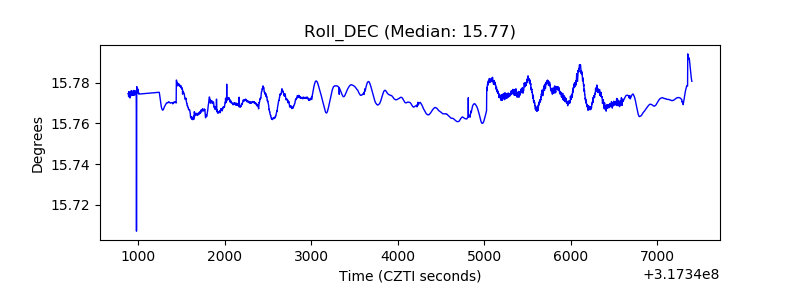 |
| _Roll_RA | 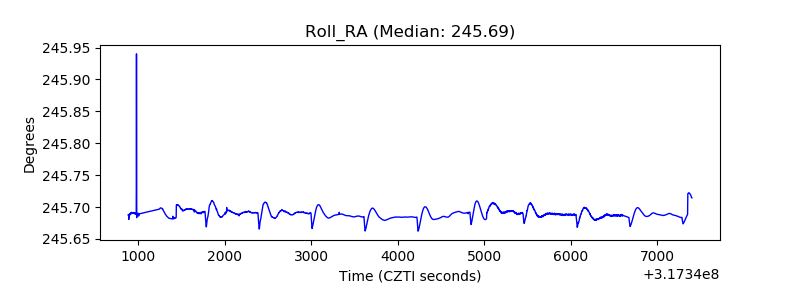 |
| Veto Counter | 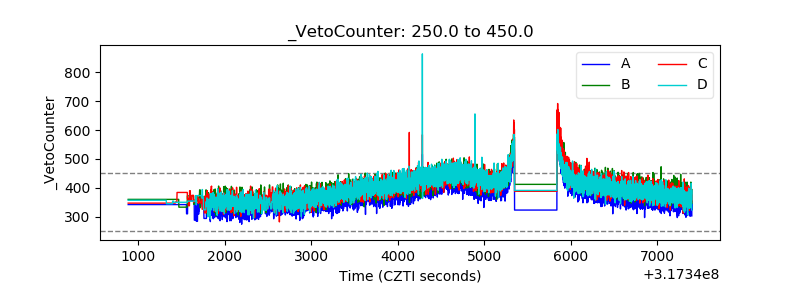 |