| Param | Original file | Final file |
|---|---|---|
| Filename | modeM0/AS1A07_135T02_9000003450_23342cztM0_level2.evt | modeM0/AS1A07_135T02_9000003450_23342cztM0_level2_quad_clean.evt |
| Size (bytes) | 1,228,305,600 | 237,355,200 |
| Size | 1.1 GB | 226.4 MB |
| Events in quadrant A | 8,304,465 | 1,498,650 |
| Events in quadrant B | 8,505,866 | 1,530,193 |
| Events in quadrant C | 8,654,576 | 1,485,819 |
| Events in quadrant D | 10,529,419 | 1,446,350 |
| Mode M9 | |||
|---|---|---|---|
| Quadrant | BADHDUFLAG | Total packets | Discarded packets |
| A | 0 | 23 | 0 |
| B | 0 | 23 | 0 |
| C | 0 | 23 | 0 |
| D | 0 | 23 | 0 |
| Mode M0 | |||
|---|---|---|---|
| Quadrant | BADHDUFLAG | Total packets | Discarded packets |
| A | 0 | 36444 | 3 |
| B | 0 | 36900 | 3 |
| C | 0 | 36842 | 3 |
| D | 0 | 43857 | 3 |
| Mode SS | |||
|---|---|---|---|
| Quadrant | BADHDUFLAG | Total packets | Discarded packets |
| A | 0 | 364 | 0 |
| B | 0 | 364 | 0 |
| C | 0 | 364 | 0 |
| D | 0 | 364 | 0 |
| Quadrant | Total seconds | Saturated seconds | Saturation percentage |
|---|---|---|---|
| A | 17812 | 70 | 0.392993% |
| B | 17813 | 110 | 0.617527% |
| C | 17813 | 186 | 1.044181% |
| D | 17813 | 464 | 2.604839% |
Noise dominated data is calculated using 1-second bins in cleaned event files. If a bin has >2000 counts, and if more than 50% of those come from <1% of pixels, then it is considered to be noise-dominated and hence unusable.
| Quadrant | # 1 sec bins | Bins with >0 counts | Bins with >2000 counts | High rate bins dominated by noise | Noise dominated (total time) | Noise dominated (detector-on time) | Marked lightcurve |
|---|---|---|---|---|---|---|---|
| A | 20172 | 17814 | 0 | 0 | 0.00% | 0.00% | 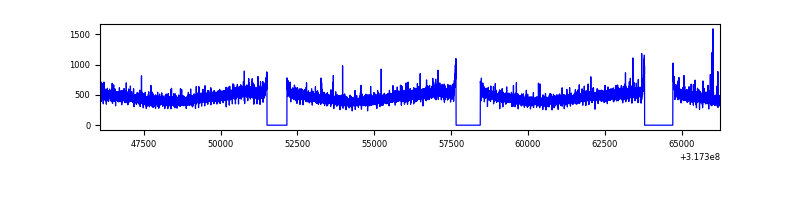 |
| B | 20173 | 17816 | 6 | 6 | 0.03% | 0.03% | 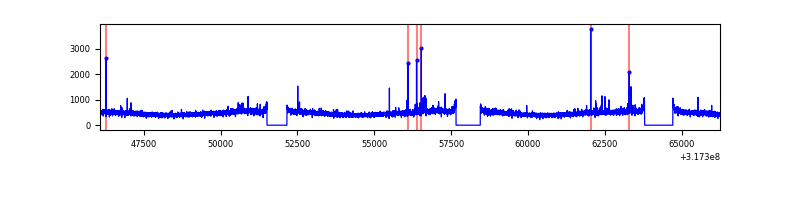 |
| C | 20173 | 17814 | 1 | 1 | 0.00% | 0.01% | 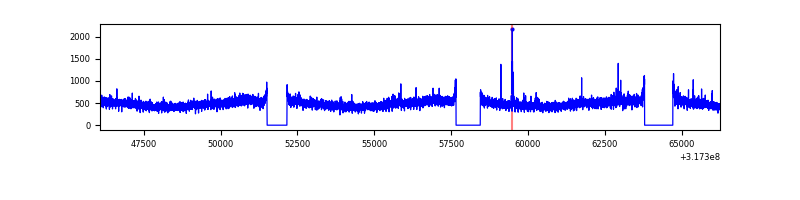 |
| D | 20173 | 17816 | 384 | 384 | 1.90% | 2.16% | 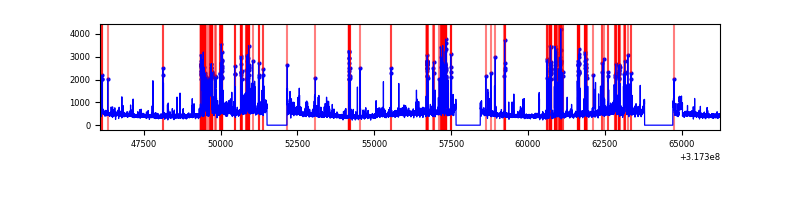 |
Top three noisy pixels from each quadrant. If the there are fewer than three noisy pixels in the level2.evt file, extra rows are filled as -1
| Pixel properties | Quadrant properties | ||||||
|---|---|---|---|---|---|---|---|
| Quadrant | DetID | PixID | Counts | Sigma | Mean | Median | Sigma |
| A | 6 | 16 | 25608 | 54.44 | 2148 | 2098 | 431.9 |
| A | 13 | 254 | 25011 | 53.05 | 2148 | 2098 | 431.9 |
| A | 3 | 137 | 19369 | 39.99 | 2148 | 2098 | 431.9 |
| B | 0 | 190 | 63943 | 152.65 | 2137 | 2084 | 405.2 |
| B | 12 | 111 | 50725 | 120.03 | 2137 | 2084 | 405.2 |
| B | 11 | 111 | 45549 | 107.26 | 2137 | 2084 | 405.2 |
| C | 14 | 238 | 326280 | 672.41 | 2065 | 2081 | 482.1 |
| C | 10 | 9 | 198599 | 407.59 | 2065 | 2081 | 482.1 |
| C | 7 | 247 | 44792 | 88.59 | 2065 | 2081 | 482.1 |
| D | 1 | 52 | 1878879 | 3766.37 | 2070 | 2015 | 498.3 |
| D | 2 | 152 | 288115 | 574.13 | 2070 | 2015 | 498.3 |
| D | 12 | 233 | 160072 | 317.18 | 2070 | 2015 | 498.3 |
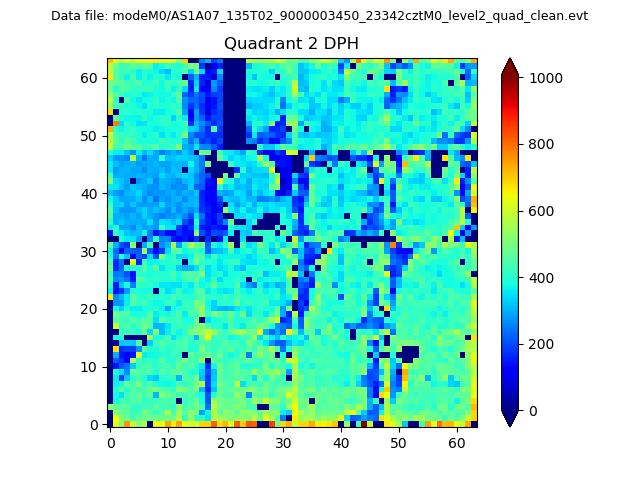
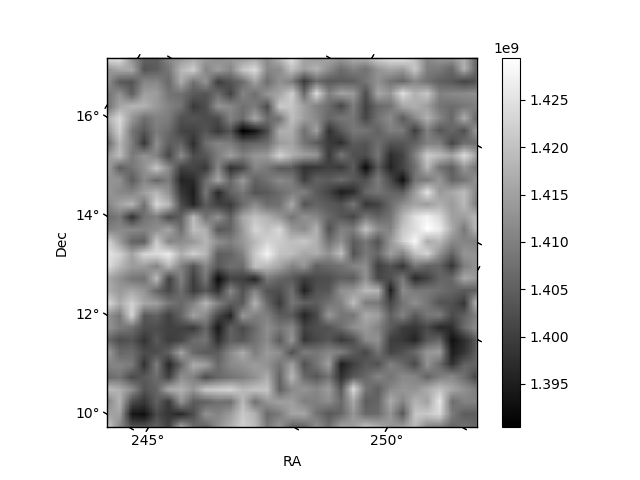
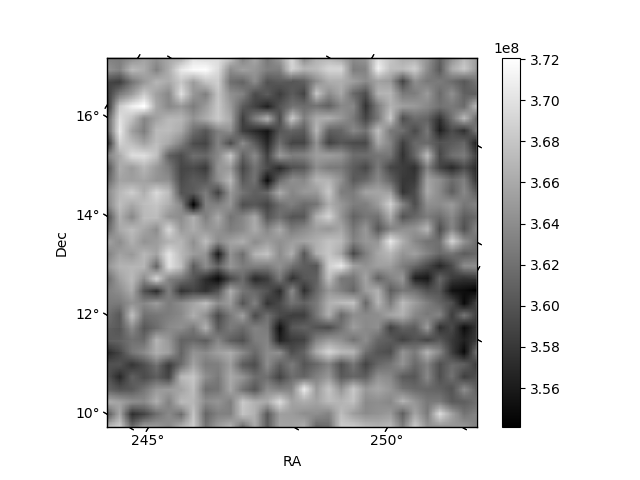
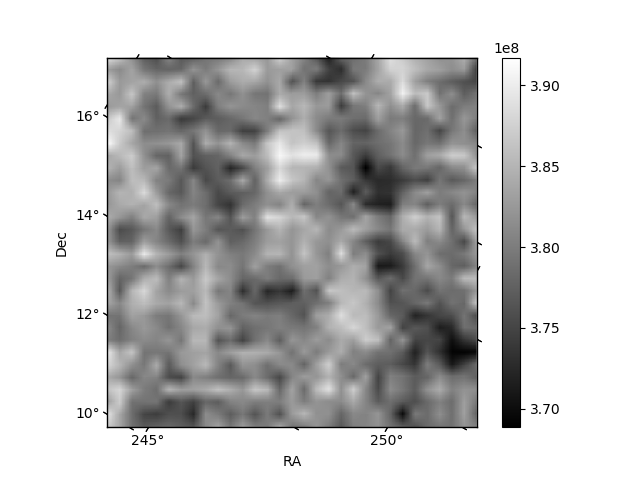
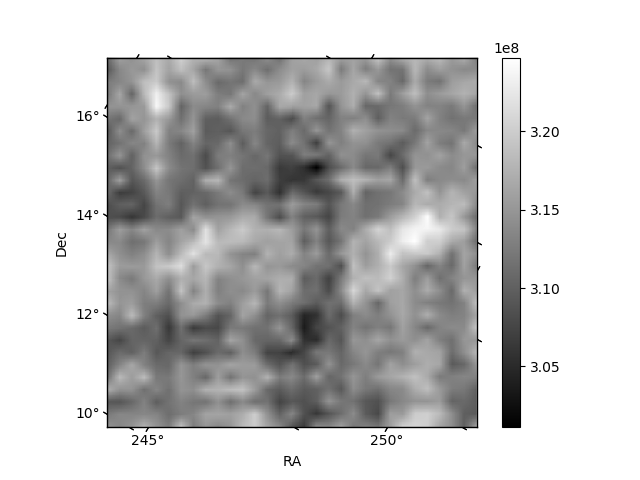
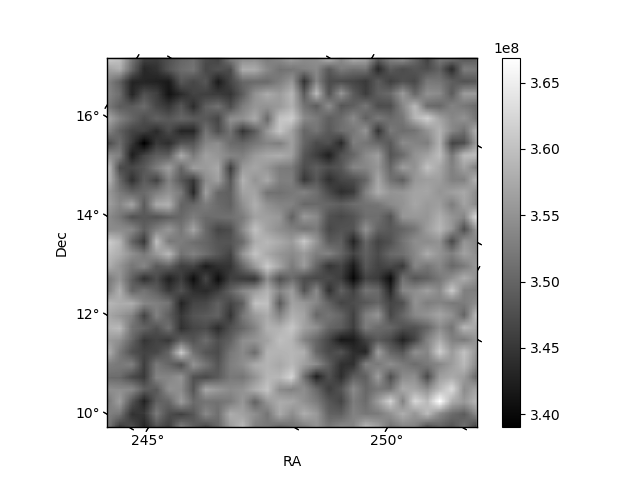
Histogram calculated using DETX and DETY for each event in the final _common_clean file
| Quadrant A | 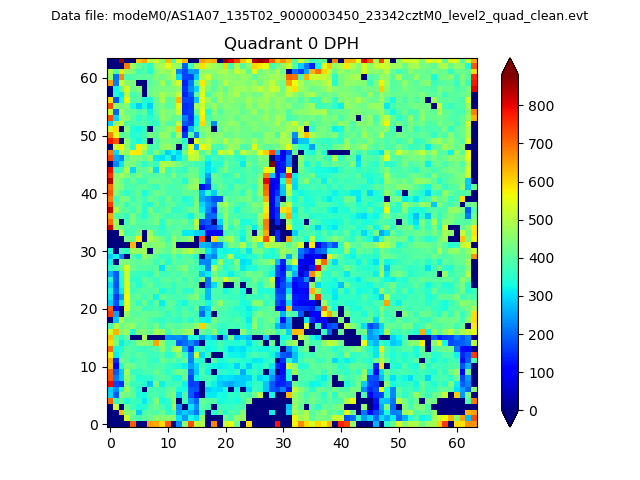 |
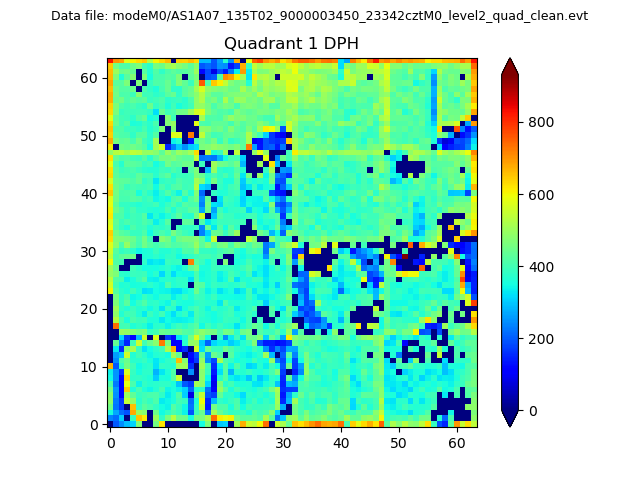 |
Quadrant B |
|---|---|---|---|
| Quadrant D | 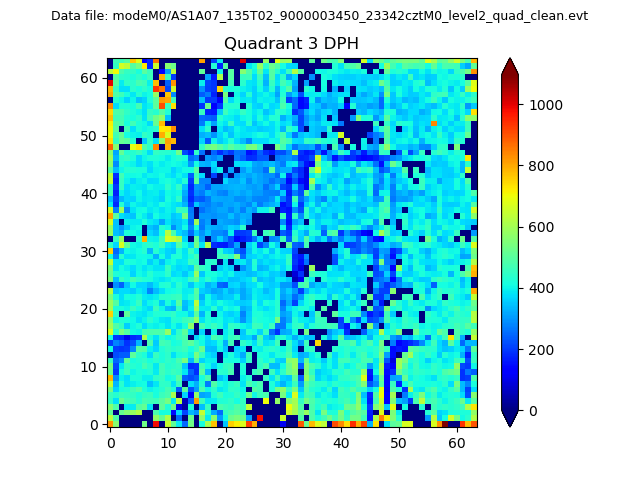 |
 |
Quadrant C |
| Plot type | Count rate plots | Images |
|---|---|---|
| Comparison with Poisson distribution Blue bars denote a histogram of data divided into 1 sec bins. Red curve is a Poisson curve with rate = median count rate of data. |
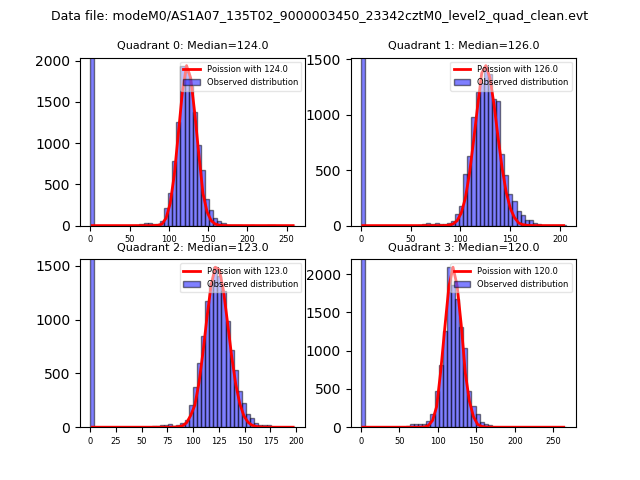 |
 |
| Quadrant-wise count rates Data is divided into 100 sec bins |
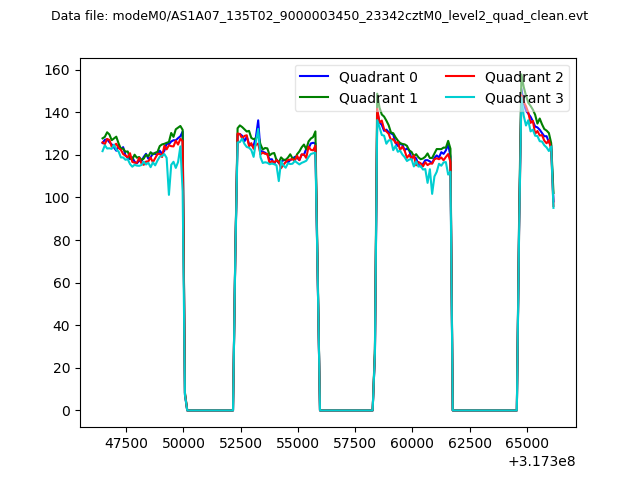 |
|
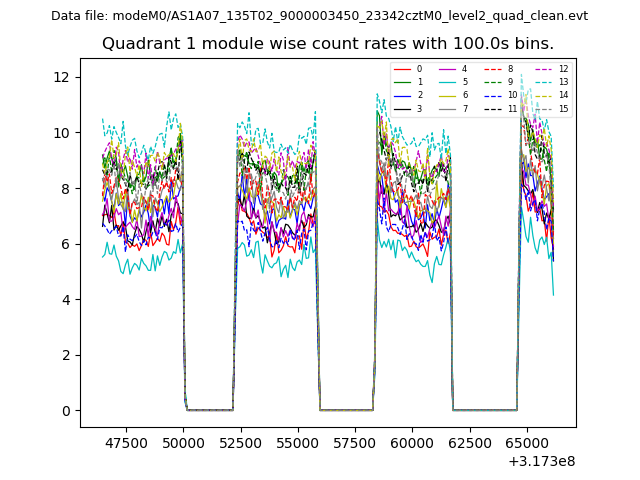
| Module-wise count rates for Quadrant A Data is divided into 100 sec bins |
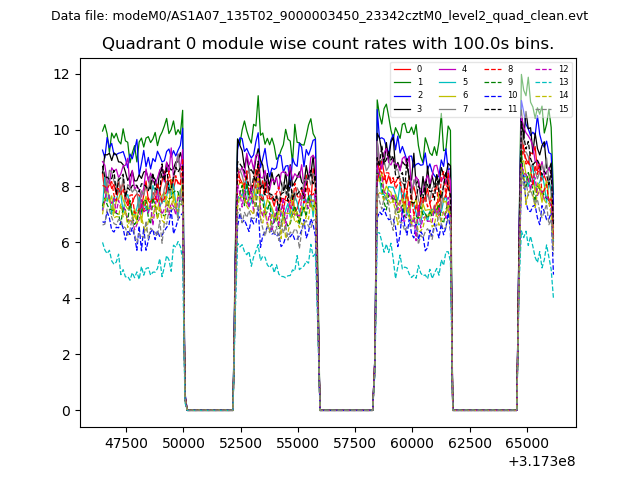 |
 |
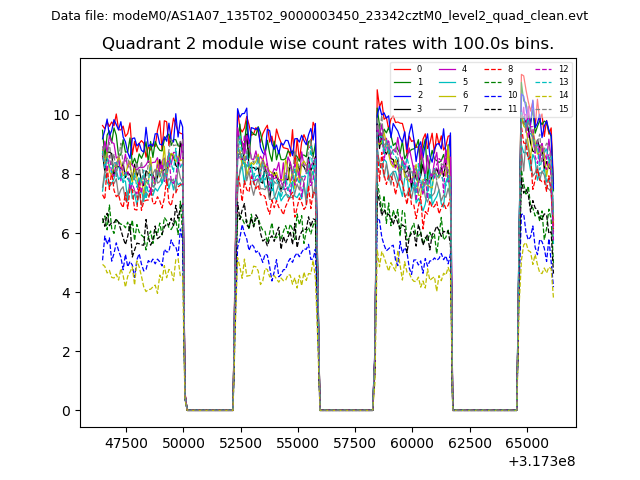
| Module-wise count rates for Quadrant B Data is divided into 100 sec bins |
 |
 |
| Module-wise count rates for Quadrant C Data is divided into 100 sec bins |
 |
 |
| Module-wise count rates for Quadrant D Data is divided into 100 sec bins |
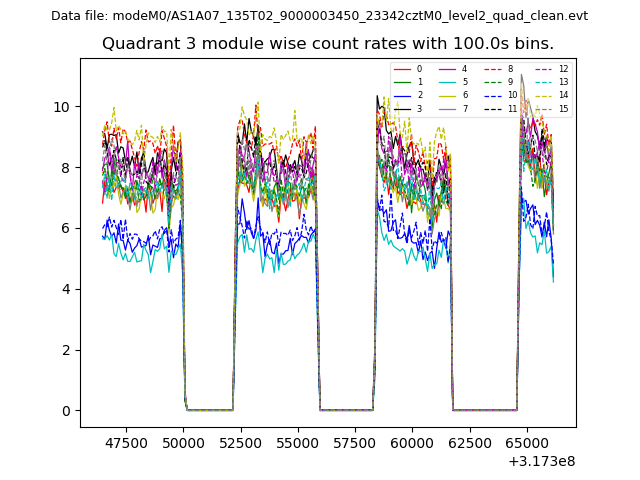 |
 |
| Parameter | Plot |
|---|---|
| CZT HV Monitor | 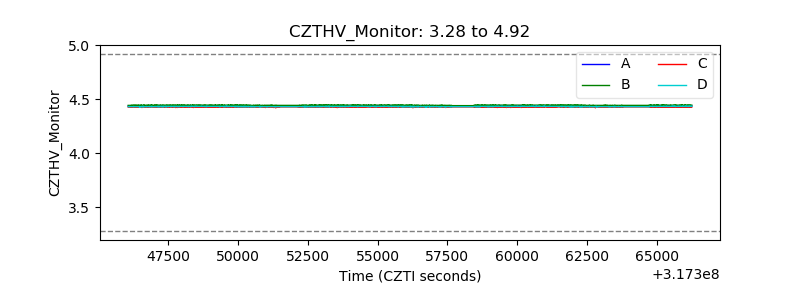 |
| D_VDD | 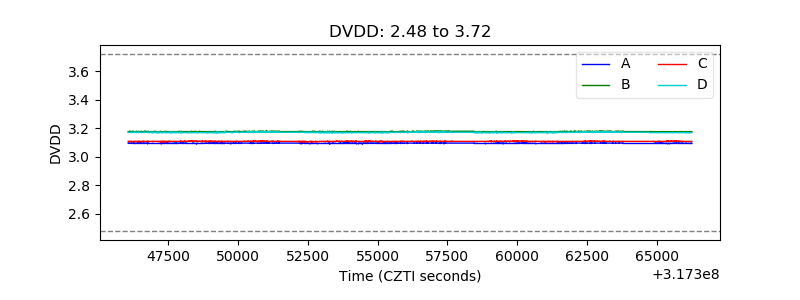 |
| Temperature 1 | 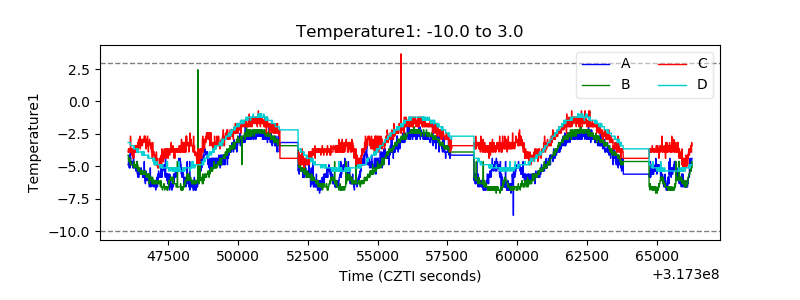 |
| Veto HV Monitor | 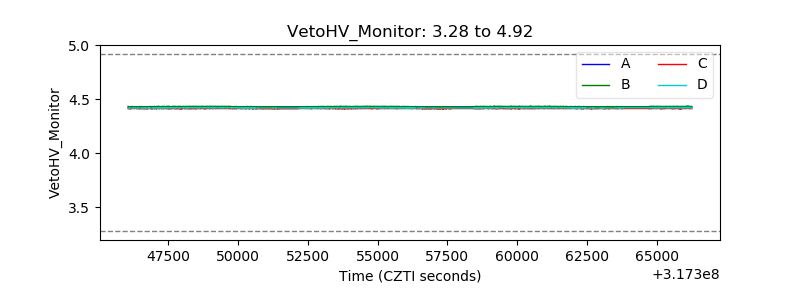 |
| Veto LLD | 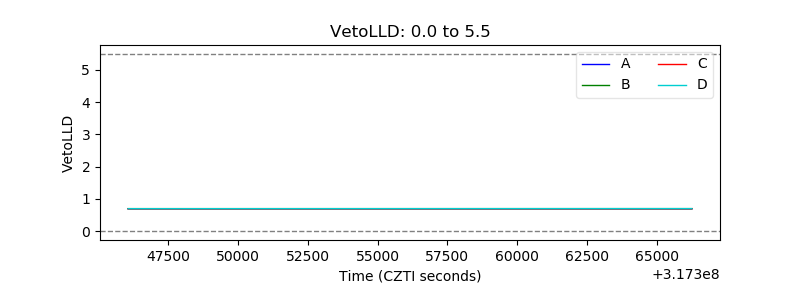 |
| Alpha Counter | 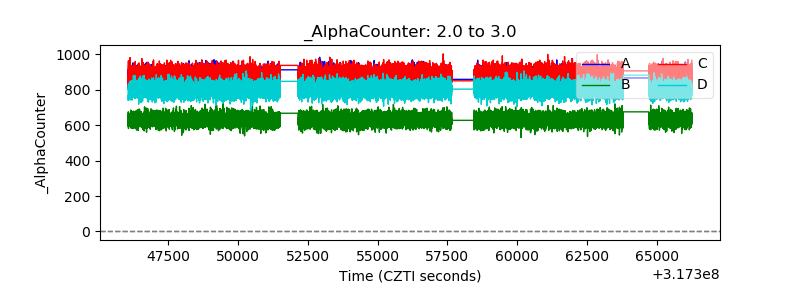 |
| _CPM_Rate |  |
| CZT Counter | 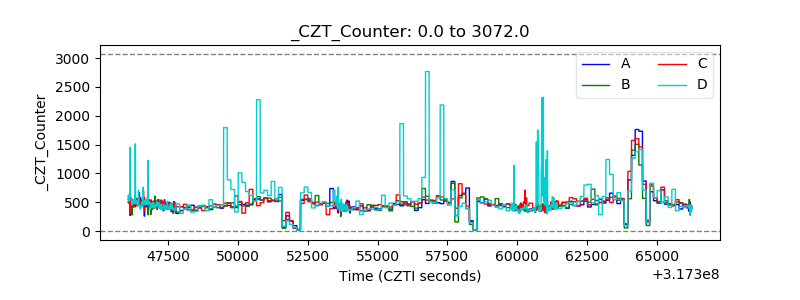 |
| +2.5 Volts monitor | 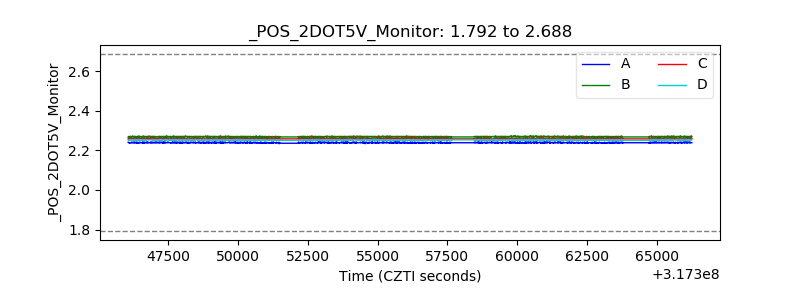 |
| +5 Volts monitor |  |
| _ROLL_ROT | 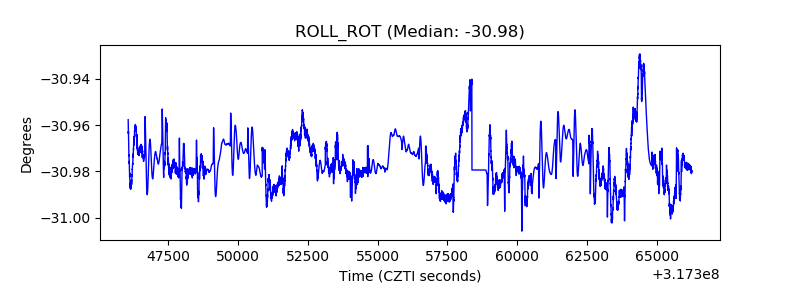 |
| _Roll_DEC | 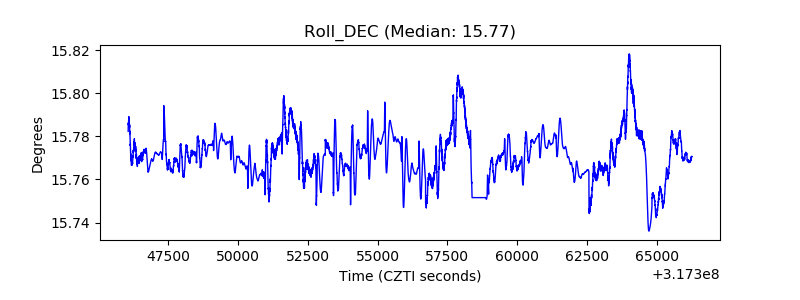 |
| _Roll_RA | 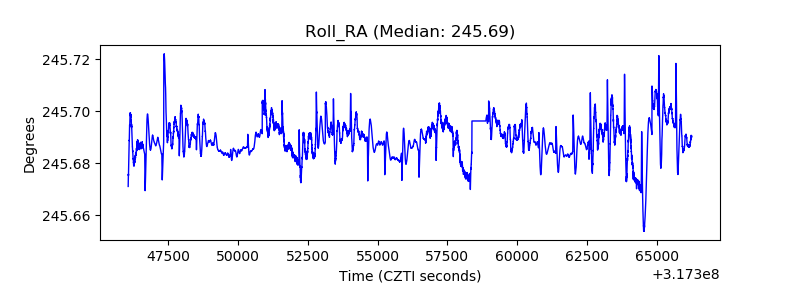 |
| Veto Counter | 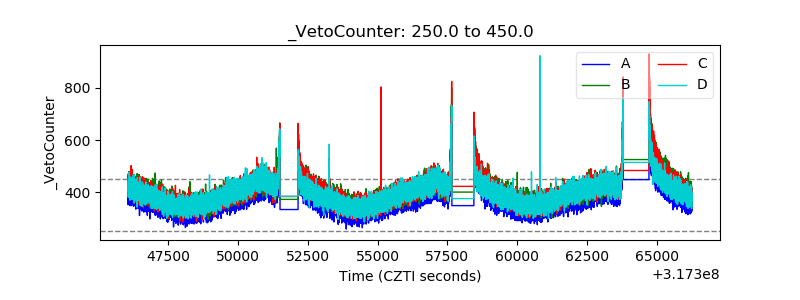 |