| Param | Original file | Final file |
|---|---|---|
| Filename | modeM0/AS1A07_135T02_9000003450_23347cztM0_level2.evt | modeM0/AS1A07_135T02_9000003450_23347cztM0_level2_quad_clean.evt |
| Size (bytes) | 493,873,920 | 99,806,400 |
| Size | 471.0 MB | 95.2 MB |
| Events in quadrant A | 3,382,515 | 648,612 |
| Events in quadrant B | 3,443,406 | 664,694 |
| Events in quadrant C | 3,463,289 | 649,397 |
| Events in quadrant D | 4,246,335 | 625,879 |
| Mode M9 | |||
|---|---|---|---|
| Quadrant | BADHDUFLAG | Total packets | Discarded packets |
| A | 0 | 13 | 0 |
| B | 0 | 14 | 0 |
| C | 0 | 14 | 0 |
| D | 0 | 14 | 0 |
| Mode M0 | |||
|---|---|---|---|
| Quadrant | BADHDUFLAG | Total packets | Discarded packets |
| A | 0 | 13562 | 2 |
| B | 0 | 13712 | 2 |
| C | 0 | 13863 | 2 |
| D | 0 | 16703 | 2 |
| Mode SS | |||
|---|---|---|---|
| Quadrant | BADHDUFLAG | Total packets | Discarded packets |
| A | 0 | 126 | 0 |
| B | 0 | 126 | 0 |
| C | 0 | 126 | 0 |
| D | 0 | 126 | 0 |
| Quadrant | Total seconds | Saturated seconds | Saturation percentage |
|---|---|---|---|
| A | 6220 | 50 | 0.803859% |
| B | 6220 | 59 | 0.948553% |
| C | 6220 | 78 | 1.254019% |
| D | 6220 | 71 | 1.141479% |
Noise dominated data is calculated using 1-second bins in cleaned event files. If a bin has >2000 counts, and if more than 50% of those come from <1% of pixels, then it is considered to be noise-dominated and hence unusable.
| Quadrant | # 1 sec bins | Bins with >0 counts | Bins with >2000 counts | High rate bins dominated by noise | Noise dominated (total time) | Noise dominated (detector-on time) | Marked lightcurve |
|---|---|---|---|---|---|---|---|
| A | 7535 | 6221 | 0 | 0 | 0.00% | 0.00% |  |
| B | 7535 | 6221 | 4 | 4 | 0.05% | 0.06% |  |
| C | 7535 | 6221 | 0 | 0 | 0.00% | 0.00% |  |
| D | 7535 | 6221 | 25 | 25 | 0.33% | 0.40% |  |
Top three noisy pixels from each quadrant. If the there are fewer than three noisy pixels in the level2.evt file, extra rows are filled as -1
| Pixel properties | Quadrant properties | ||||||
|---|---|---|---|---|---|---|---|
| Quadrant | DetID | PixID | Counts | Sigma | Mean | Median | Sigma |
| A | 2 | 79 | 35532 | 200.59 | 867 | 853 | 172.9 |
| A | 6 | 16 | 9856 | 52.08 | 867 | 853 | 172.9 |
| A | 13 | 254 | 9153 | 48.01 | 867 | 853 | 172.9 |
| B | 0 | 189 | 58741 | 366.0 | 853 | 836 | 158.2 |
| B | 12 | 111 | 18204 | 109.78 | 853 | 836 | 158.2 |
| B | 11 | 111 | 16516 | 99.11 | 853 | 836 | 158.2 |
| C | 14 | 238 | 134383 | 692.4 | 837 | 847 | 192.9 |
| C | 0 | 239 | 19134 | 94.82 | 837 | 847 | 192.9 |
| C | 2 | 16 | 17503 | 86.36 | 837 | 847 | 192.9 |
| D | 1 | 52 | 586130 | 2820.44 | 851 | 831 | 207.5 |
| D | 9 | 85 | 220123 | 1056.72 | 851 | 831 | 207.5 |
| D | 2 | 152 | 91885 | 438.77 | 851 | 831 | 207.5 |
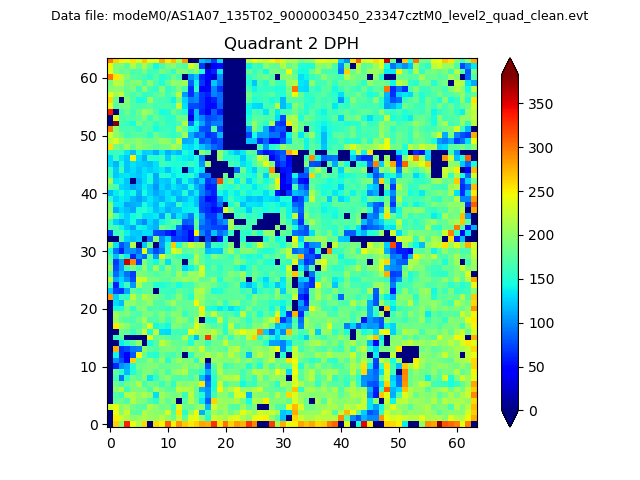
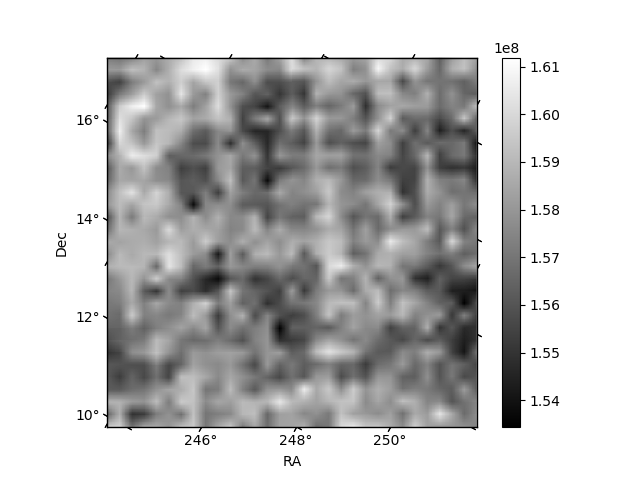
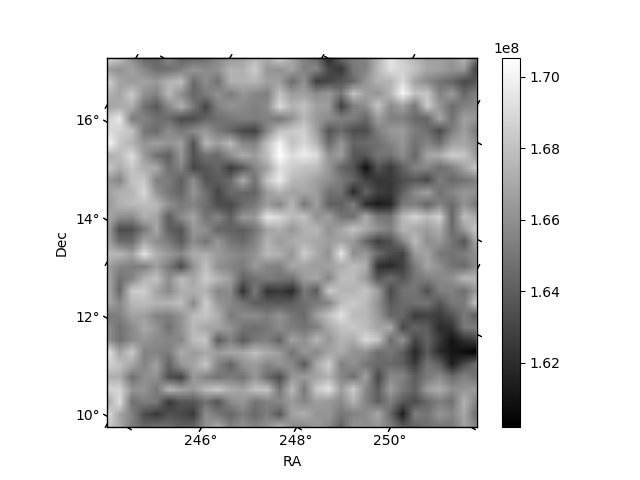
Histogram calculated using DETX and DETY for each event in the final _common_clean file
| Quadrant A | 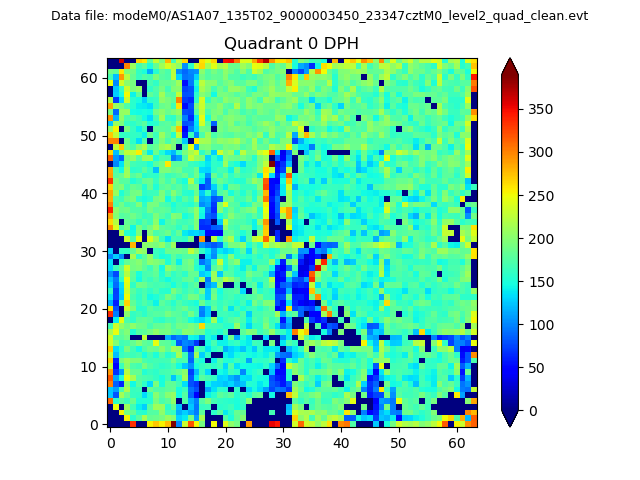 |
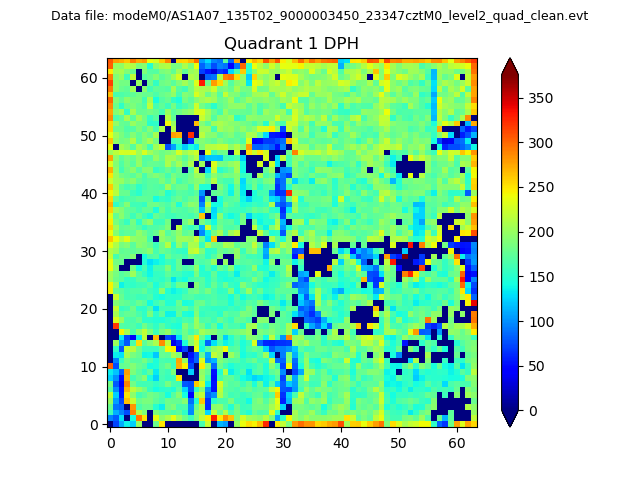 |
Quadrant B |
|---|---|---|---|
| Quadrant D | 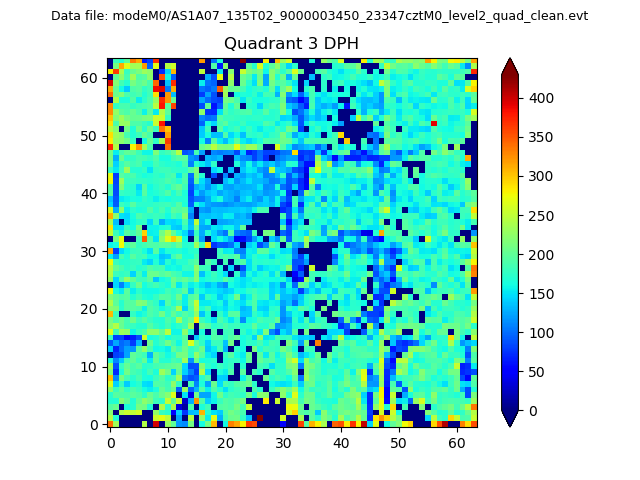 |
 |
Quadrant C |
| Plot type | Count rate plots | Images |
|---|---|---|
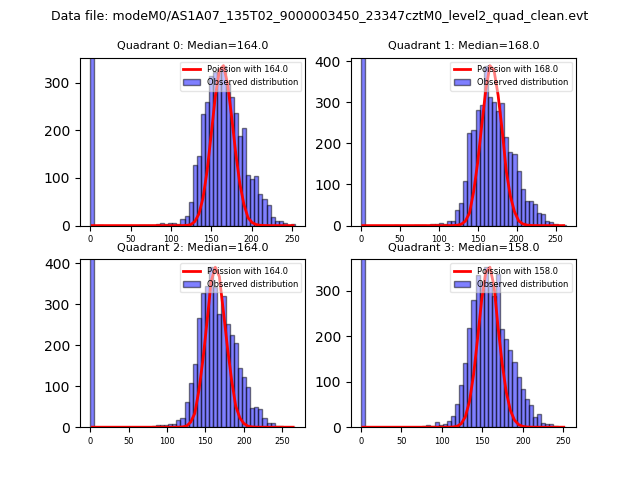
| Comparison with Poisson distribution Blue bars denote a histogram of data divided into 1 sec bins. Red curve is a Poisson curve with rate = median count rate of data. |
 |
 |
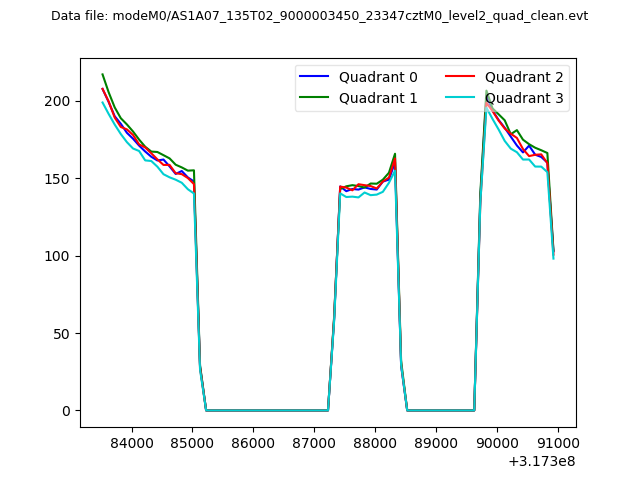
| Quadrant-wise count rates Data is divided into 100 sec bins |
 |
|
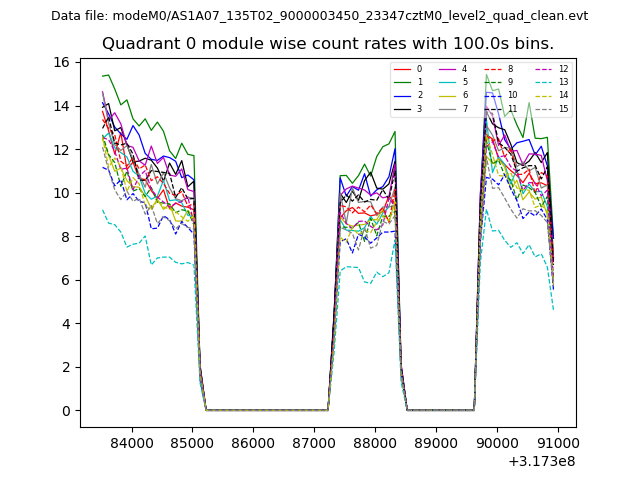
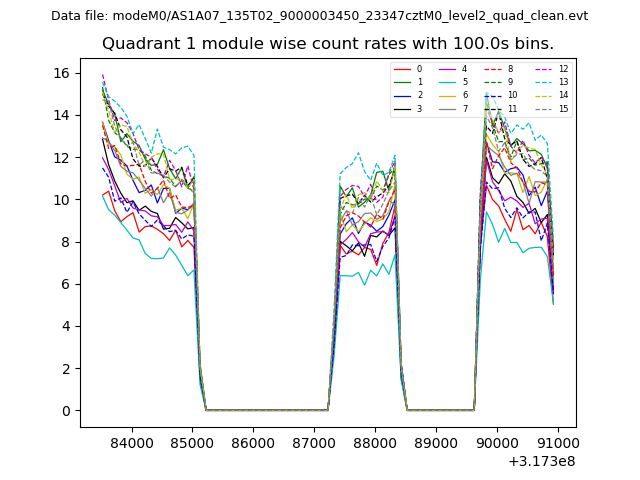
| Module-wise count rates for Quadrant A Data is divided into 100 sec bins |
 |
 |
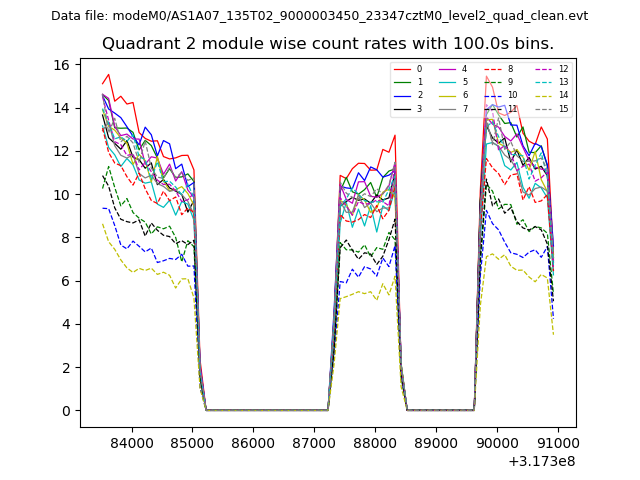
| Module-wise count rates for Quadrant B Data is divided into 100 sec bins |
 |
 |
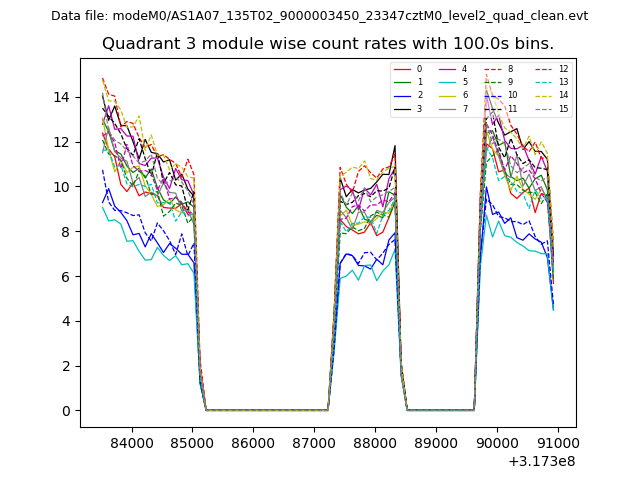
| Module-wise count rates for Quadrant C Data is divided into 100 sec bins |
 |
 |
| Module-wise count rates for Quadrant D Data is divided into 100 sec bins |
 |
 |
| Parameter | Plot |
|---|---|
| CZT HV Monitor | 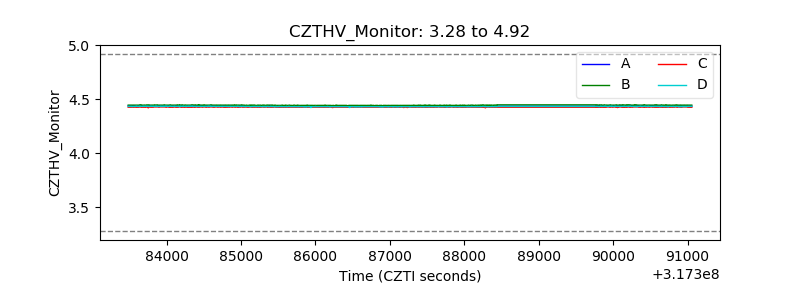 |
| D_VDD | 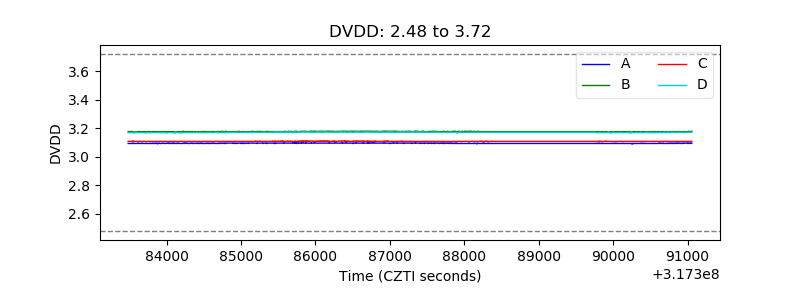 |
| Temperature 1 | 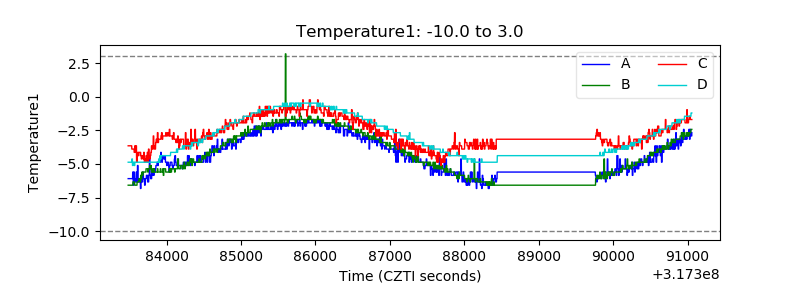 |
| Veto HV Monitor | 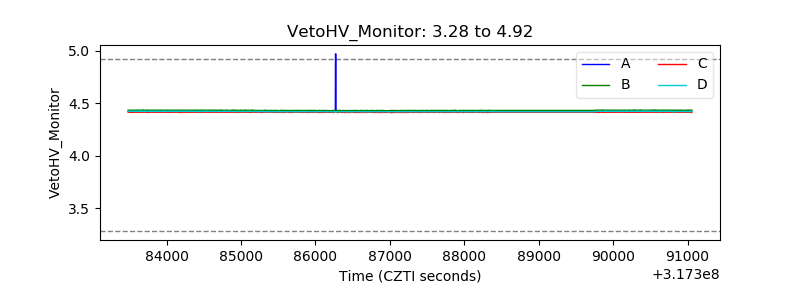 |
| Veto LLD | 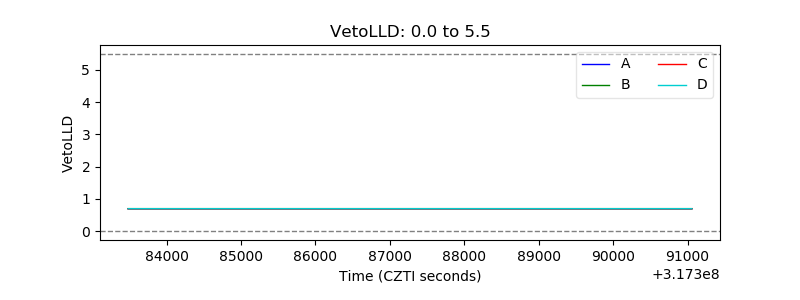 |
| Alpha Counter | 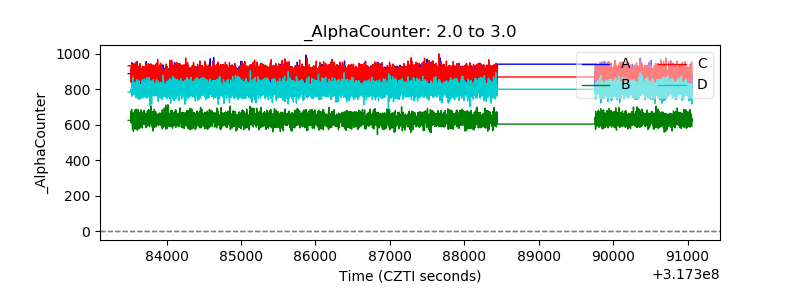 |
| _CPM_Rate | 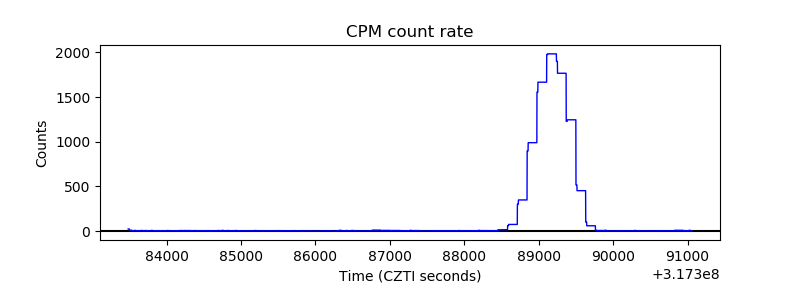 |
| CZT Counter | 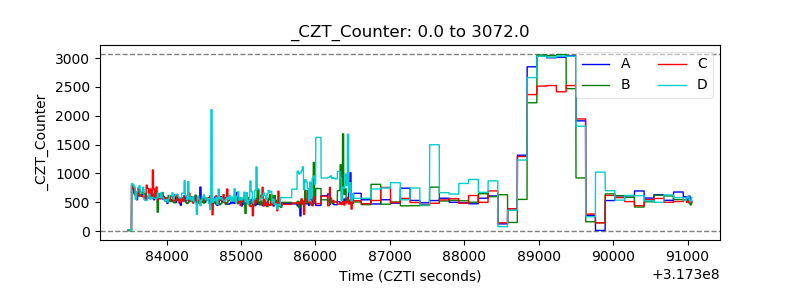 |
| +2.5 Volts monitor |  |
| +5 Volts monitor |  |
| _ROLL_ROT | 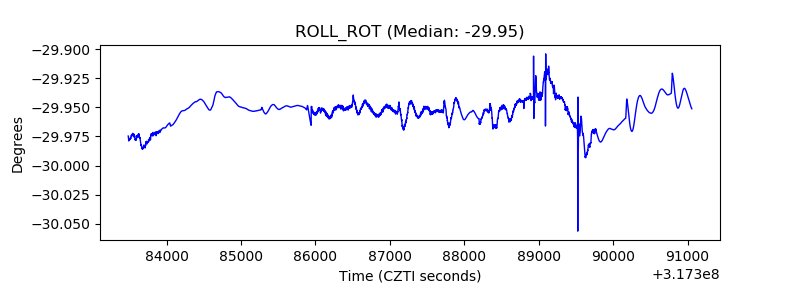 |
| _Roll_DEC | 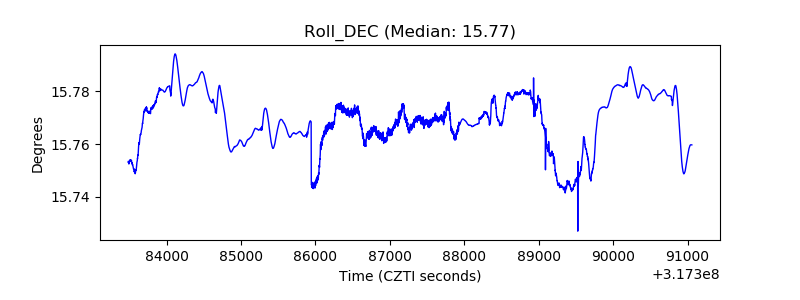 |
| _Roll_RA | 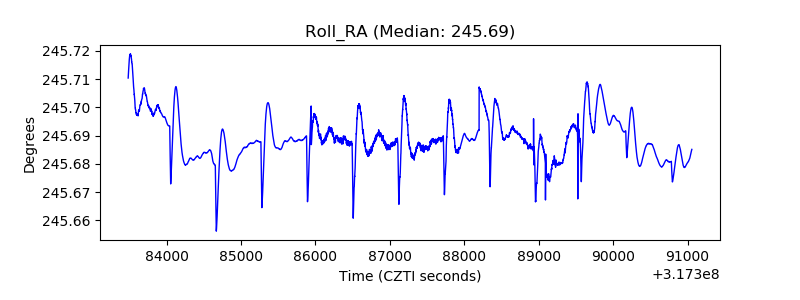 |
| Veto Counter | 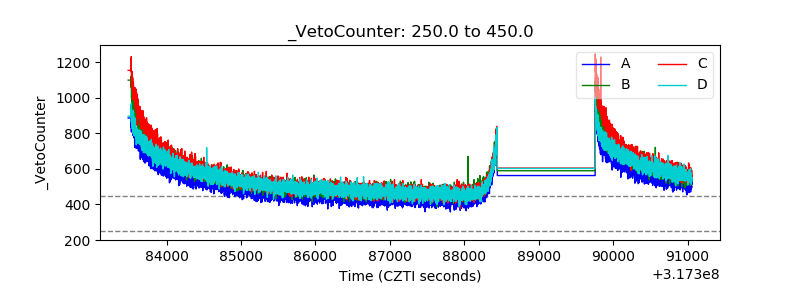 |