| Param | Original file | Final file |
|---|---|---|
| Filename | modeM0/AS1A07_135T02_9000003450_23348cztM0_level2.evt | modeM0/AS1A07_135T02_9000003450_23348cztM0_level2_quad_clean.evt |
| Size (bytes) | 1,622,053,440 | 274,708,800 |
| Size | 1.5 GB | 262.0 MB |
| Events in quadrant A | 11,226,981 | 1,716,094 |
| Events in quadrant B | 10,946,067 | 1,775,853 |
| Events in quadrant C | 11,274,105 | 1,727,329 |
| Events in quadrant D | 14,277,198 | 1,672,119 |
| Mode M9 | |||
|---|---|---|---|
| Quadrant | BADHDUFLAG | Total packets | Discarded packets |
| A | 0 | 50 | 0 |
| B | 0 | 50 | 0 |
| C | 0 | 50 | 0 |
| D | 0 | 50 | 0 |
| Mode M0 | |||
|---|---|---|---|
| Quadrant | BADHDUFLAG | Total packets | Discarded packets |
| A | 0 | 45371 | 81 |
| B | 0 | 44433 | 107 |
| C | 0 | 45426 | 113 |
| D | 0 | 56065 | 162 |
| Mode SS | |||
|---|---|---|---|
| Quadrant | BADHDUFLAG | Total packets | Discarded packets |
| A | 0 | 422 | 0 |
| B | 0 | 422 | 0 |
| C | 0 | 422 | 0 |
| D | 0 | 422 | 0 |
| Quadrant | Total seconds | Saturated seconds | Saturation percentage |
|---|---|---|---|
| A | 20756 | 385 | 1.854885% |
| B | 20749 | 236 | 1.137404% |
| C | 20747 | 304 | 1.465272% |
| D | 20743 | 643 | 3.099841% |
Noise dominated data is calculated using 1-second bins in cleaned event files. If a bin has >2000 counts, and if more than 50% of those come from <1% of pixels, then it is considered to be noise-dominated and hence unusable.
| Quadrant | # 1 sec bins | Bins with >0 counts | Bins with >2000 counts | High rate bins dominated by noise | Noise dominated (total time) | Noise dominated (detector-on time) | Marked lightcurve |
|---|---|---|---|---|---|---|---|
| A | 25827 | 20788 | 181 | 181 | 0.70% | 0.87% | 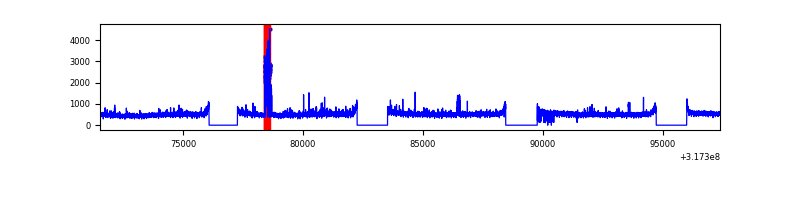 |
| B | 25827 | 20783 | 9 | 9 | 0.03% | 0.04% | 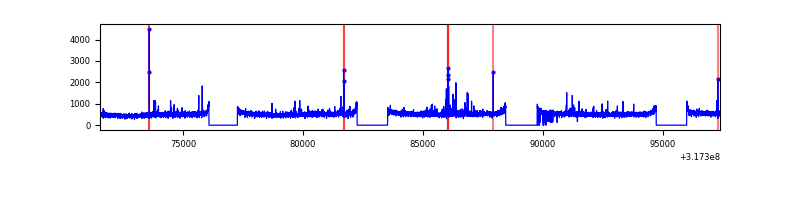 |
| C | 25828 | 20788 | 0 | 0 | 0.00% | 0.00% | 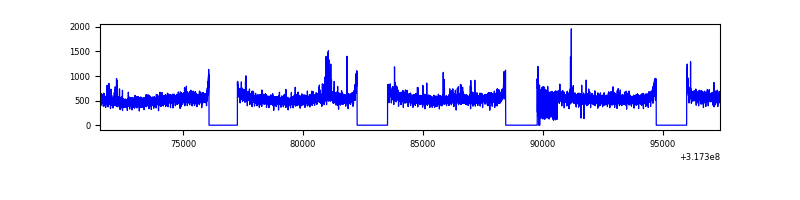 |
| D | 25828 | 20781 | 411 | 411 | 1.59% | 1.98% | 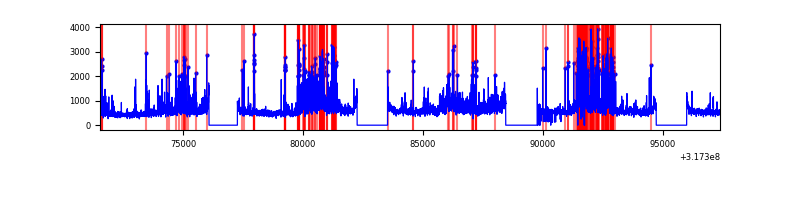 |
Top three noisy pixels from each quadrant. If the there are fewer than three noisy pixels in the level2.evt file, extra rows are filled as -1
| Pixel properties | Quadrant properties | ||||||
|---|---|---|---|---|---|---|---|
| Quadrant | DetID | PixID | Counts | Sigma | Mean | Median | Sigma |
| A | 15 | 174 | 485406 | 879.08 | 2762 | 2711 | 549.1 |
| A | 6 | 16 | 55445 | 96.04 | 2762 | 2711 | 549.1 |
| A | 2 | 79 | 54316 | 93.98 | 2762 | 2711 | 549.1 |
| B | 0 | 189 | 67700 | 128.08 | 2741 | 2680 | 507.7 |
| B | 12 | 111 | 60197 | 113.3 | 2741 | 2680 | 507.7 |
| B | 11 | 111 | 53979 | 101.05 | 2741 | 2680 | 507.7 |
| C | 14 | 238 | 428446 | 690.04 | 2677 | 2701 | 617.0 |
| C | 10 | 9 | 228229 | 365.53 | 2677 | 2701 | 617.0 |
| C | 7 | 247 | 80406 | 125.94 | 2677 | 2701 | 617.0 |
| D | 1 | 52 | 2400700 | 3672.09 | 2701 | 2633 | 653.1 |
| D | 13 | 104 | 527601 | 803.87 | 2701 | 2633 | 653.1 |
| D | 9 | 85 | 445275 | 677.81 | 2701 | 2633 | 653.1 |
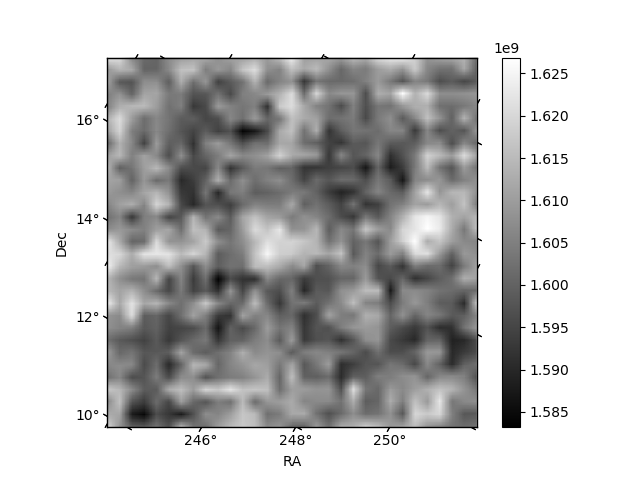
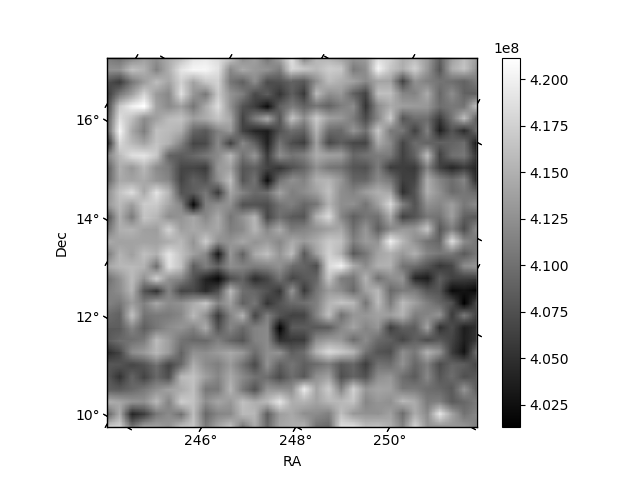
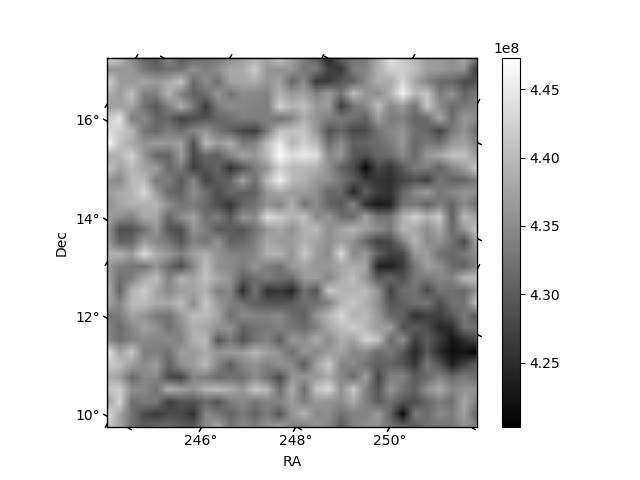
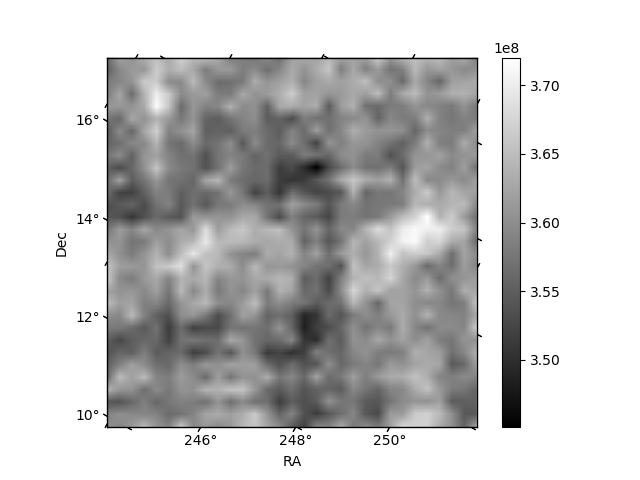
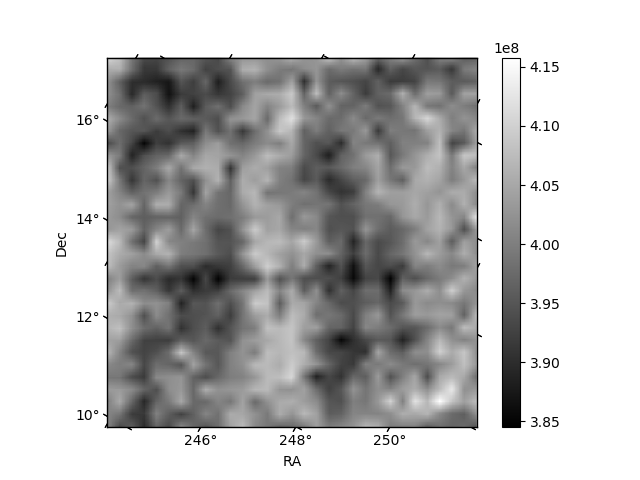
Histogram calculated using DETX and DETY for each event in the final _common_clean file
| Quadrant A | 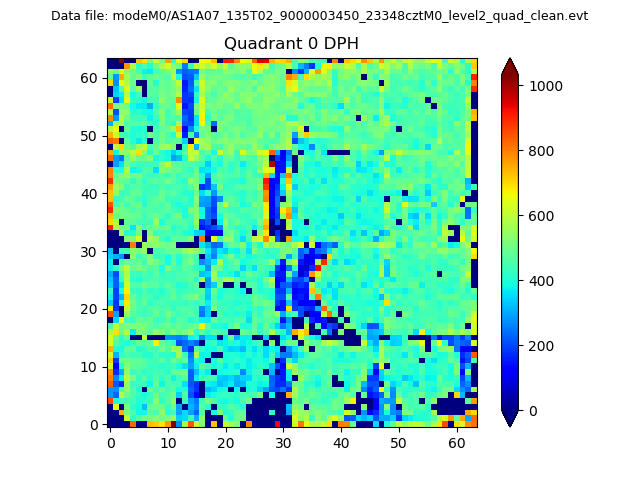 |
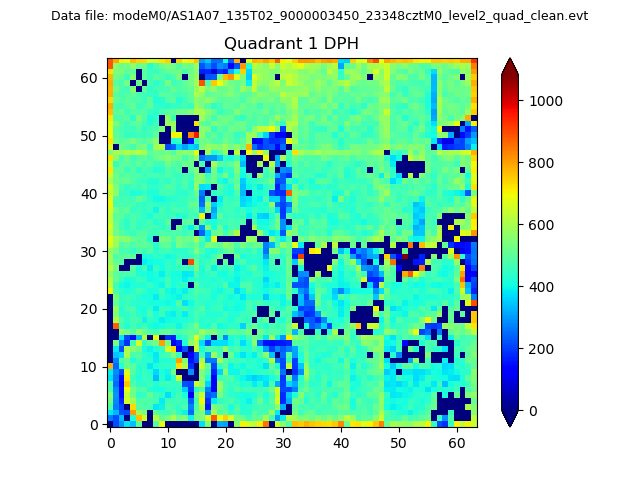 |
Quadrant B |
|---|---|---|---|
| Quadrant D | 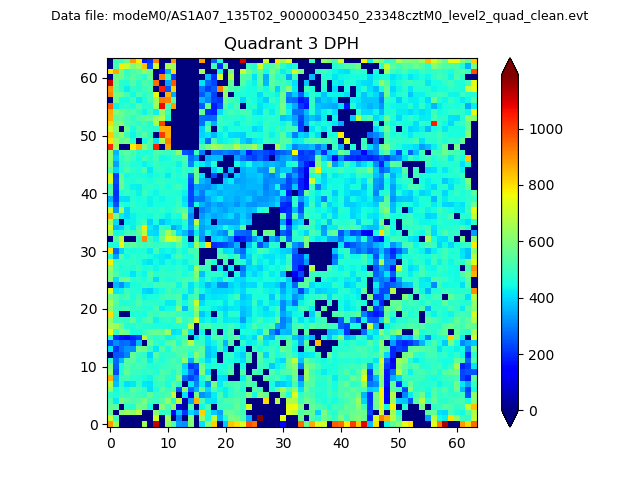 |
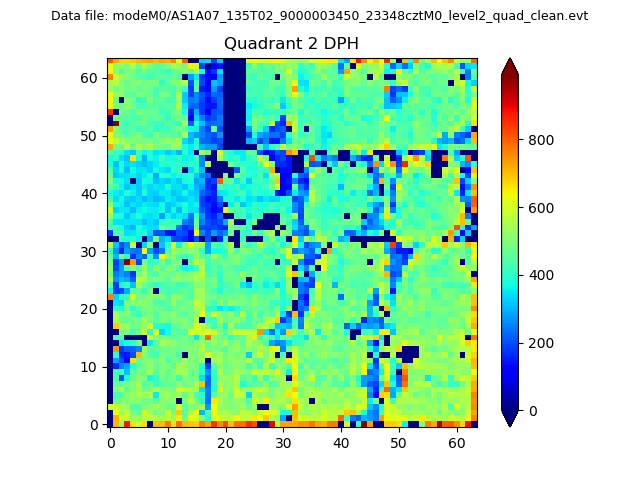 |
Quadrant C |
| Plot type | Count rate plots | Images |
|---|---|---|
| Comparison with Poisson distribution Blue bars denote a histogram of data divided into 1 sec bins. Red curve is a Poisson curve with rate = median count rate of data. |
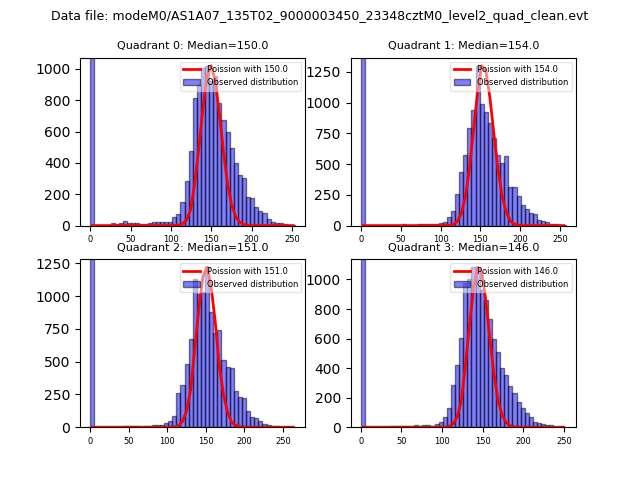 |
 |
| Quadrant-wise count rates Data is divided into 100 sec bins |
 |
|
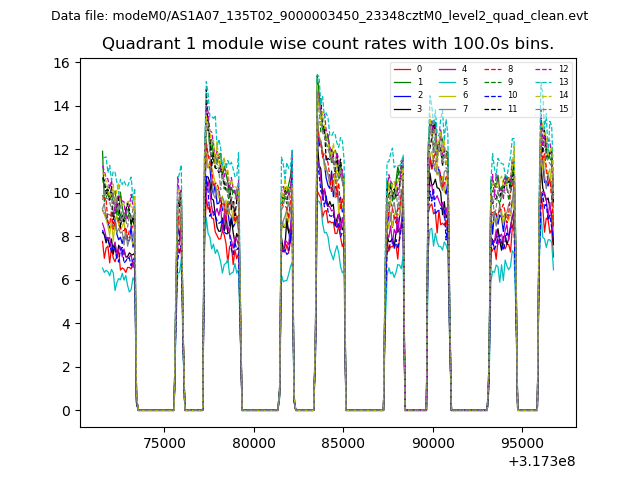
| Module-wise count rates for Quadrant A Data is divided into 100 sec bins |
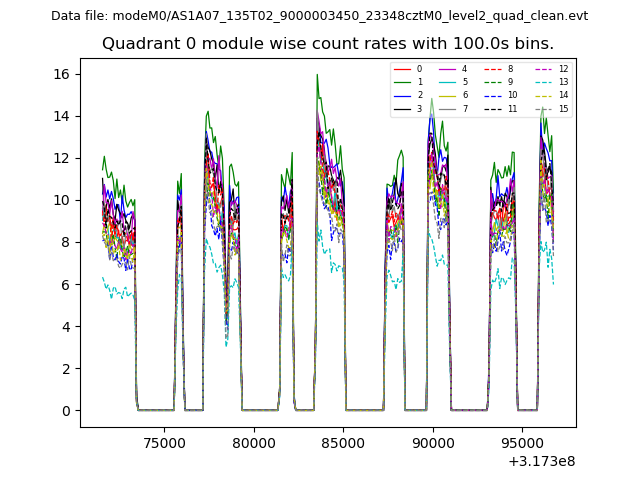 |
 |
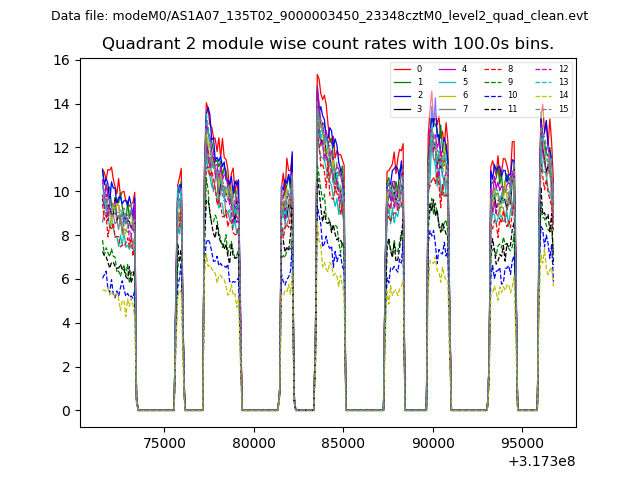
| Module-wise count rates for Quadrant B Data is divided into 100 sec bins |
 |
 |
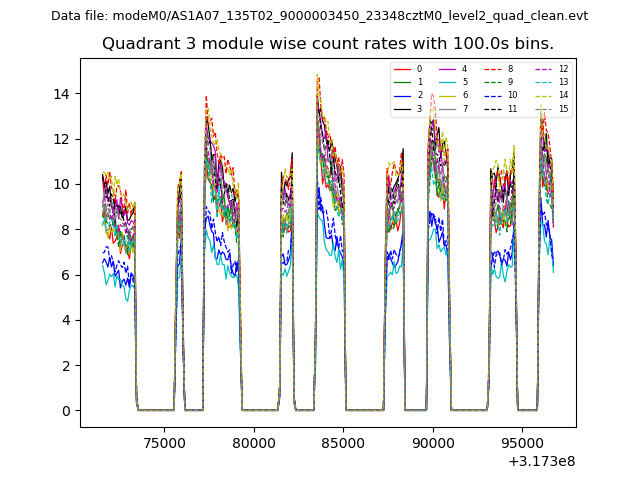
| Module-wise count rates for Quadrant C Data is divided into 100 sec bins |
 |
 |
| Module-wise count rates for Quadrant D Data is divided into 100 sec bins |
 |
 |
| Parameter | Plot |
|---|---|
| CZT HV Monitor | 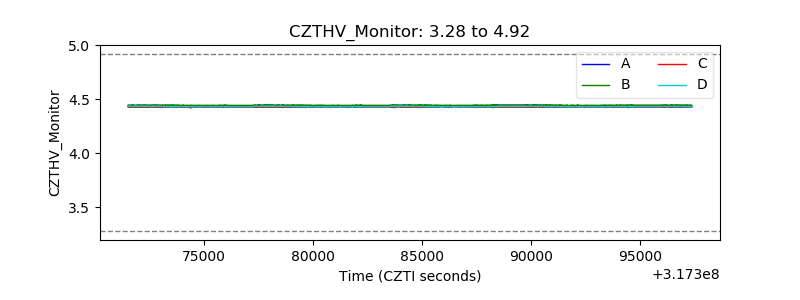 |
| D_VDD | 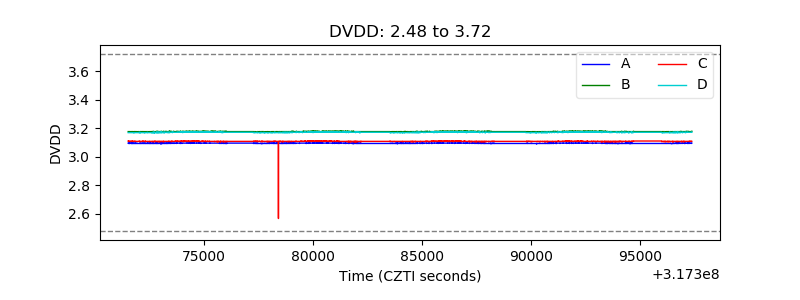 |
| Temperature 1 | 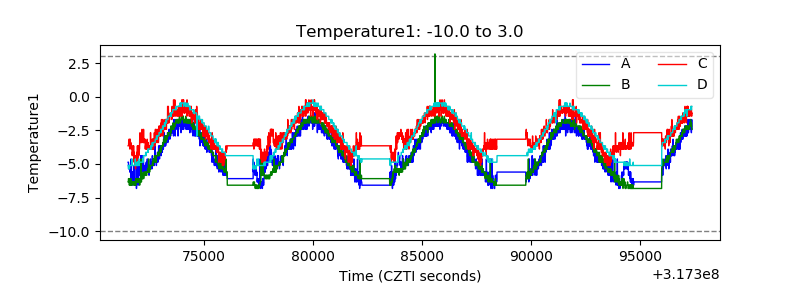 |
| Veto HV Monitor | 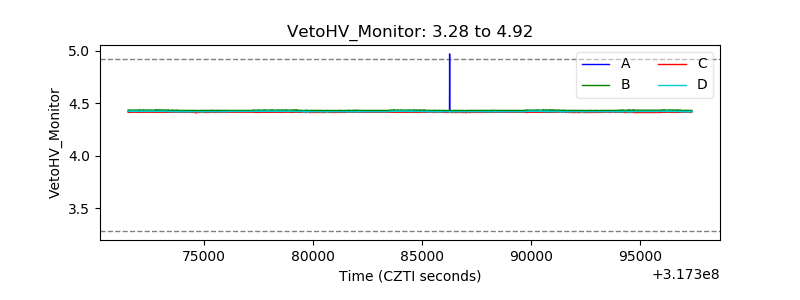 |
| Veto LLD | 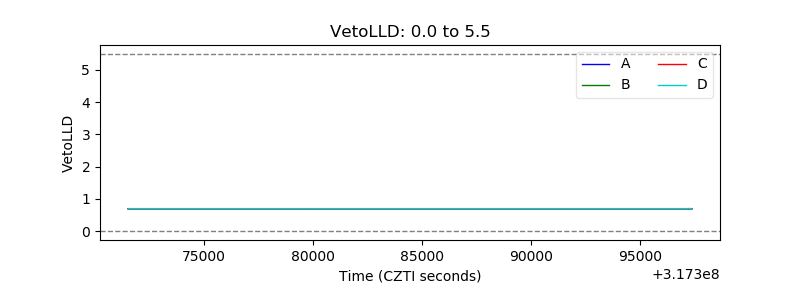 |
| Alpha Counter |  |
| _CPM_Rate | 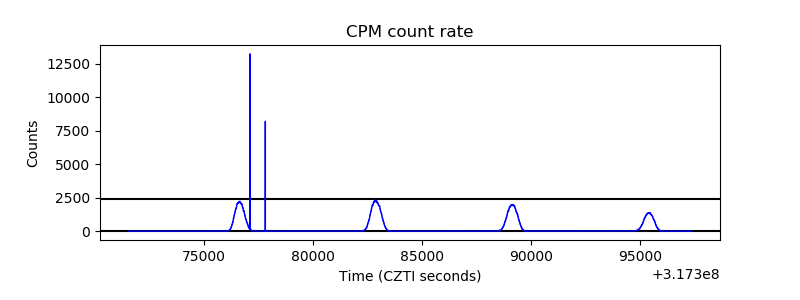 |
| CZT Counter |  |
| +2.5 Volts monitor |  |
| +5 Volts monitor |  |
| _ROLL_ROT | 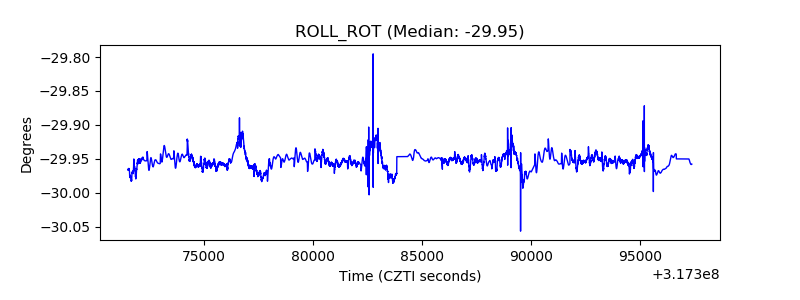 |
| _Roll_DEC | 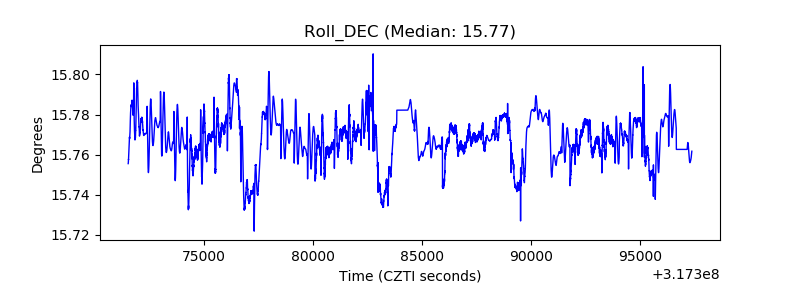 |
| _Roll_RA | 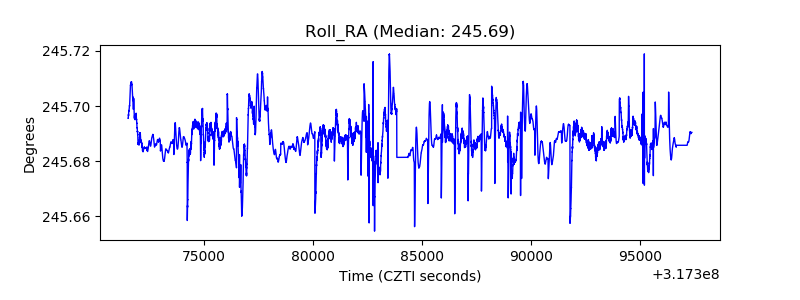 |
| Veto Counter | 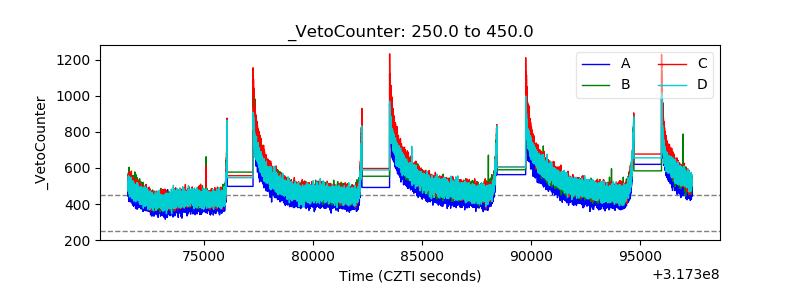 |