| Param | Original file | Final file |
|---|---|---|
| Filename | modeM0/AS1A07_135T02_9000003450_23349cztM0_level2.evt | modeM0/AS1A07_135T02_9000003450_23349cztM0_level2_quad_clean.evt |
| Size (bytes) | 236,554,560 | 33,016,320 |
| Size | 225.6 MB | 31.5 MB |
| Events in quadrant A | 1,675,043 | 193,567 |
| Events in quadrant B | 1,717,471 | 197,925 |
| Events in quadrant C | 1,720,215 | 193,018 |
| Events in quadrant D | 1,832,102 | 187,191 |
| Mode M9 | |||
|---|---|---|---|
| Quadrant | BADHDUFLAG | Total packets | Discarded packets |
| A | 0 | 3 | 1 |
| B | 0 | 2 | 0 |
| C | 0 | 2 | 0 |
| D | 0 | 3 | 1 |
| Mode M0 | |||
|---|---|---|---|
| Quadrant | BADHDUFLAG | Total packets | Discarded packets |
| A | 0 | 7327 | 621 |
| B | 0 | 7483 | 645 |
| C | 0 | 7472 | 599 |
| D | 0 | 7953 | 702 |
| Mode SS | |||
|---|---|---|---|
| Quadrant | BADHDUFLAG | Total packets | Discarded packets |
| A | 0 | 70 | 6 |
| B | 0 | 69 | 5 |
| C | 0 | 67 | 3 |
| D | 0 | 67 | 3 |
| Quadrant | Total seconds | Saturated seconds | Saturation percentage |
|---|---|---|---|
| A | 3199 | 20 | 0.625195% |
| B | 3204 | 27 | 0.842697% |
| C | 3201 | 32 | 0.999688% |
| D | 3201 | 43 | 1.343330% |
Noise dominated data is calculated using 1-second bins in cleaned event files. If a bin has >2000 counts, and if more than 50% of those come from <1% of pixels, then it is considered to be noise-dominated and hence unusable.
| Quadrant | # 1 sec bins | Bins with >0 counts | Bins with >2000 counts | High rate bins dominated by noise | Noise dominated (total time) | Noise dominated (detector-on time) | Marked lightcurve |
|---|---|---|---|---|---|---|---|
| A | 7165 | 3226 | 0 | 0 | 0.00% | 0.00% | 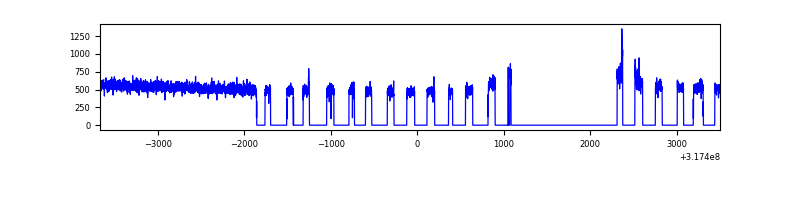 |
| B | 7168 | 3233 | 6 | 6 | 0.08% | 0.19% | 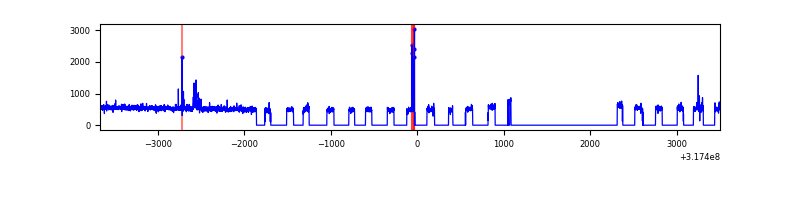 |
| C | 7167 | 3229 | 0 | 0 | 0.00% | 0.00% | 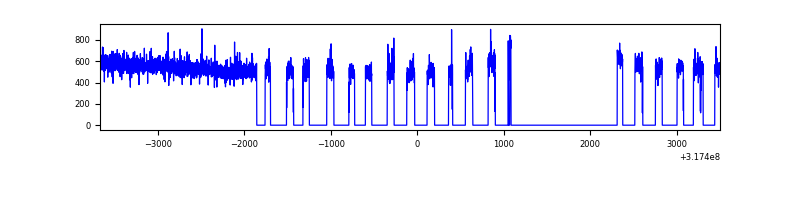 |
| D | 7167 | 3228 | 26 | 26 | 0.36% | 0.81% | 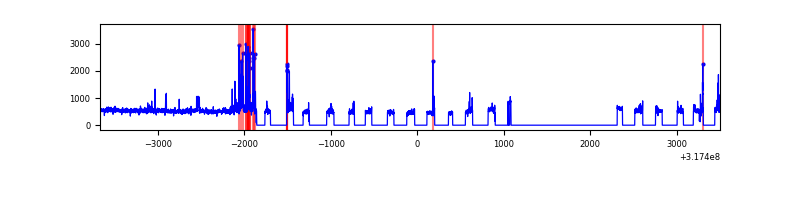 |
Top three noisy pixels from each quadrant. If the there are fewer than three noisy pixels in the level2.evt file, extra rows are filled as -1
| Pixel properties | Quadrant properties | ||||||
|---|---|---|---|---|---|---|---|
| Quadrant | DetID | PixID | Counts | Sigma | Mean | Median | Sigma |
| A | 15 | 174 | 18135 | 205.4 | 429 | 422 | 86.2 |
| A | 13 | 254 | 4722 | 49.86 | 429 | 422 | 86.2 |
| A | 0 | 226 | 3694 | 37.94 | 429 | 422 | 86.2 |
| B | 0 | 245 | 16914 | 203.09 | 423 | 413 | 81.3 |
| B | 0 | 190 | 15549 | 186.29 | 423 | 413 | 81.3 |
| B | 5 | 172 | 9926 | 117.08 | 423 | 413 | 81.3 |
| C | 14 | 238 | 66886 | 691.17 | 414 | 419 | 96.2 |
| C | 7 | 247 | 11746 | 117.79 | 414 | 419 | 96.2 |
| C | 2 | 16 | 10771 | 107.65 | 414 | 419 | 96.2 |
| D | 13 | 104 | 61368 | 582.95 | 422 | 408 | 104.6 |
| D | 1 | 52 | 54930 | 521.39 | 422 | 408 | 104.6 |
| D | 13 | 249 | 44311 | 419.84 | 422 | 408 | 104.6 |
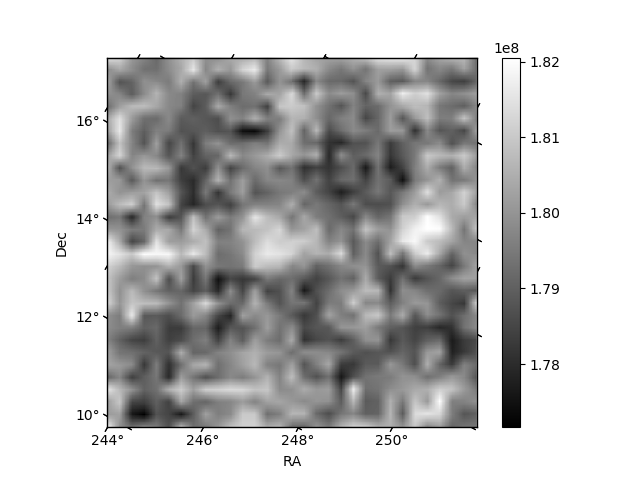
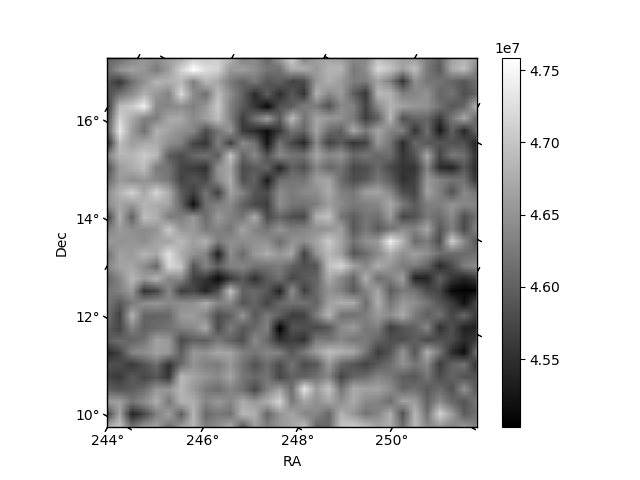
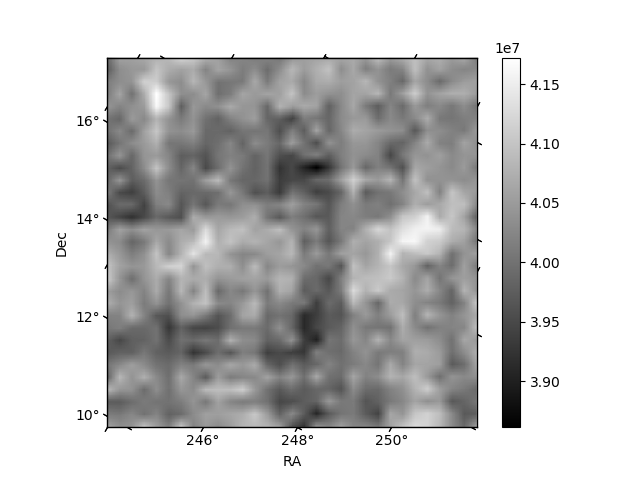
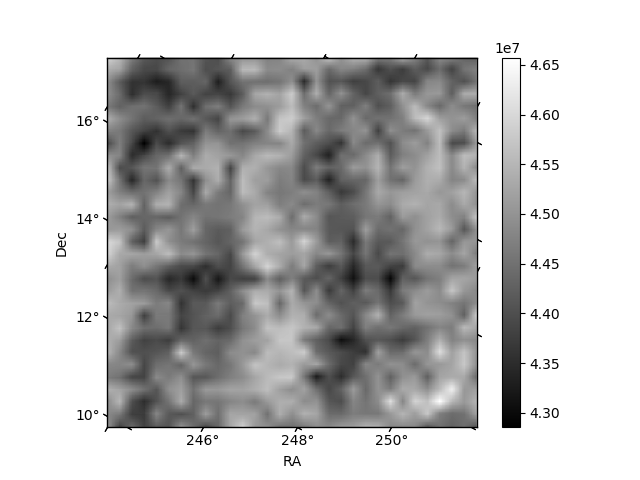
Histogram calculated using DETX and DETY for each event in the final _common_clean file
| Quadrant A | 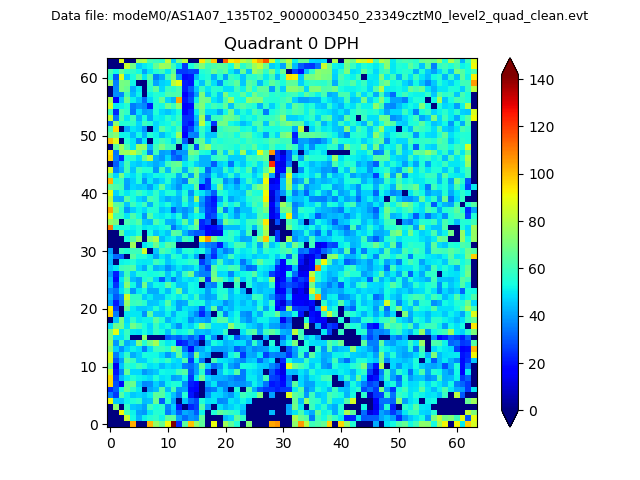 |
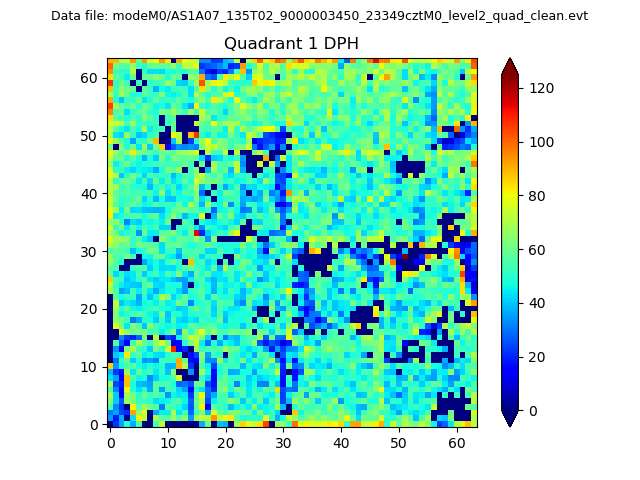 |
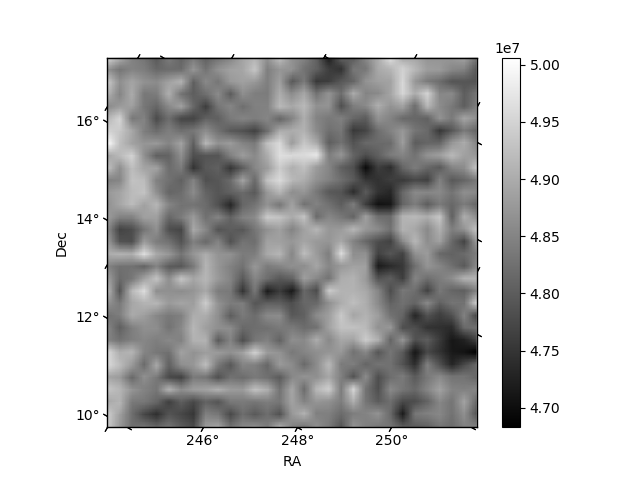
Quadrant B |
|---|---|---|---|
| Quadrant D | 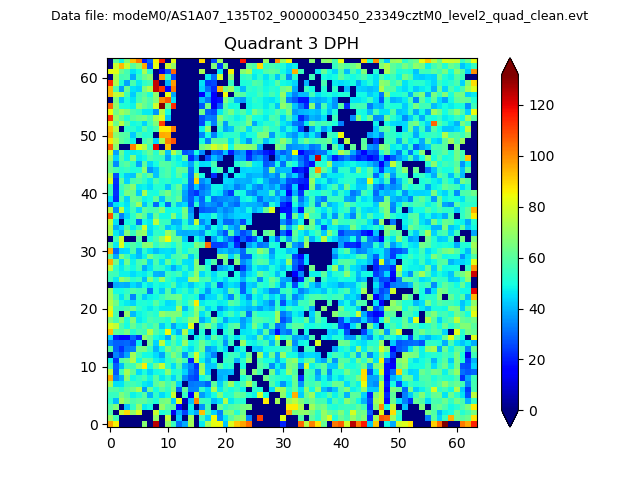 |
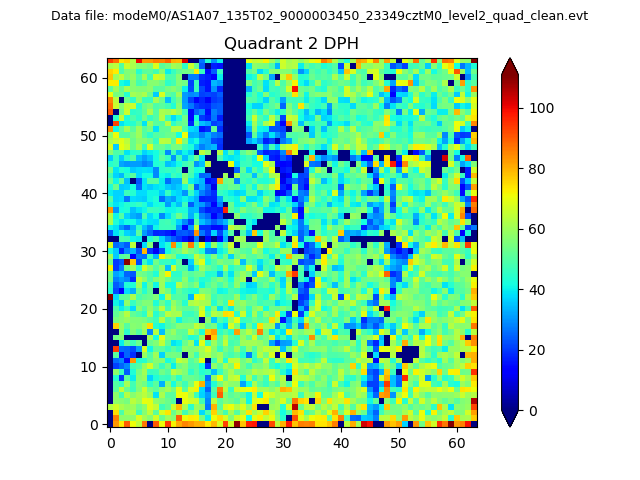 |
Quadrant C |
| Plot type | Count rate plots | Images |
|---|---|---|
| Comparison with Poisson distribution Blue bars denote a histogram of data divided into 1 sec bins. Red curve is a Poisson curve with rate = median count rate of data. |
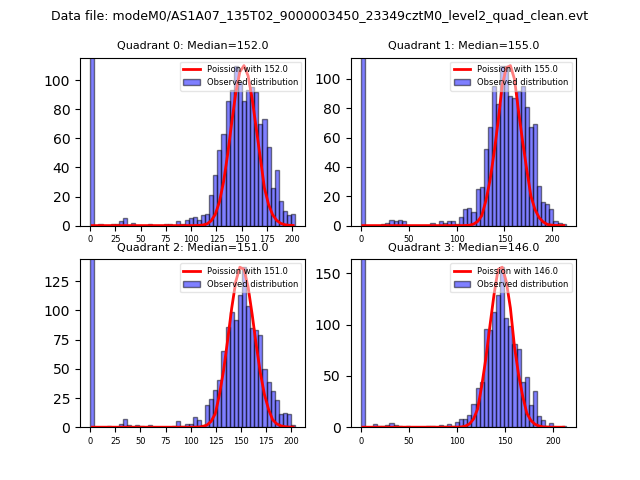 |
 |
| Quadrant-wise count rates Data is divided into 100 sec bins |
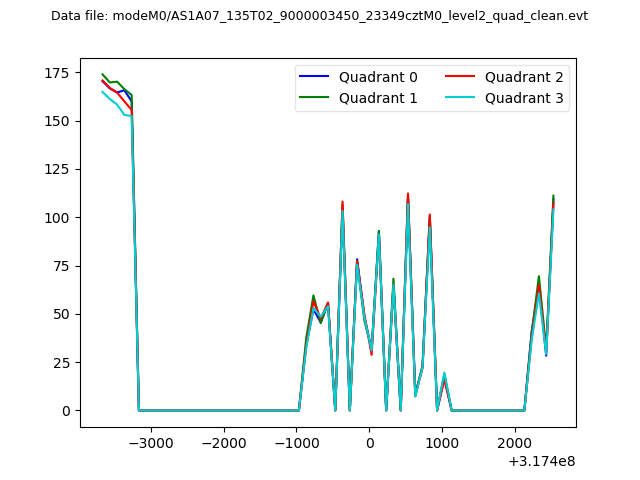 |
|
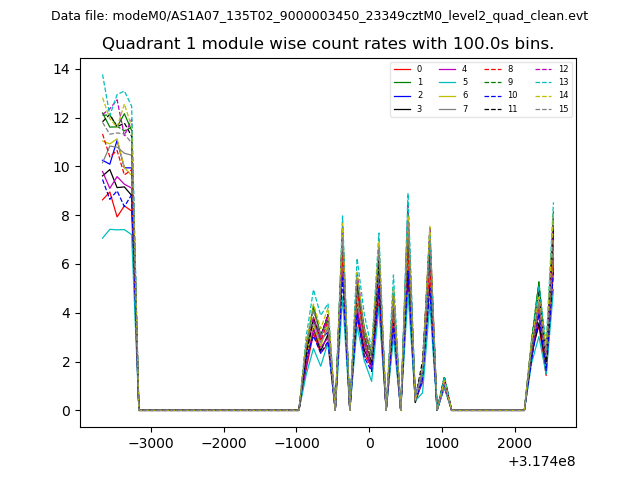
| Module-wise count rates for Quadrant A Data is divided into 100 sec bins |
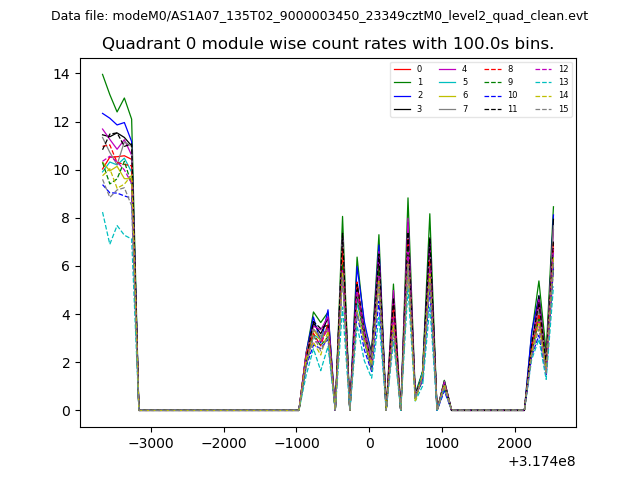 |
 |
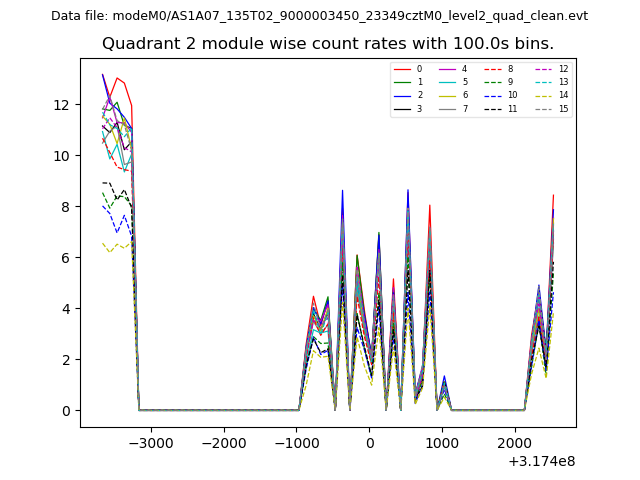
| Module-wise count rates for Quadrant B Data is divided into 100 sec bins |
 |
 |
| Module-wise count rates for Quadrant C Data is divided into 100 sec bins |
 |
 |
| Module-wise count rates for Quadrant D Data is divided into 100 sec bins |
 |
 |
| Parameter | Plot |
|---|---|
| CZT HV Monitor | 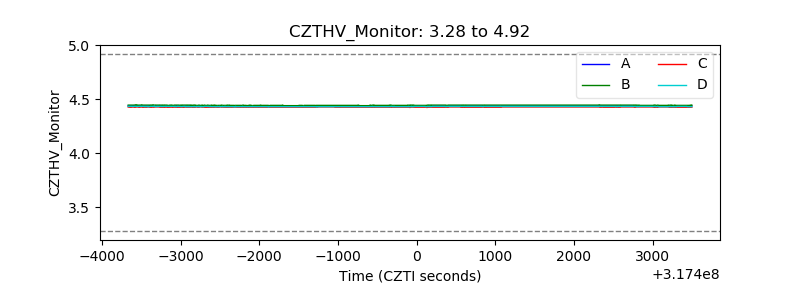 |
| D_VDD | 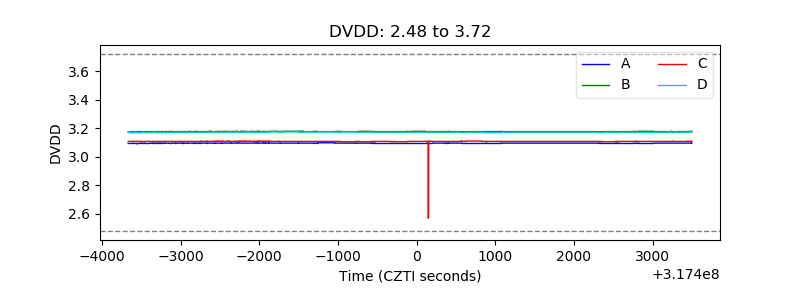 |
| Temperature 1 | 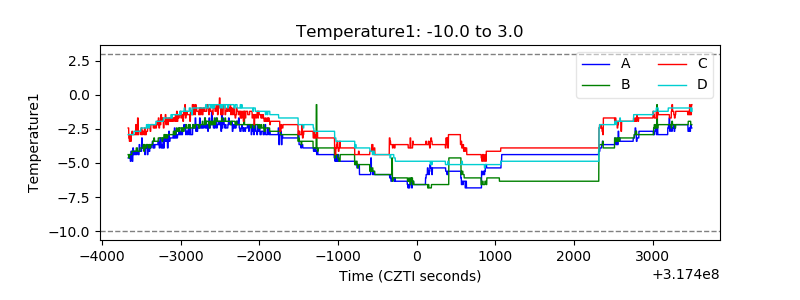 |
| Veto HV Monitor | 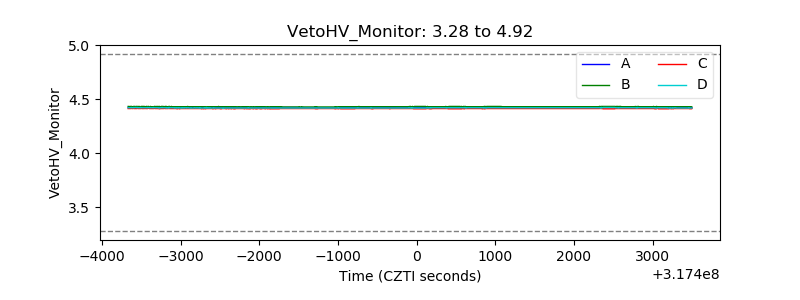 |
| Veto LLD | 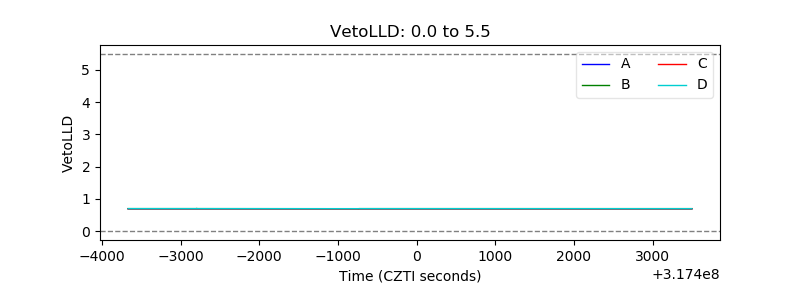 |
| Alpha Counter | 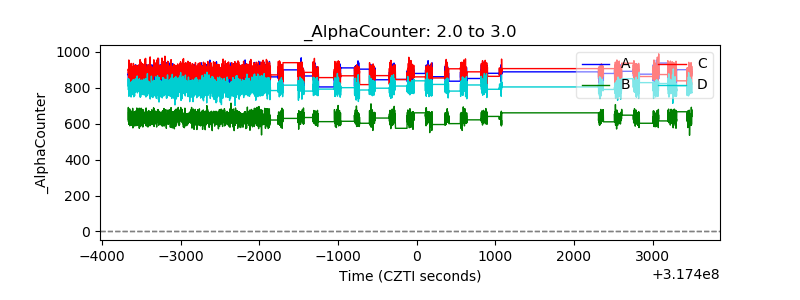 |
| _CPM_Rate |  |
| CZT Counter | 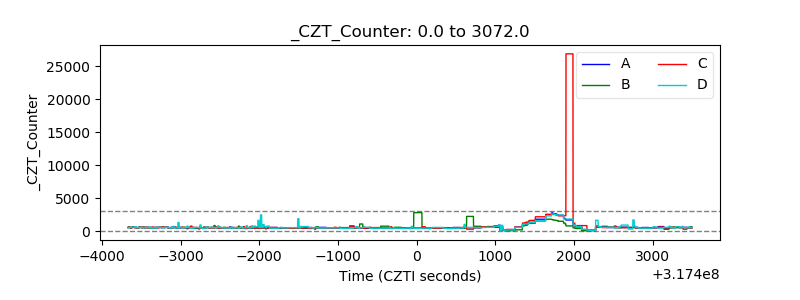 |
| +2.5 Volts monitor |  |
| +5 Volts monitor |  |
| _ROLL_ROT | 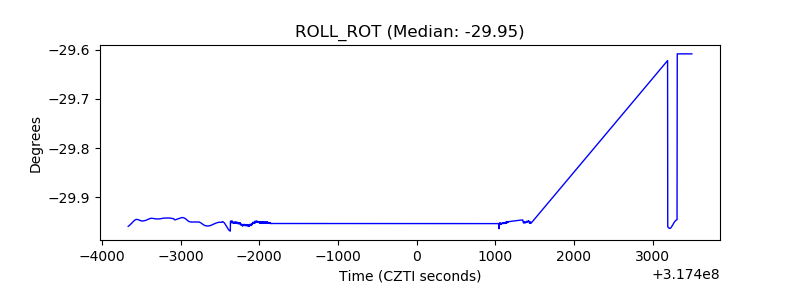 |
| _Roll_DEC | 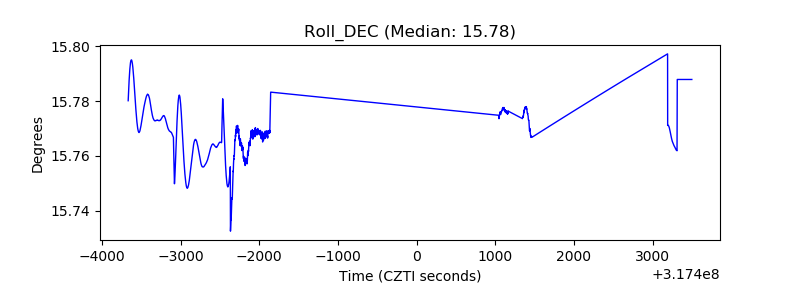 |
| _Roll_RA | 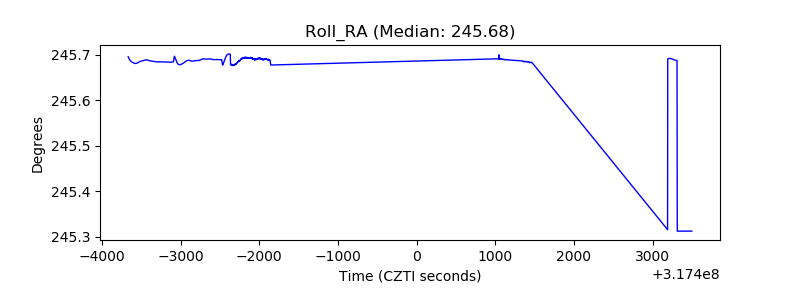 |
| Veto Counter | 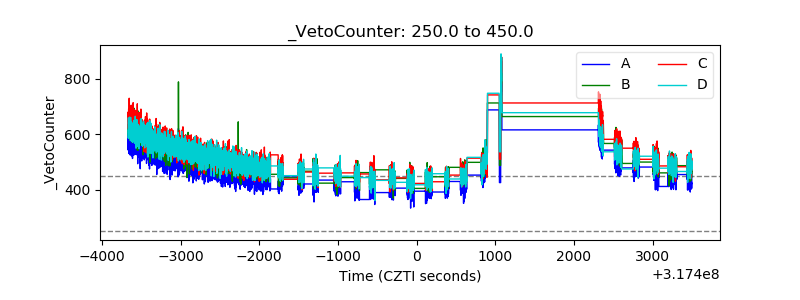 |