| Param | Original file | Final file |
|---|---|---|
| Filename | modeM0/AS1A07_135T02_9000003450_23350cztM0_level2.evt | modeM0/AS1A07_135T02_9000003450_23350cztM0_level2_quad_clean.evt |
| Size (bytes) | 820,540,800 | 118,837,440 |
| Size | 782.5 MB | 113.3 MB |
| Events in quadrant A | 5,409,659 | 721,784 |
| Events in quadrant B | 5,950,584 | 718,021 |
| Events in quadrant C | 5,597,932 | 719,492 |
| Events in quadrant D | 7,170,416 | 700,529 |
| Mode M9 | |||
|---|---|---|---|
| Quadrant | BADHDUFLAG | Total packets | Discarded packets |
| A | 0 | 19 | 0 |
| B | 0 | 19 | 0 |
| C | 0 | 19 | 0 |
| D | 0 | 19 | 0 |
| Mode M0 | |||
|---|---|---|---|
| Quadrant | BADHDUFLAG | Total packets | Discarded packets |
| A | 0 | 22383 | 3 |
| B | 0 | 23889 | 3 |
| C | 0 | 22653 | 3 |
| D | 0 | 28316 | 7 |
| Mode SS | |||
|---|---|---|---|
| Quadrant | BADHDUFLAG | Total packets | Discarded packets |
| A | 0 | 218 | 0 |
| B | 0 | 218 | 0 |
| C | 0 | 218 | 0 |
| D | 0 | 218 | 0 |
| Quadrant | Total seconds | Saturated seconds | Saturation percentage |
|---|---|---|---|
| A | 10656 | 181 | 1.698574% |
| B | 10657 | 376 | 3.528197% |
| C | 10657 | 235 | 2.205123% |
| D | 10656 | 272 | 2.552553% |
Noise dominated data is calculated using 1-second bins in cleaned event files. If a bin has >2000 counts, and if more than 50% of those come from <1% of pixels, then it is considered to be noise-dominated and hence unusable.
| Quadrant | # 1 sec bins | Bins with >0 counts | Bins with >2000 counts | High rate bins dominated by noise | Noise dominated (total time) | Noise dominated (detector-on time) | Marked lightcurve |
|---|---|---|---|---|---|---|---|
| A | 12711 | 10656 | 1 | 1 | 0.01% | 0.01% | 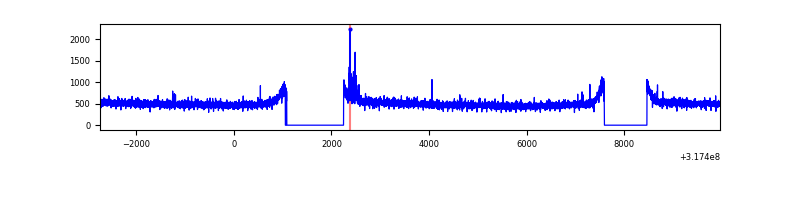 |
| B | 12712 | 10658 | 179 | 179 | 1.41% | 1.68% | 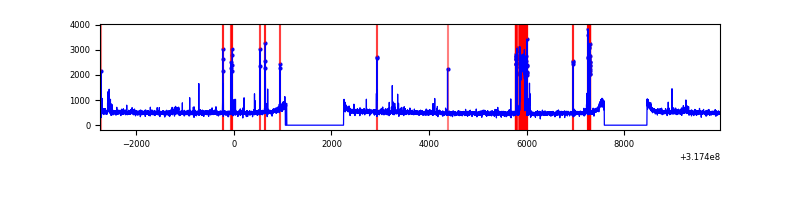 |
| C | 12712 | 10657 | 1 | 1 | 0.01% | 0.01% | 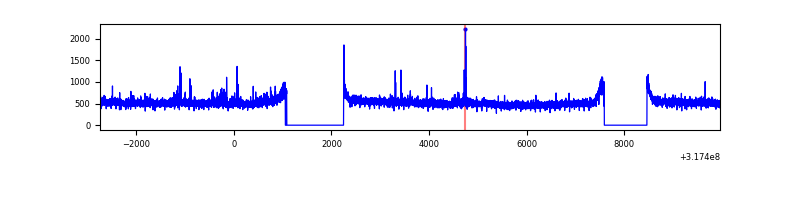 |
| D | 12711 | 10657 | 112 | 112 | 0.88% | 1.05% | 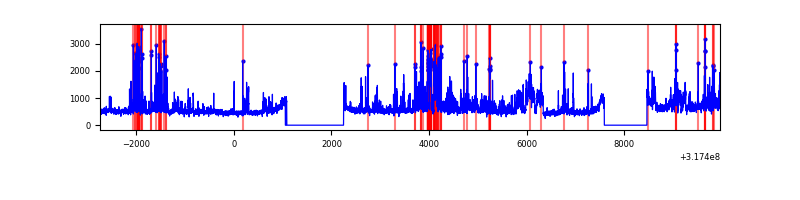 |
Top three noisy pixels from each quadrant. If the there are fewer than three noisy pixels in the level2.evt file, extra rows are filled as -1
| Pixel properties | Quadrant properties | ||||||
|---|---|---|---|---|---|---|---|
| Quadrant | DetID | PixID | Counts | Sigma | Mean | Median | Sigma |
| A | 15 | 174 | 54557 | 190.25 | 1389 | 1360 | 279.6 |
| A | 13 | 254 | 16080 | 52.64 | 1389 | 1360 | 279.6 |
| A | 0 | 226 | 12074 | 38.32 | 1389 | 1360 | 279.6 |
| B | 0 | 245 | 366450 | 1419.5 | 1362 | 1330 | 257.2 |
| B | 5 | 172 | 131020 | 504.21 | 1362 | 1330 | 257.2 |
| B | 0 | 190 | 38009 | 142.6 | 1362 | 1330 | 257.2 |
| C | 14 | 238 | 210709 | 666.53 | 1342 | 1352 | 314.1 |
| C | 7 | 247 | 62246 | 193.87 | 1342 | 1352 | 314.1 |
| C | 2 | 16 | 58671 | 182.49 | 1342 | 1352 | 314.1 |
| D | 1 | 52 | 1504084 | 4577.01 | 1359 | 1325 | 328.3 |
| D | 13 | 249 | 168709 | 509.81 | 1359 | 1325 | 328.3 |
| D | 9 | 85 | 130442 | 393.26 | 1359 | 1325 | 328.3 |
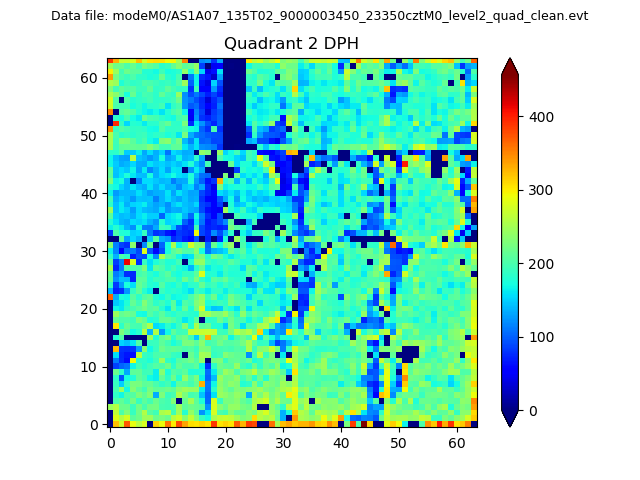
Histogram calculated using DETX and DETY for each event in the final _common_clean file
| Quadrant A | 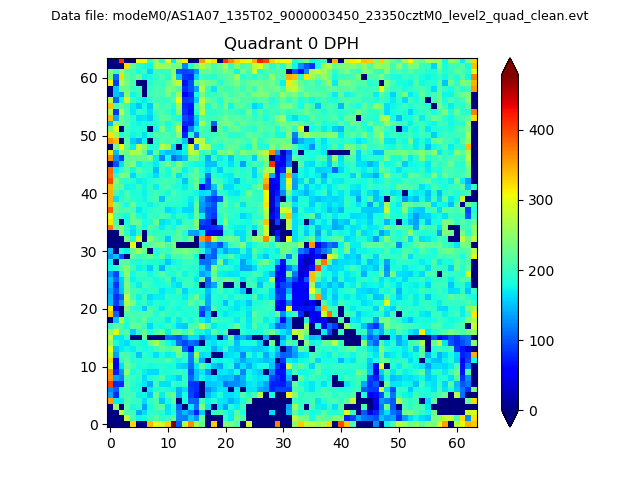 |
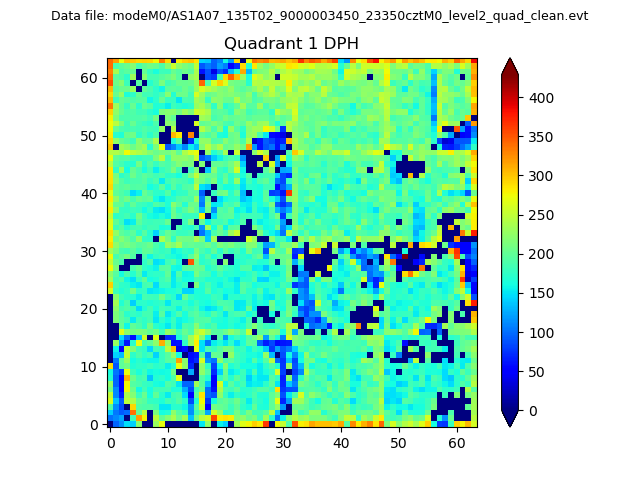 |
Quadrant B |
|---|---|---|---|
| Quadrant D | 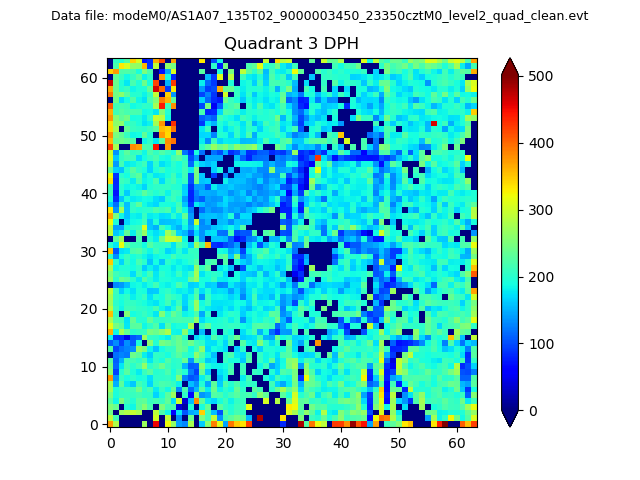 |
 |
Quadrant C |
| Plot type | Count rate plots | Images |
|---|---|---|
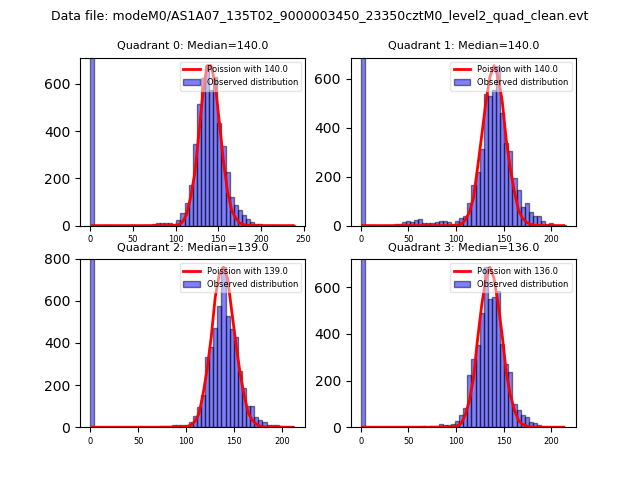
| Comparison with Poisson distribution Blue bars denote a histogram of data divided into 1 sec bins. Red curve is a Poisson curve with rate = median count rate of data. |
 |
 |
| Quadrant-wise count rates Data is divided into 100 sec bins |
 |
|
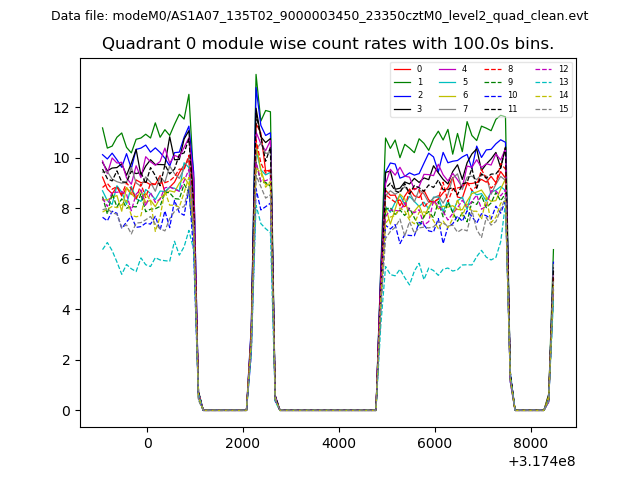
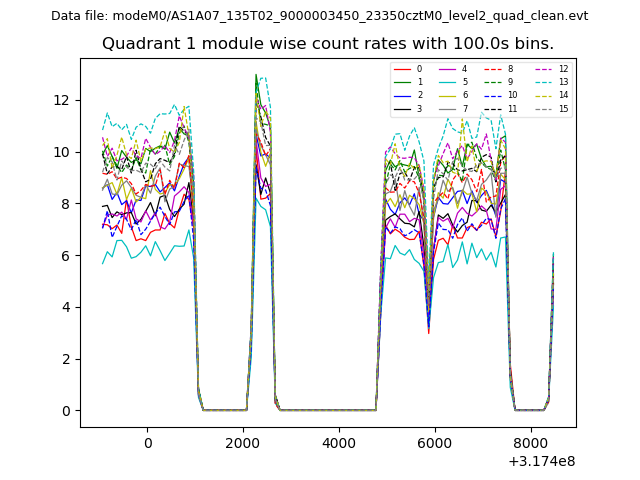
| Module-wise count rates for Quadrant A Data is divided into 100 sec bins |
 |
 |
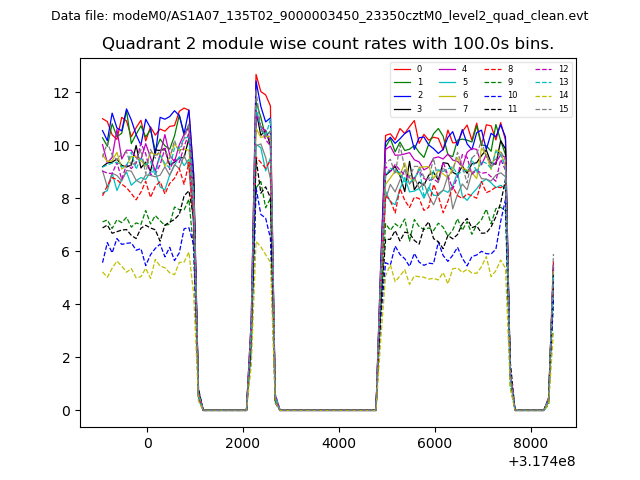
| Module-wise count rates for Quadrant B Data is divided into 100 sec bins |
 |
 |
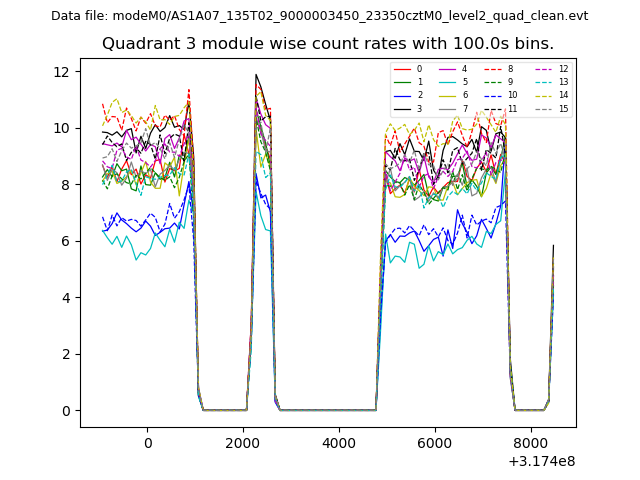
| Module-wise count rates for Quadrant C Data is divided into 100 sec bins |
 |
 |
| Module-wise count rates for Quadrant D Data is divided into 100 sec bins |
 |
 |
| Parameter | Plot |
|---|---|
| CZT HV Monitor | 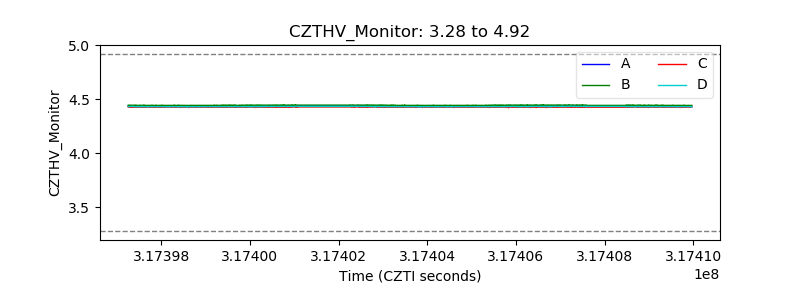 |
| D_VDD | 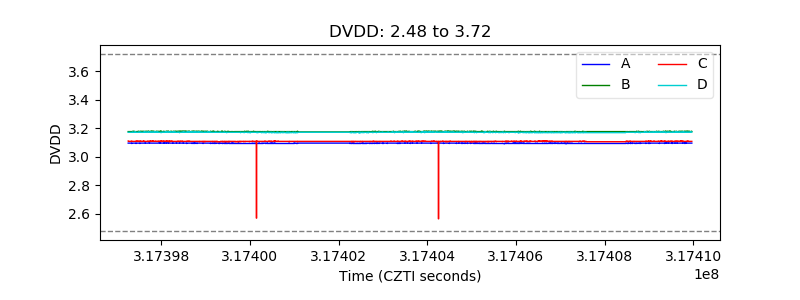 |
| Temperature 1 | 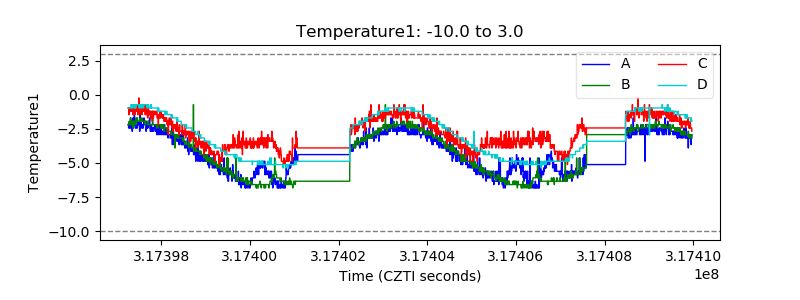 |
| Veto HV Monitor | 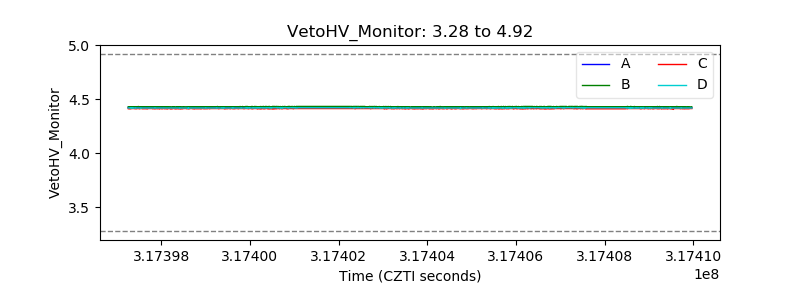 |
| Veto LLD | 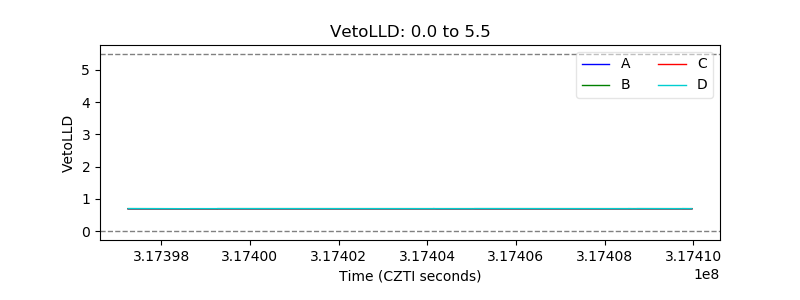 |
| Alpha Counter | 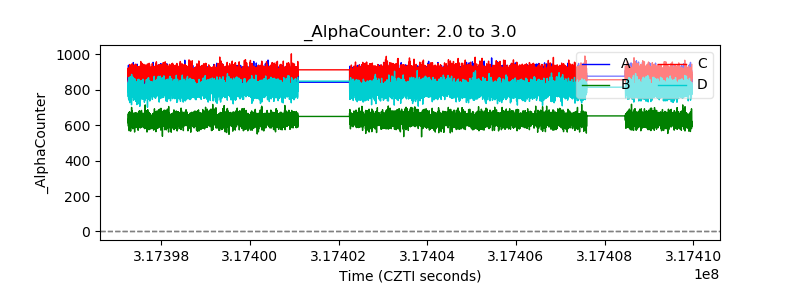 |
| _CPM_Rate | 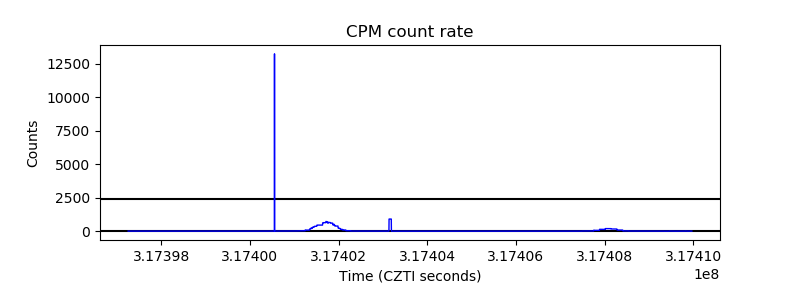 |
| CZT Counter | 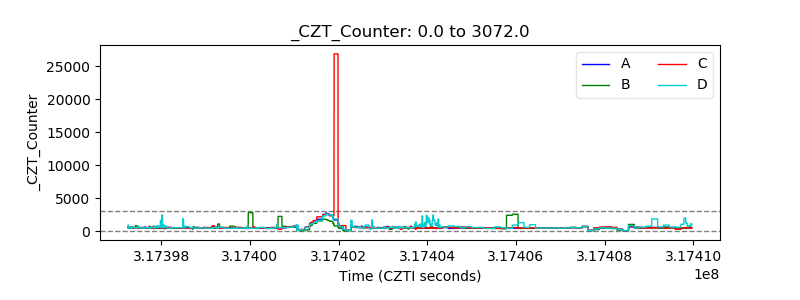 |
| +2.5 Volts monitor | 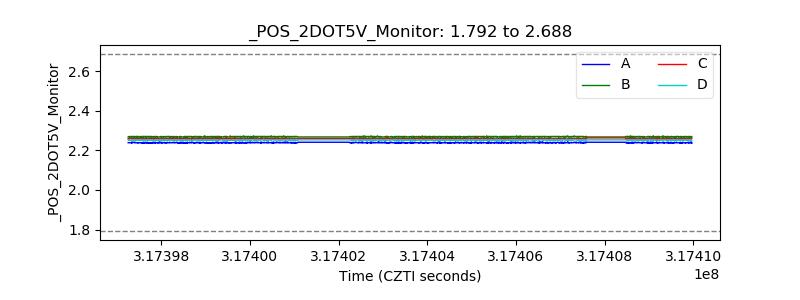 |
| +5 Volts monitor |  |
| _ROLL_ROT | 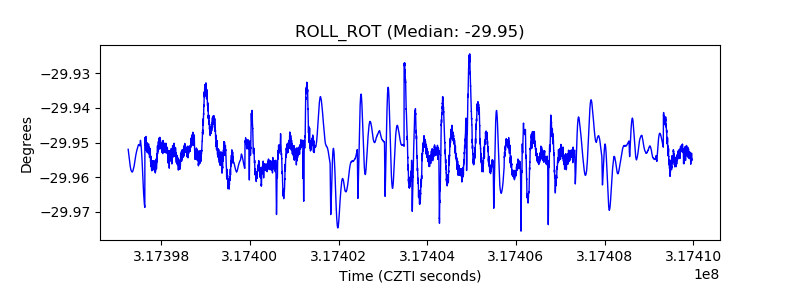 |
| _Roll_DEC | 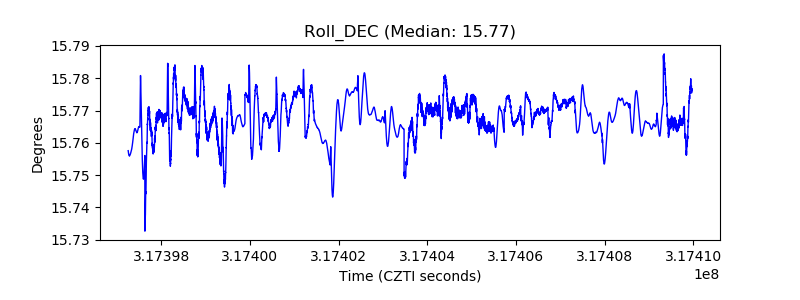 |
| _Roll_RA | 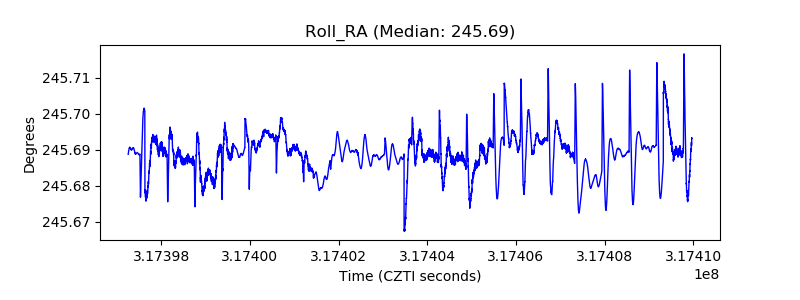 |
| Veto Counter | 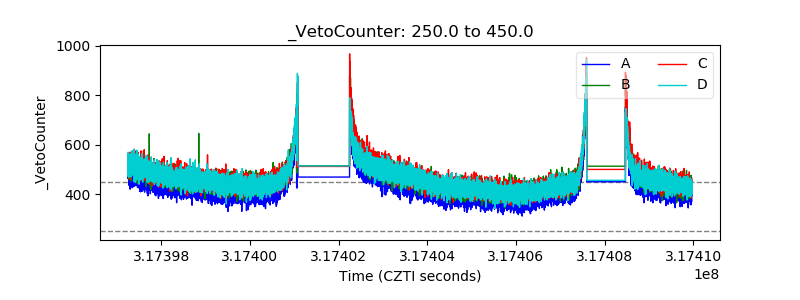 |