| Param | Original file | Final file |
|---|---|---|
| Filename | modeM0/AS1A07_135T02_9000003450_23351cztM0_level2.evt | modeM0/AS1A07_135T02_9000003450_23351cztM0_level2_quad_clean.evt |
| Size (bytes) | 578,784,960 | 76,178,880 |
| Size | 552.0 MB | 72.6 MB |
| Events in quadrant A | 3,528,332 | 455,634 |
| Events in quadrant B | 3,761,644 | 456,413 |
| Events in quadrant C | 4,307,632 | 453,948 |
| Events in quadrant D | 5,445,327 | 441,784 |
| Mode M9 | |||
|---|---|---|---|
| Quadrant | BADHDUFLAG | Total packets | Discarded packets |
| A | 0 | 8 | 0 |
| B | 0 | 9 | 0 |
| C | 0 | 9 | 0 |
| D | 0 | 9 | 0 |
| Mode M0 | |||
|---|---|---|---|
| Quadrant | BADHDUFLAG | Total packets | Discarded packets |
| A | 0 | 14885 | 2 |
| B | 0 | 15514 | 2 |
| C | 0 | 17194 | 2 |
| D | 0 | 21131 | 2 |
| Mode SS | |||
|---|---|---|---|
| Quadrant | BADHDUFLAG | Total packets | Discarded packets |
| A | 0 | 144 | 0 |
| B | 0 | 144 | 0 |
| C | 0 | 144 | 0 |
| D | 0 | 144 | 0 |
| Quadrant | Total seconds | Saturated seconds | Saturation percentage |
|---|---|---|---|
| A | 7169 | 72 | 1.004324% |
| B | 7169 | 182 | 2.538708% |
| C | 7169 | 444 | 6.193332% |
| D | 7169 | 261 | 3.640675% |
Noise dominated data is calculated using 1-second bins in cleaned event files. If a bin has >2000 counts, and if more than 50% of those come from <1% of pixels, then it is considered to be noise-dominated and hence unusable.
| Quadrant | # 1 sec bins | Bins with >0 counts | Bins with >2000 counts | High rate bins dominated by noise | Noise dominated (total time) | Noise dominated (detector-on time) | Marked lightcurve |
|---|---|---|---|---|---|---|---|
| A | 7689 | 7170 | 0 | 0 | 0.00% | 0.00% | 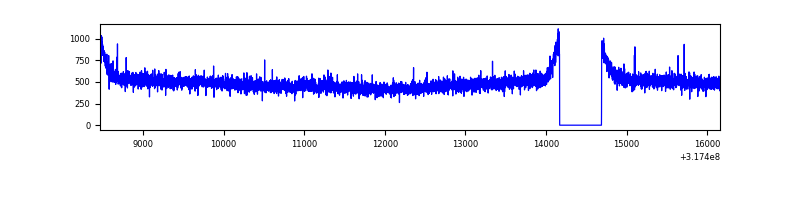 |
| B | 7689 | 7169 | 52 | 52 | 0.68% | 0.73% | 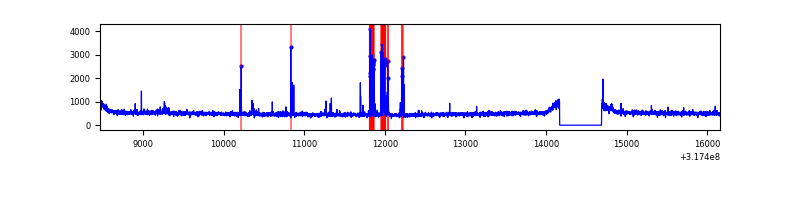 |
| C | 7689 | 7169 | 220 | 220 | 2.86% | 3.07% | 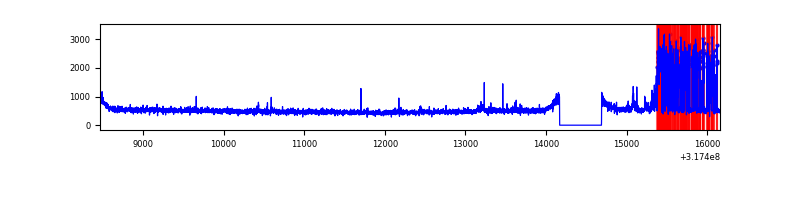 |
| D | 7689 | 7170 | 142 | 142 | 1.85% | 1.98% | 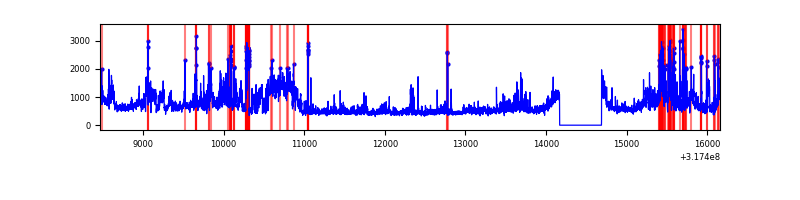 |
Top three noisy pixels from each quadrant. If the there are fewer than three noisy pixels in the level2.evt file, extra rows are filled as -1
| Pixel properties | Quadrant properties | ||||||
|---|---|---|---|---|---|---|---|
| Quadrant | DetID | PixID | Counts | Sigma | Mean | Median | Sigma |
| A | 13 | 254 | 11644 | 57.88 | 913 | 894 | 185.7 |
| A | 15 | 174 | 8283 | 39.78 | 913 | 894 | 185.7 |
| A | 3 | 137 | 8053 | 38.54 | 913 | 894 | 185.7 |
| B | 0 | 245 | 177750 | 1014.87 | 901 | 879 | 174.3 |
| B | 0 | 190 | 24561 | 135.89 | 901 | 879 | 174.3 |
| B | 12 | 111 | 21060 | 115.8 | 901 | 879 | 174.3 |
| C | 0 | 239 | 732357 | 3586.16 | 867 | 872 | 204.0 |
| C | 14 | 238 | 135608 | 660.55 | 867 | 872 | 204.0 |
| C | 7 | 247 | 33527 | 160.09 | 867 | 872 | 204.0 |
| D | 1 | 52 | 1606753 | 7411.01 | 886 | 859 | 216.7 |
| D | 13 | 249 | 208757 | 959.43 | 886 | 859 | 216.7 |
| D | 9 | 85 | 104950 | 480.37 | 886 | 859 | 216.7 |
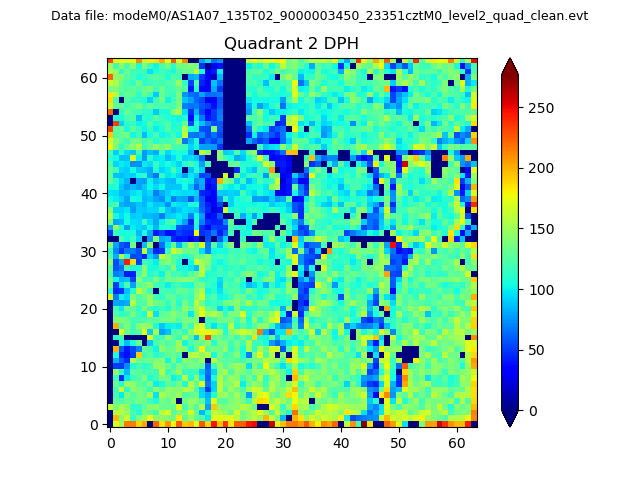
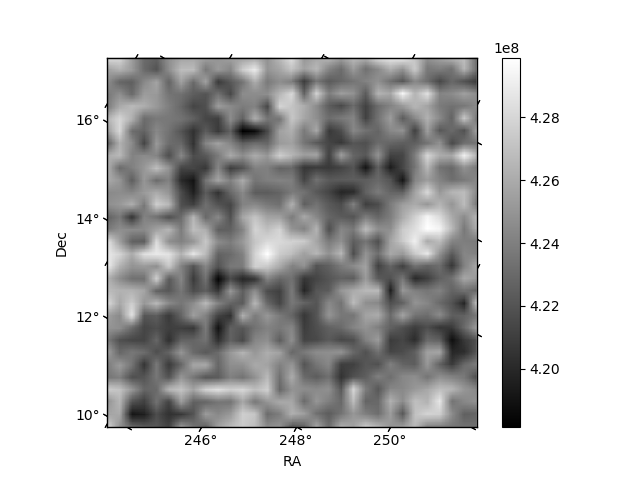
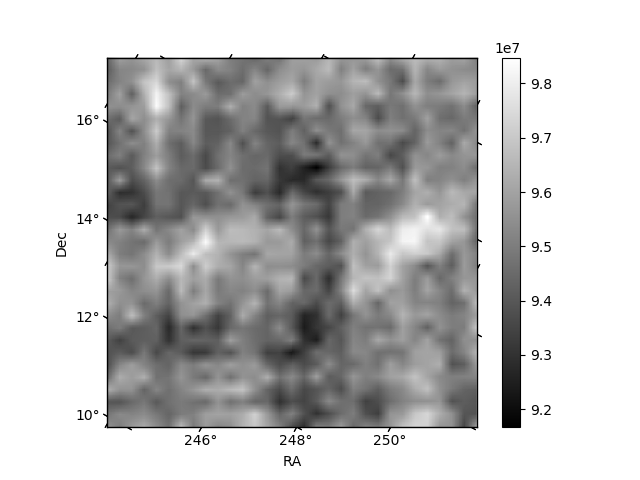
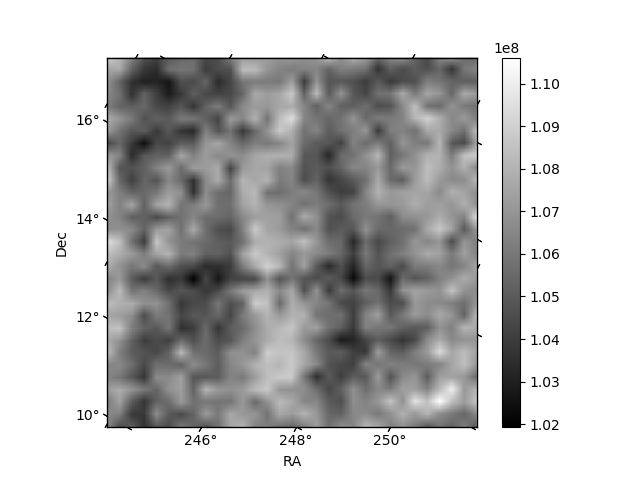
Histogram calculated using DETX and DETY for each event in the final _common_clean file
| Quadrant A | 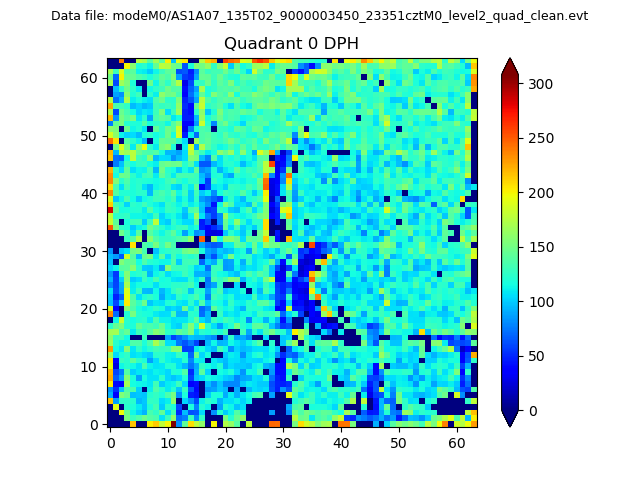 |
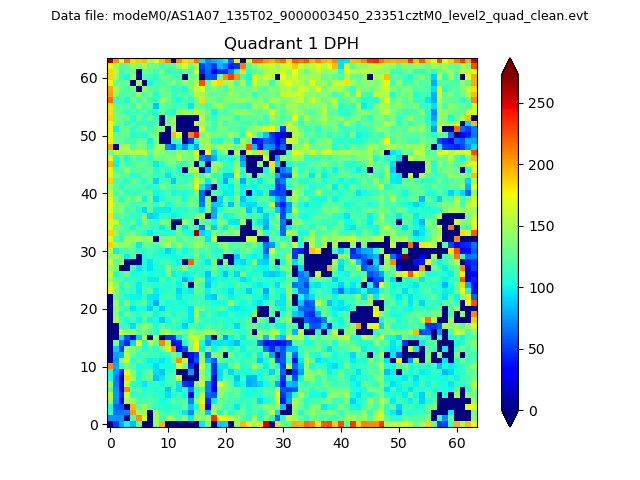 |
Quadrant B |
|---|---|---|---|
| Quadrant D | 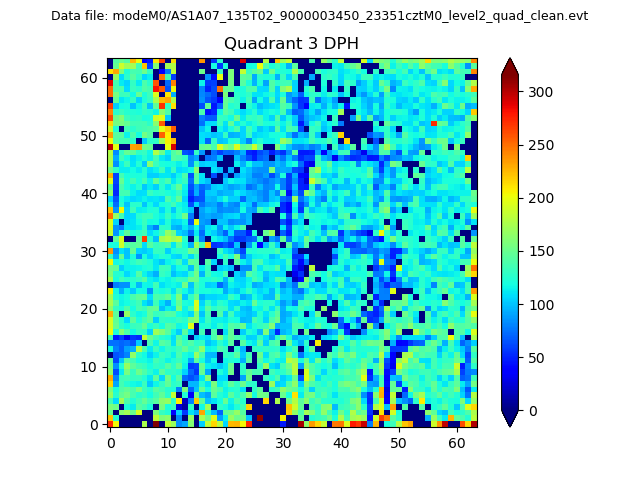 |
 |
Quadrant C |
| Plot type | Count rate plots | Images |
|---|---|---|
| Comparison with Poisson distribution Blue bars denote a histogram of data divided into 1 sec bins. Red curve is a Poisson curve with rate = median count rate of data. |
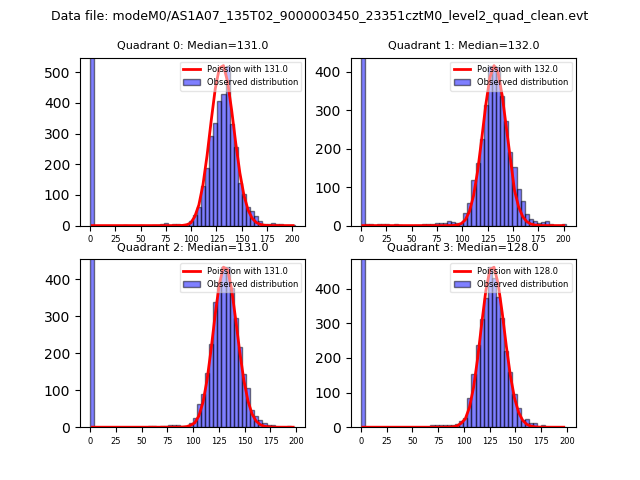 |
 |
| Quadrant-wise count rates Data is divided into 100 sec bins |
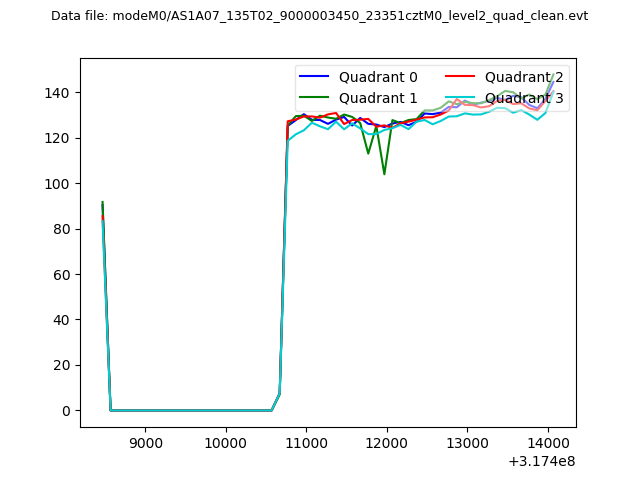 |
|
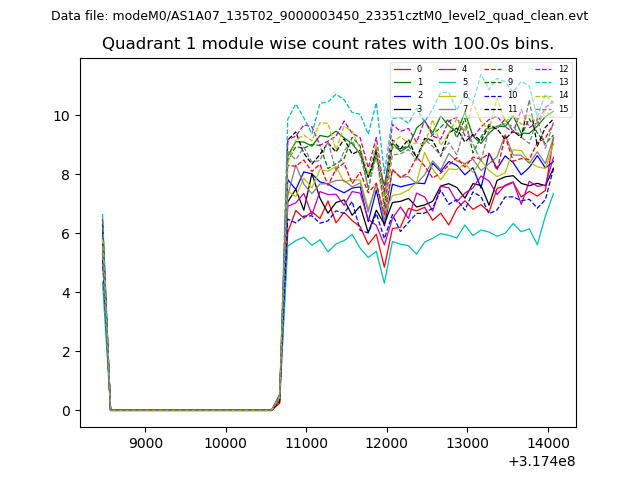
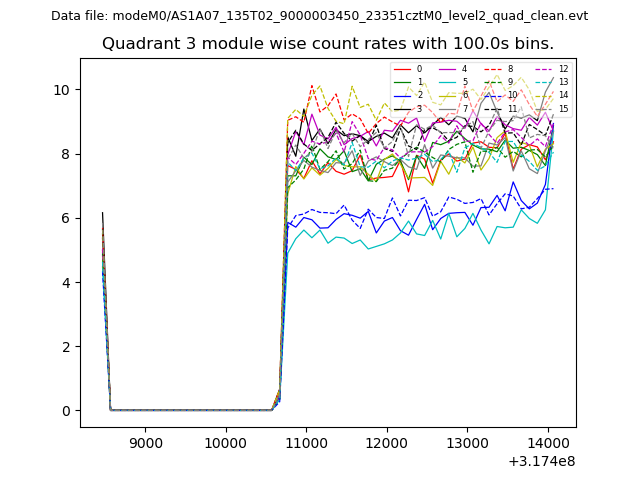
| Module-wise count rates for Quadrant A Data is divided into 100 sec bins |
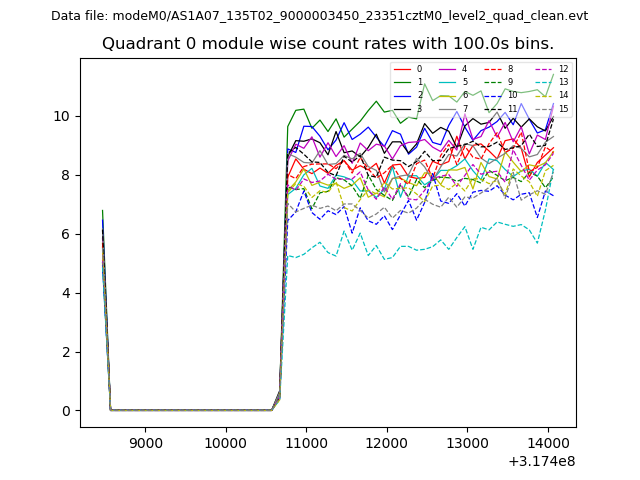 |
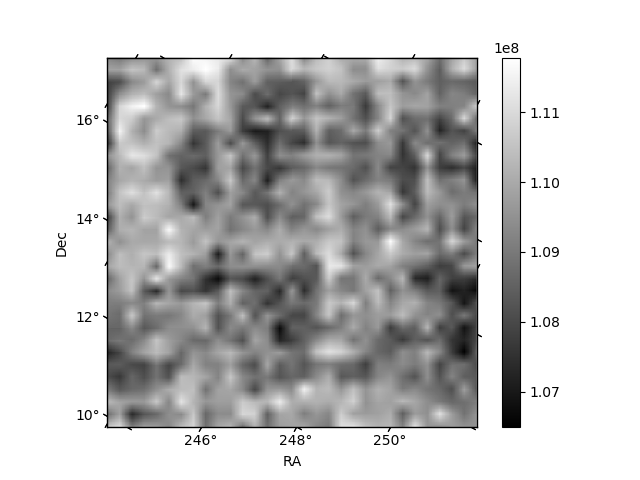 |
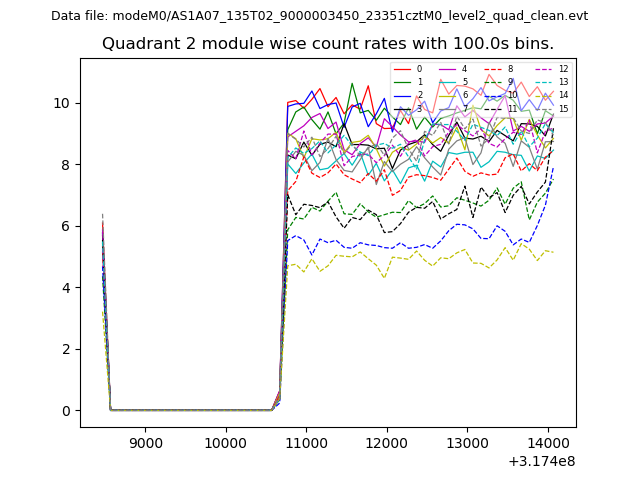
| Module-wise count rates for Quadrant B Data is divided into 100 sec bins |
 |
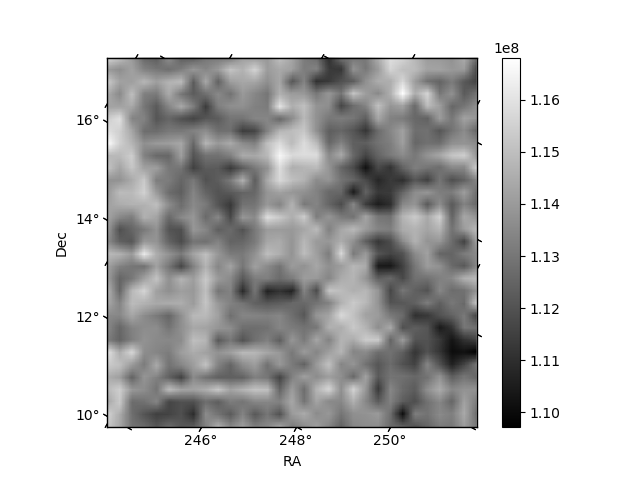 |
| Module-wise count rates for Quadrant C Data is divided into 100 sec bins |
 |
 |
| Module-wise count rates for Quadrant D Data is divided into 100 sec bins |
 |
 |
| Parameter | Plot |
|---|---|
| CZT HV Monitor |  |
| D_VDD | 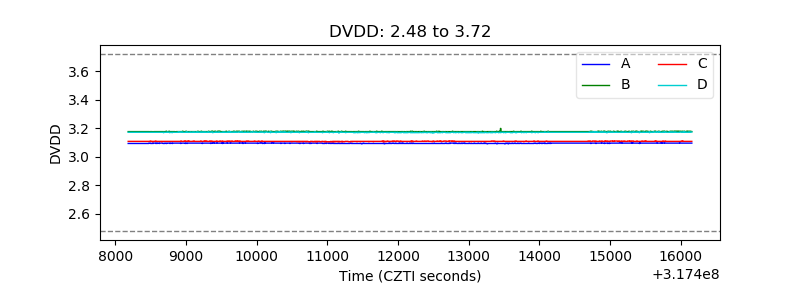 |
| Temperature 1 | 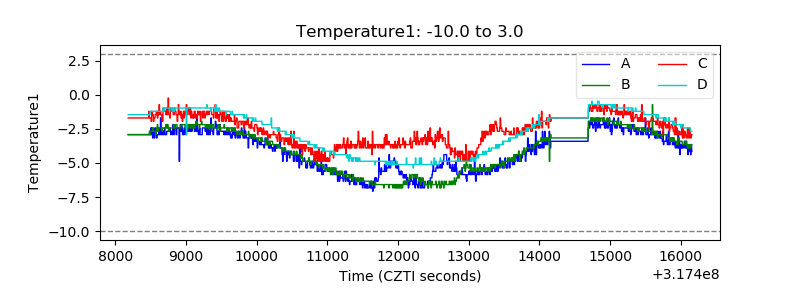 |
| Veto HV Monitor | 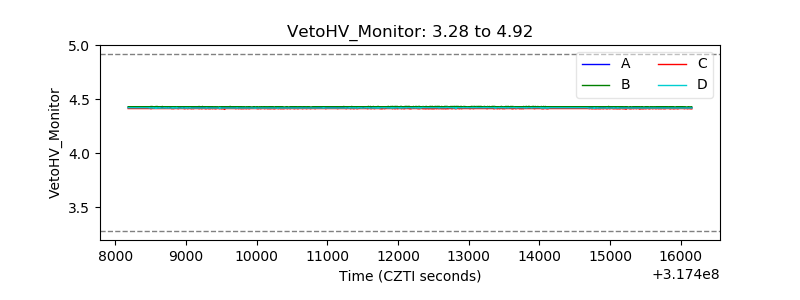 |
| Veto LLD | 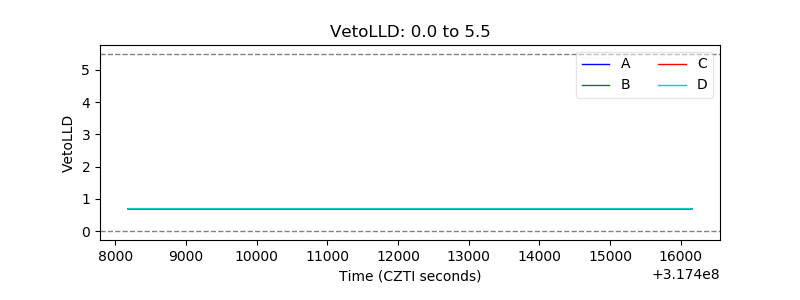 |
| Alpha Counter | 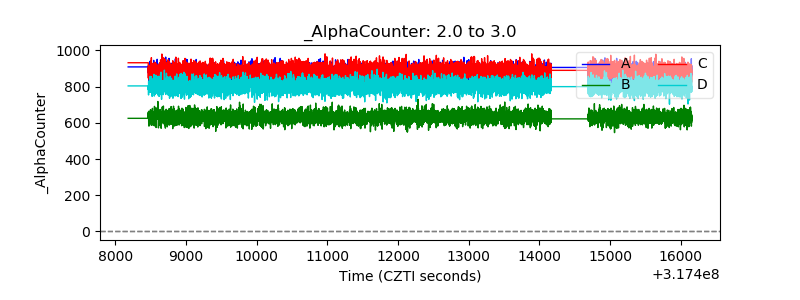 |
| _CPM_Rate |  |
| CZT Counter | 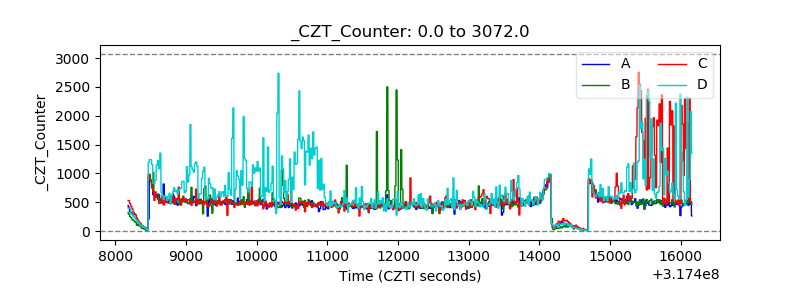 |
| +2.5 Volts monitor |  |
| +5 Volts monitor |  |
| _ROLL_ROT | 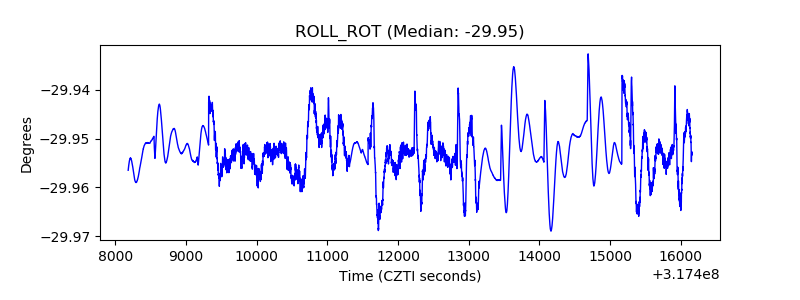 |
| _Roll_DEC | 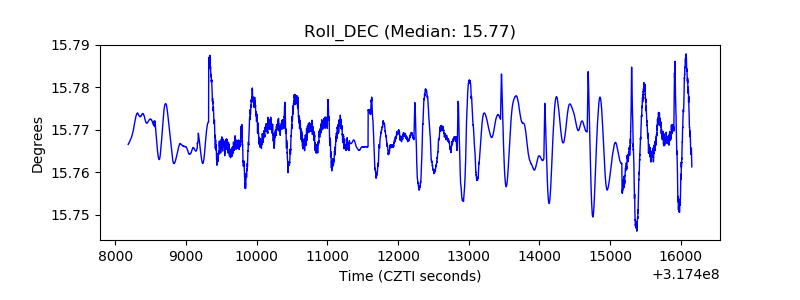 |
| _Roll_RA | 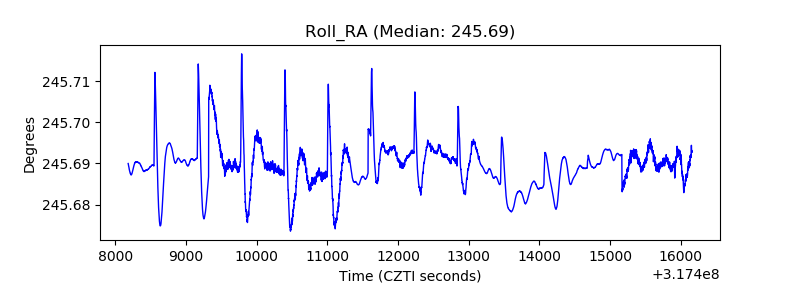 |
| Veto Counter | 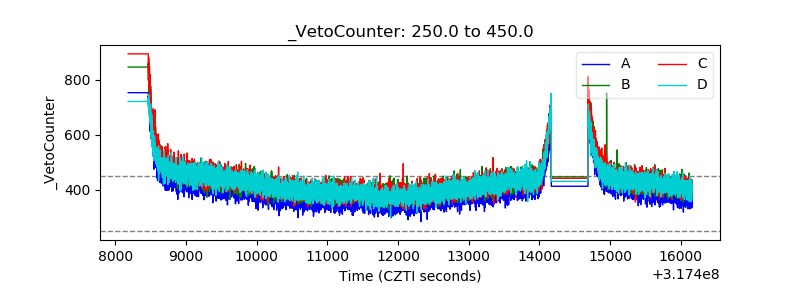 |