| Param | Original file | Final file |
|---|---|---|
| Filename | modeM0/AS1A07_135T02_9000003450_23352cztM0_level2.evt | modeM0/AS1A07_135T02_9000003450_23352cztM0_level2_quad_clean.evt |
| Size (bytes) | 744,658,560 | 77,209,920 |
| Size | 710.2 MB | 73.6 MB |
| Events in quadrant A | 3,482,029 | 467,319 |
| Events in quadrant B | 3,569,687 | 473,919 |
| Events in quadrant C | 7,573,525 | 443,372 |
| Events in quadrant D | 7,434,212 | 445,669 |
| Mode M9 | |||
|---|---|---|---|
| Quadrant | BADHDUFLAG | Total packets | Discarded packets |
| A | 0 | 3 | 0 |
| B | 0 | 3 | 0 |
| C | 0 | 3 | 0 |
| D | 0 | 3 | 0 |
| Mode M0 | |||
|---|---|---|---|
| Quadrant | BADHDUFLAG | Total packets | Discarded packets |
| A | 0 | 14957 | 1 |
| B | 0 | 15133 | 1 |
| C | 0 | 27284 | 1 |
| D | 0 | 27150 | 1 |
| Mode SS | |||
|---|---|---|---|
| Quadrant | BADHDUFLAG | Total packets | Discarded packets |
| A | 0 | 148 | 0 |
| B | 0 | 148 | 0 |
| C | 0 | 148 | 0 |
| D | 0 | 148 | 0 |
| Quadrant | Total seconds | Saturated seconds | Saturation percentage |
|---|---|---|---|
| A | 7288 | 39 | 0.535126% |
| B | 7287 | 77 | 1.056676% |
| C | 7288 | 1485 | 20.375960% |
| D | 7288 | 904 | 12.403952% |
Noise dominated data is calculated using 1-second bins in cleaned event files. If a bin has >2000 counts, and if more than 50% of those come from <1% of pixels, then it is considered to be noise-dominated and hence unusable.
| Quadrant | # 1 sec bins | Bins with >0 counts | Bins with >2000 counts | High rate bins dominated by noise | Noise dominated (total time) | Noise dominated (detector-on time) | Marked lightcurve |
|---|---|---|---|---|---|---|---|
| A | 7598 | 7289 | 0 | 0 | 0.00% | 0.00% | 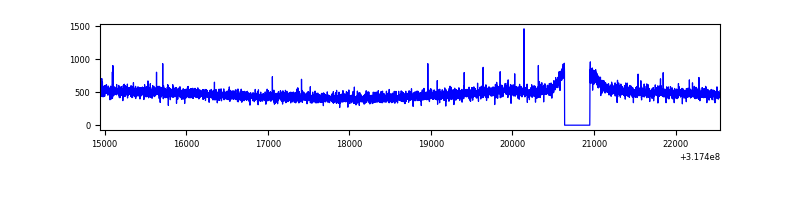 |
| B | 7597 | 7288 | 5 | 5 | 0.07% | 0.07% | 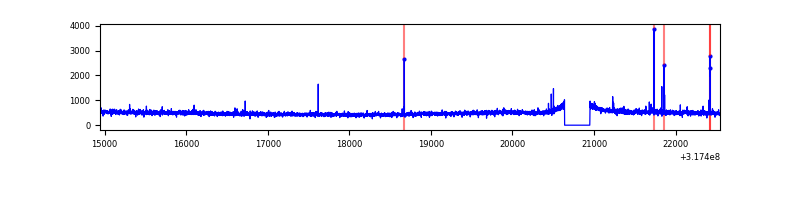 |
| C | 7598 | 7288 | 1013 | 1013 | 13.33% | 13.90% | 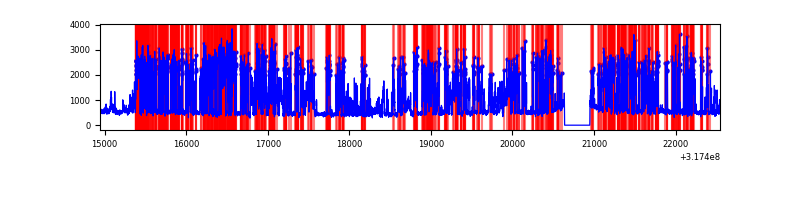 |
| D | 7598 | 7289 | 627 | 627 | 8.25% | 8.60% | 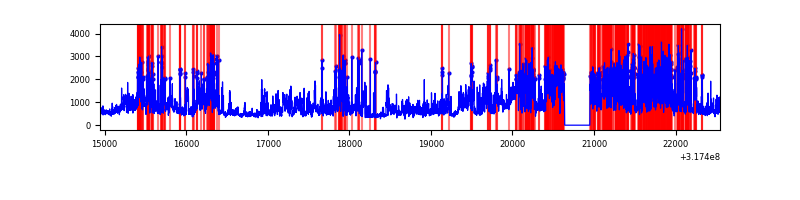 |
Top three noisy pixels from each quadrant. If the there are fewer than three noisy pixels in the level2.evt file, extra rows are filled as -1
| Pixel properties | Quadrant properties | ||||||
|---|---|---|---|---|---|---|---|
| Quadrant | DetID | PixID | Counts | Sigma | Mean | Median | Sigma |
| A | 13 | 254 | 11236 | 56.34 | 901 | 880 | 183.8 |
| A | 3 | 137 | 8025 | 38.87 | 901 | 880 | 183.8 |
| A | 0 | 226 | 7816 | 37.73 | 901 | 880 | 183.8 |
| B | 12 | 111 | 21025 | 116.49 | 895 | 874 | 173.0 |
| B | 0 | 190 | 20774 | 115.03 | 895 | 874 | 173.0 |
| B | 11 | 111 | 18715 | 103.13 | 895 | 874 | 173.0 |
| C | 0 | 239 | 4110754 | 21313.67 | 816 | 820 | 192.8 |
| C | 14 | 238 | 126760 | 653.11 | 816 | 820 | 192.8 |
| C | 0 | 207 | 91194 | 468.67 | 816 | 820 | 192.8 |
| D | 1 | 52 | 3516278 | 16786.15 | 846 | 820 | 209.4 |
| D | 13 | 249 | 245714 | 1169.36 | 846 | 820 | 209.4 |
| D | 9 | 85 | 178393 | 847.9 | 846 | 820 | 209.4 |
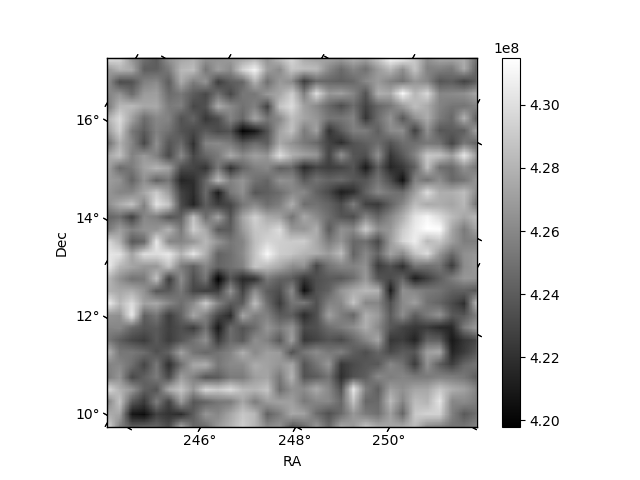
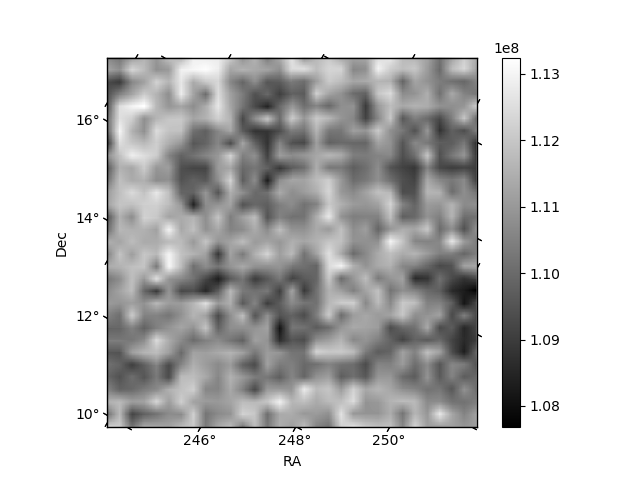
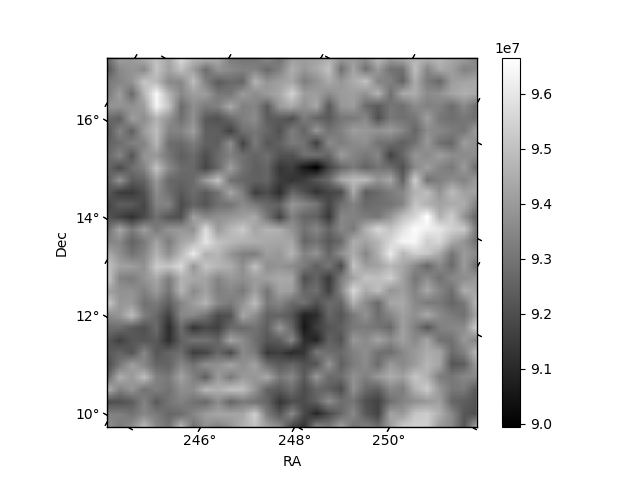
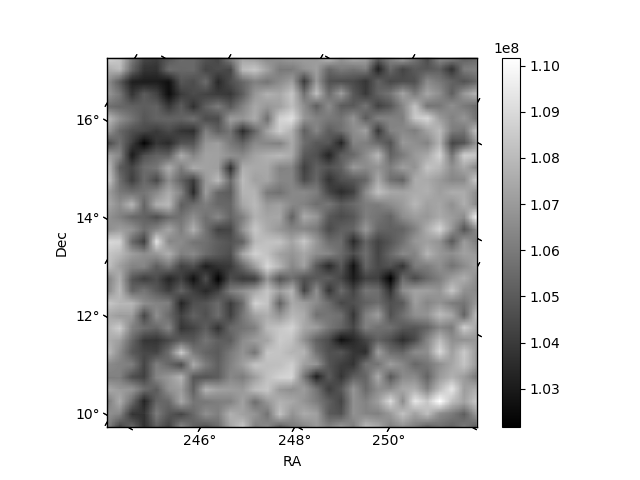
Histogram calculated using DETX and DETY for each event in the final _common_clean file
| Quadrant A | 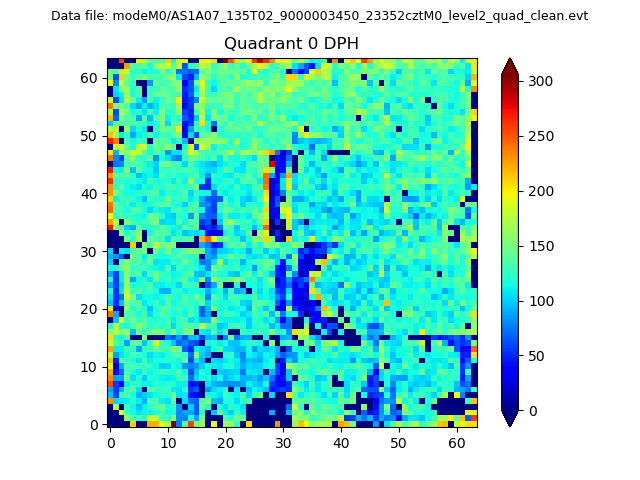 |
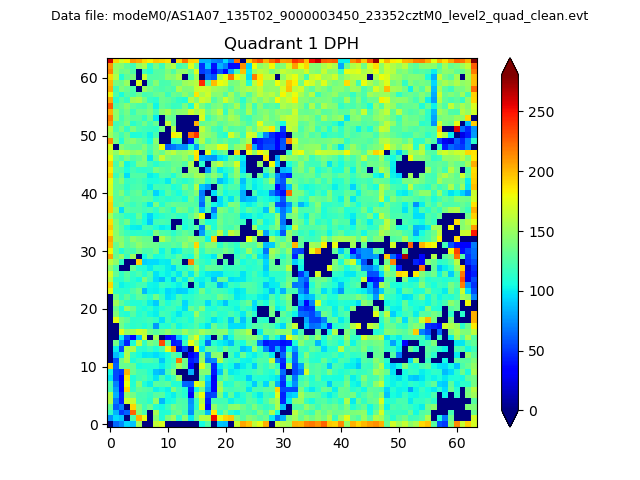 |
Quadrant B |
|---|---|---|---|
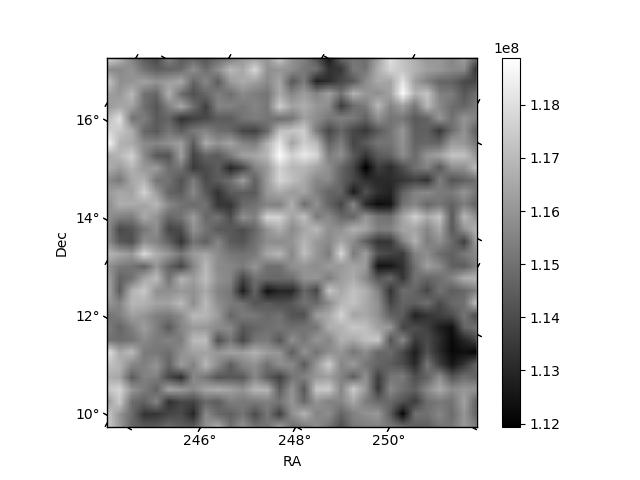
| Quadrant D | 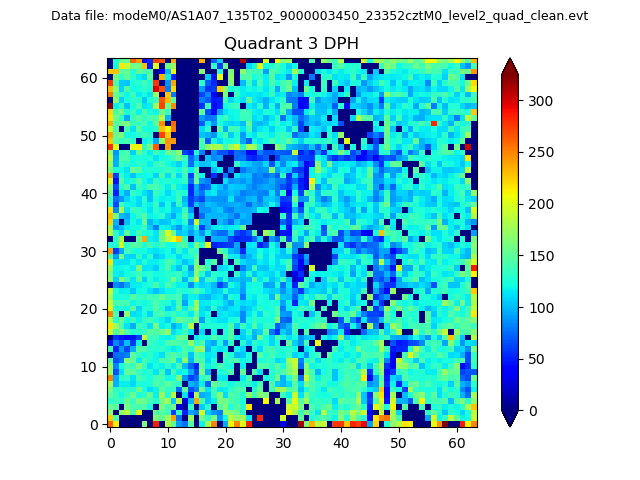 |
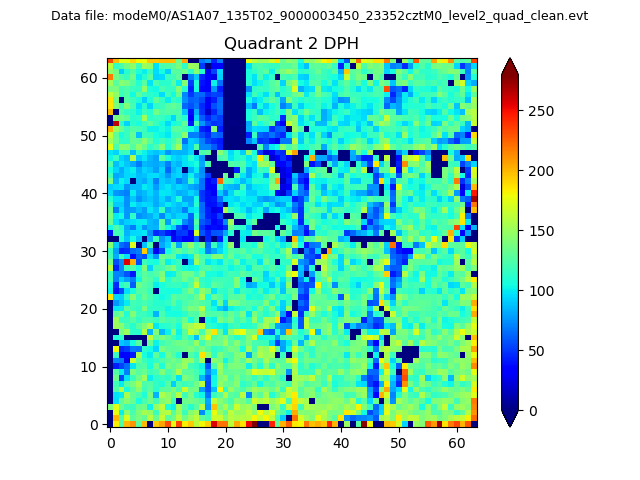 |
Quadrant C |
| Plot type | Count rate plots | Images |
|---|---|---|
| Comparison with Poisson distribution Blue bars denote a histogram of data divided into 1 sec bins. Red curve is a Poisson curve with rate = median count rate of data. |
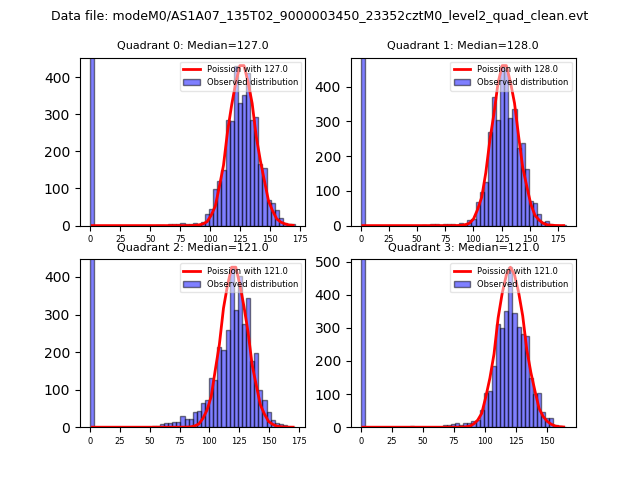 |
 |
| Quadrant-wise count rates Data is divided into 100 sec bins |
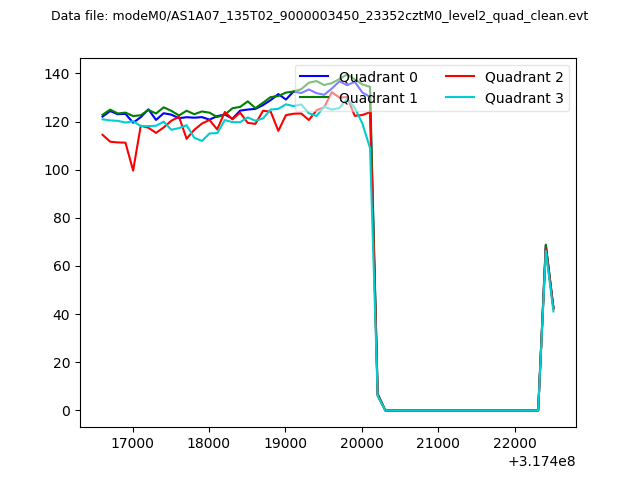 |
|
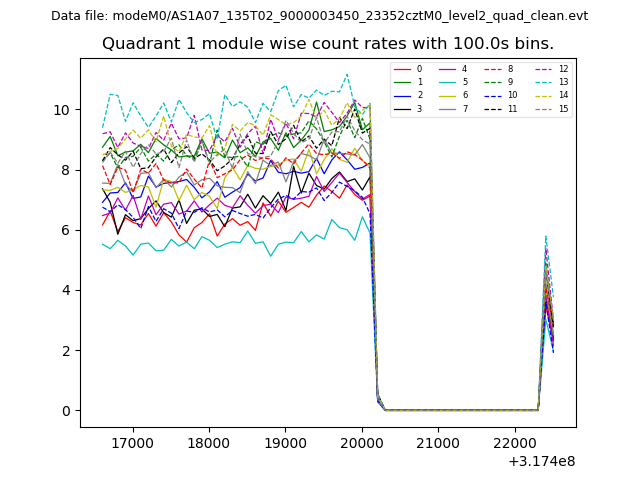
| Module-wise count rates for Quadrant A Data is divided into 100 sec bins |
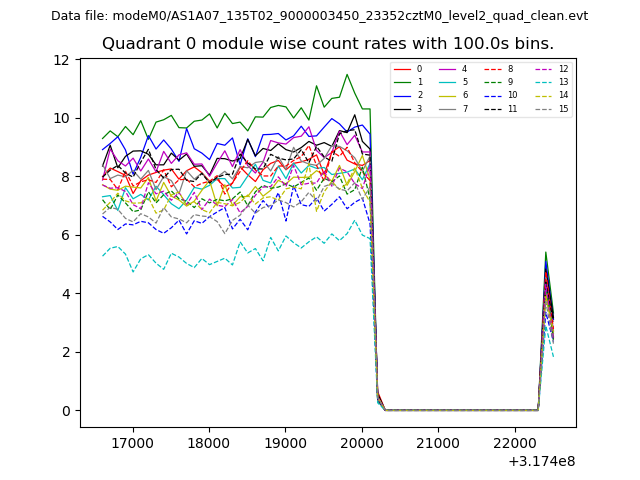 |
 |
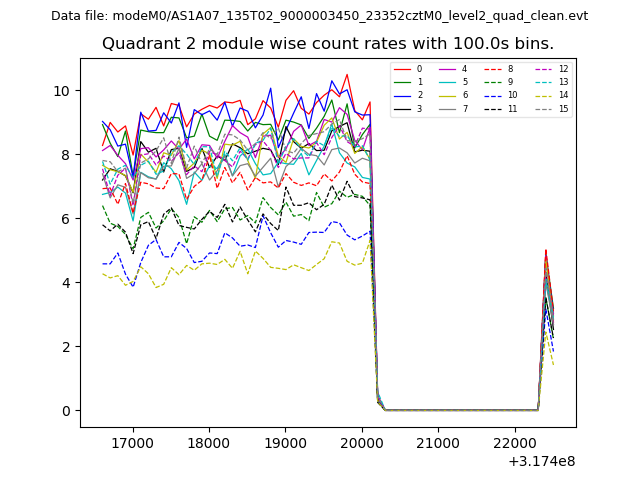
| Module-wise count rates for Quadrant B Data is divided into 100 sec bins |
 |
 |
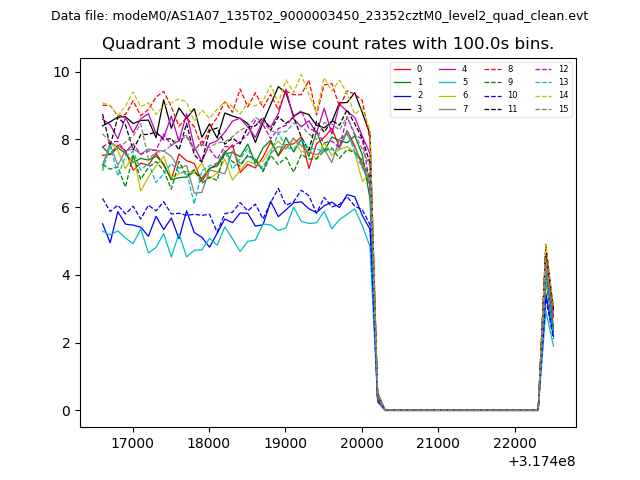
| Module-wise count rates for Quadrant C Data is divided into 100 sec bins |
 |
 |
| Module-wise count rates for Quadrant D Data is divided into 100 sec bins |
 |
 |
| Parameter | Plot |
|---|---|
| CZT HV Monitor | 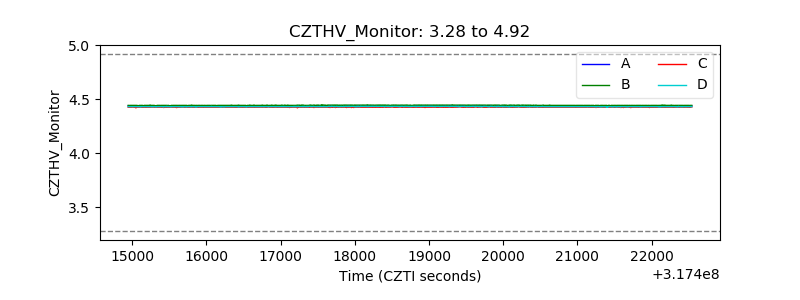 |
| D_VDD | 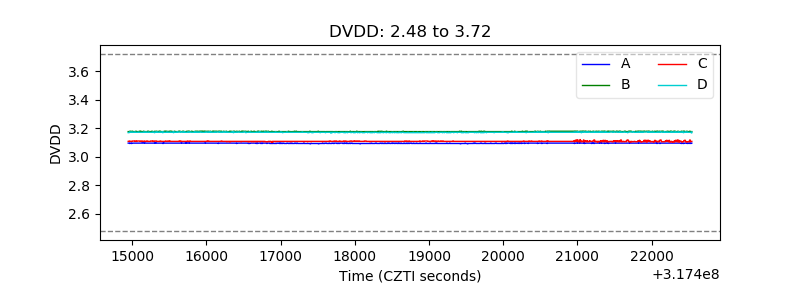 |
| Temperature 1 | 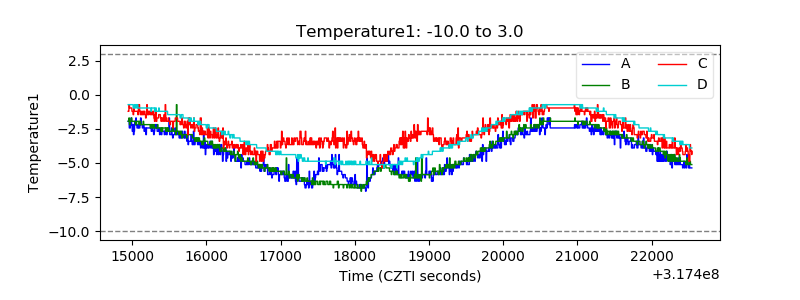 |
| Veto HV Monitor | 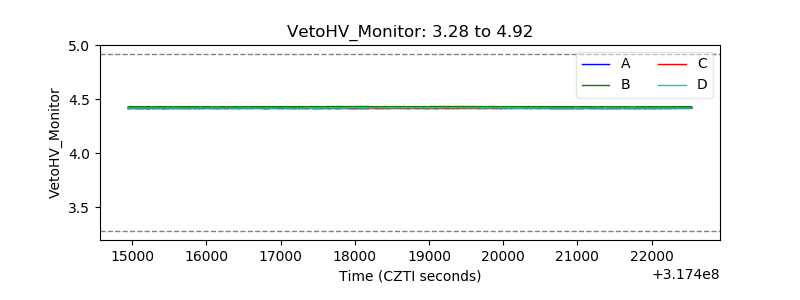 |
| Veto LLD | 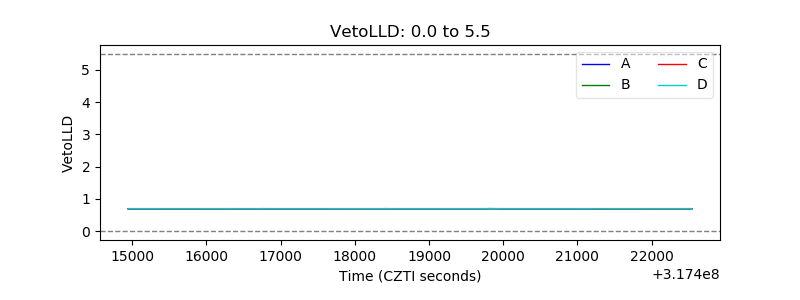 |
| Alpha Counter | 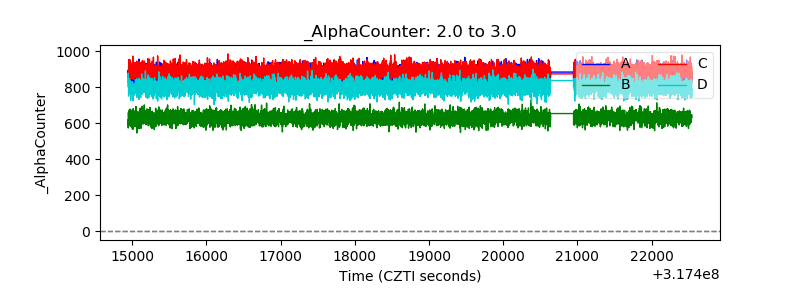 |
| _CPM_Rate | 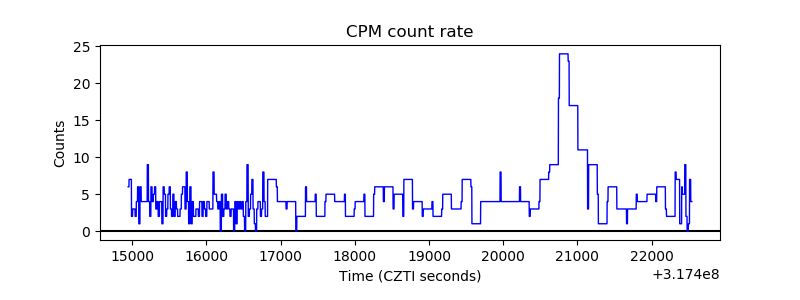 |
| CZT Counter | 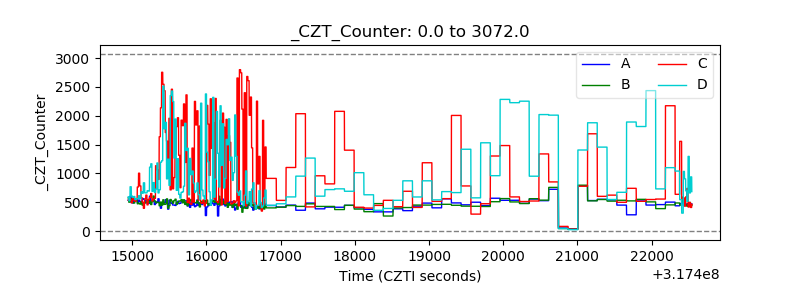 |
| +2.5 Volts monitor | 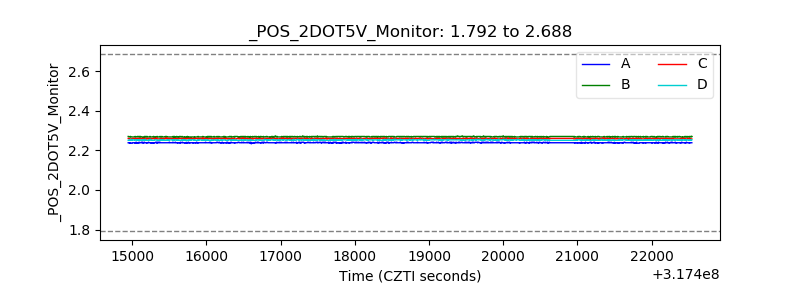 |
| +5 Volts monitor |  |
| _ROLL_ROT | 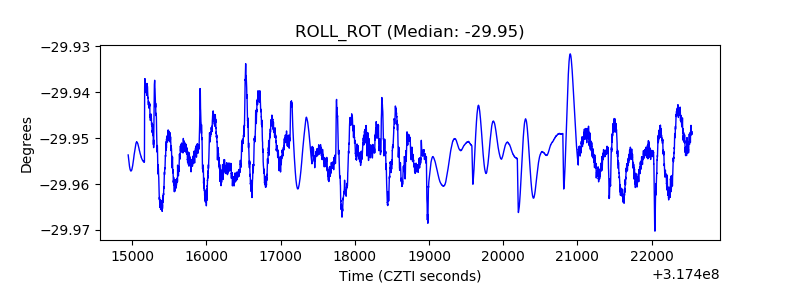 |
| _Roll_DEC | 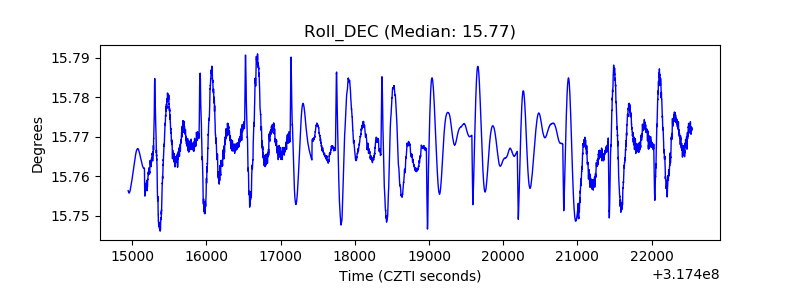 |
| _Roll_RA | 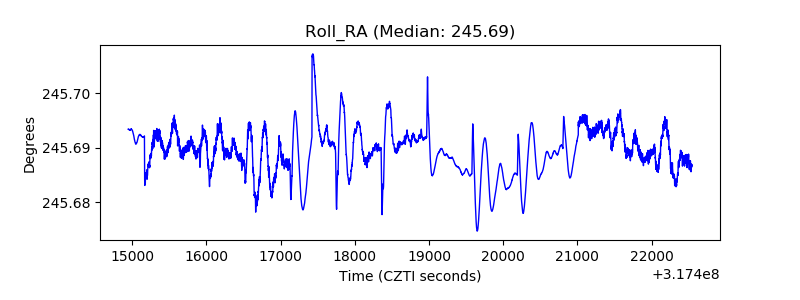 |
| Veto Counter | 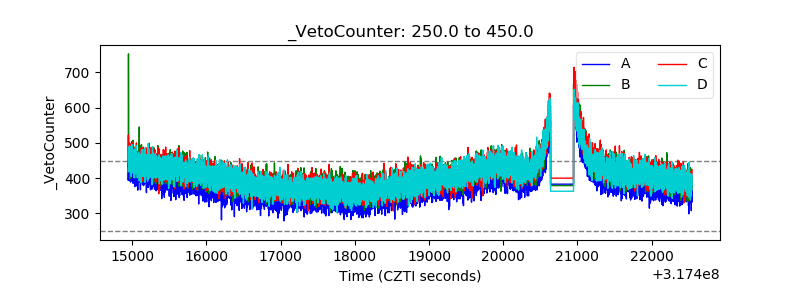 |