| Param | Original file | Final file |
|---|---|---|
| Filename | modeM0/AS1A07_135T02_9000003450_23353cztM0_level2.evt | modeM0/AS1A07_135T02_9000003450_23353cztM0_level2_quad_clean.evt |
| Size (bytes) | 616,429,440 | 82,759,680 |
| Size | 587.9 MB | 78.9 MB |
| Events in quadrant A | 3,441,189 | 501,729 |
| Events in quadrant B | 3,541,787 | 510,180 |
| Events in quadrant C | 5,548,020 | 501,100 |
| Events in quadrant D | 5,646,183 | 488,524 |
| Mode M9 | |||
|---|---|---|---|
| Quadrant | BADHDUFLAG | Total packets | Discarded packets |
| A | 0 | 3 | 0 |
| B | 0 | 3 | 0 |
| C | 0 | 3 | 0 |
| D | 0 | 3 | 0 |
| Mode M0 | |||
|---|---|---|---|
| Quadrant | BADHDUFLAG | Total packets | Discarded packets |
| A | 0 | 15207 | 340 |
| B | 0 | 15417 | 330 |
| C | 0 | 21627 | 371 |
| D | 0 | 22018 | 380 |
| Mode SS | |||
|---|---|---|---|
| Quadrant | BADHDUFLAG | Total packets | Discarded packets |
| A | 0 | 152 | 6 |
| B | 0 | 152 | 4 |
| C | 0 | 152 | 6 |
| D | 0 | 152 | 2 |
| Quadrant | Total seconds | Saturated seconds | Saturation percentage |
|---|---|---|---|
| A | 7241 | 57 | 0.787184% |
| B | 7250 | 86 | 1.186207% |
| C | 7259 | 813 | 11.199890% |
| D | 7239 | 549 | 7.583920% |
Noise dominated data is calculated using 1-second bins in cleaned event files. If a bin has >2000 counts, and if more than 50% of those come from <1% of pixels, then it is considered to be noise-dominated and hence unusable.
| Quadrant | # 1 sec bins | Bins with >0 counts | Bins with >2000 counts | High rate bins dominated by noise | Noise dominated (total time) | Noise dominated (detector-on time) | Marked lightcurve |
|---|---|---|---|---|---|---|---|
| A | 7702 | 7313 | 0 | 0 | 0.00% | 0.00% | 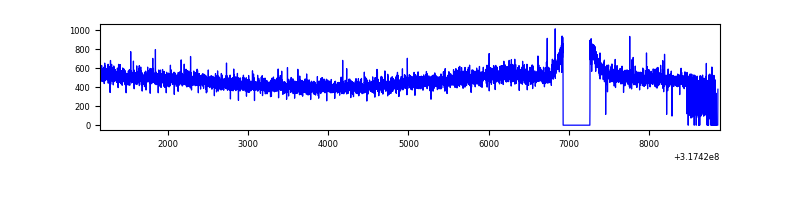 |
| B | 7727 | 7317 | 6 | 6 | 0.08% | 0.08% | 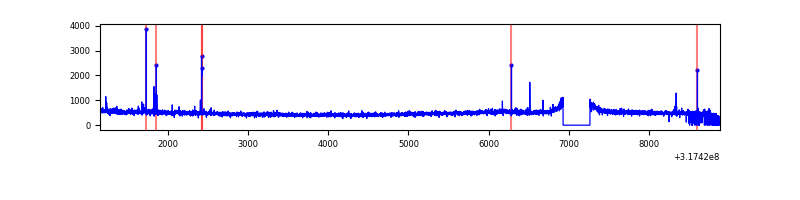 |
| C | 7707 | 7327 | 373 | 373 | 4.84% | 5.09% | 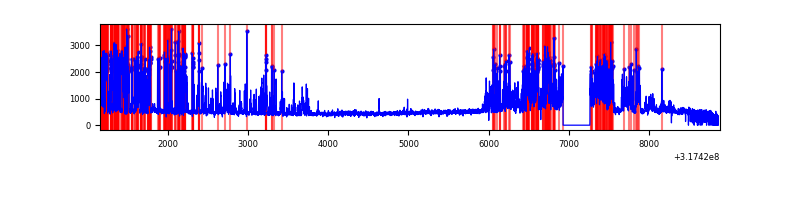 |
| D | 7709 | 7307 | 376 | 376 | 4.88% | 5.15% | 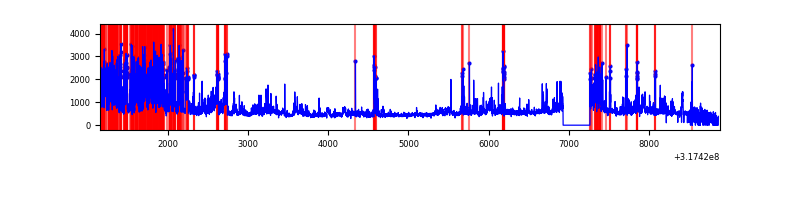 |
Top three noisy pixels from each quadrant. If the there are fewer than three noisy pixels in the level2.evt file, extra rows are filled as -1
| Pixel properties | Quadrant properties | ||||||
|---|---|---|---|---|---|---|---|
| Quadrant | DetID | PixID | Counts | Sigma | Mean | Median | Sigma |
| A | 13 | 254 | 11789 | 60.05 | 892 | 872 | 181.8 |
| A | 3 | 137 | 8053 | 39.5 | 892 | 872 | 181.8 |
| A | 0 | 226 | 7802 | 38.12 | 892 | 872 | 181.8 |
| B | 0 | 190 | 30229 | 169.62 | 885 | 861 | 173.1 |
| B | 0 | 189 | 21783 | 120.84 | 885 | 861 | 173.1 |
| B | 12 | 111 | 21015 | 116.4 | 885 | 861 | 173.1 |
| C | 0 | 239 | 2034369 | 10387.05 | 831 | 835 | 195.8 |
| C | 14 | 238 | 130798 | 663.84 | 831 | 835 | 195.8 |
| C | 0 | 207 | 64539 | 325.39 | 831 | 835 | 195.8 |
| D | 1 | 52 | 1751688 | 8415.39 | 849 | 824 | 208.1 |
| D | 12 | 227 | 233153 | 1116.67 | 849 | 824 | 208.1 |
| D | 13 | 249 | 139017 | 664.21 | 849 | 824 | 208.1 |
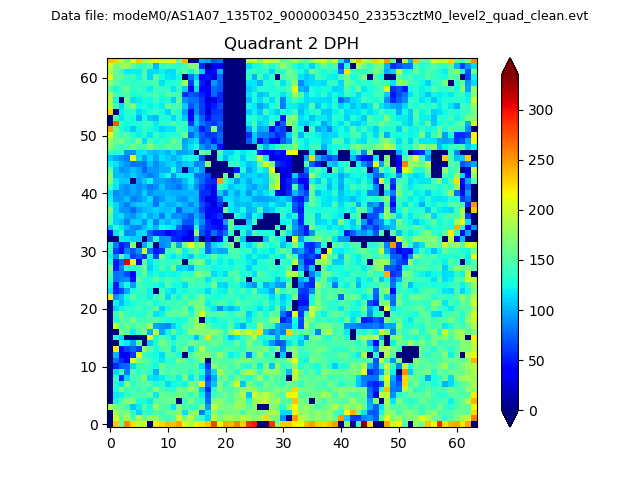
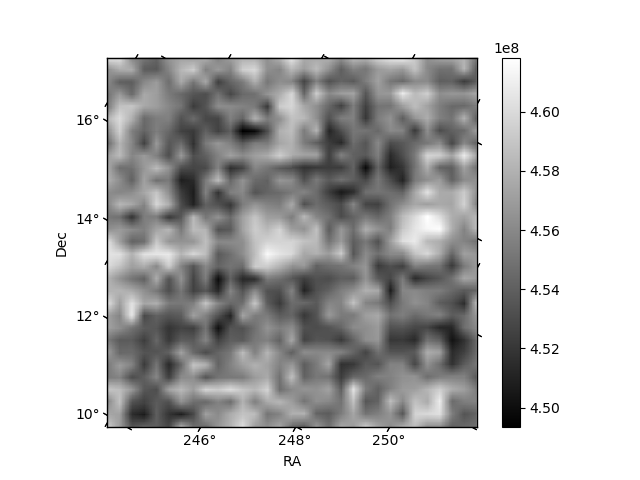
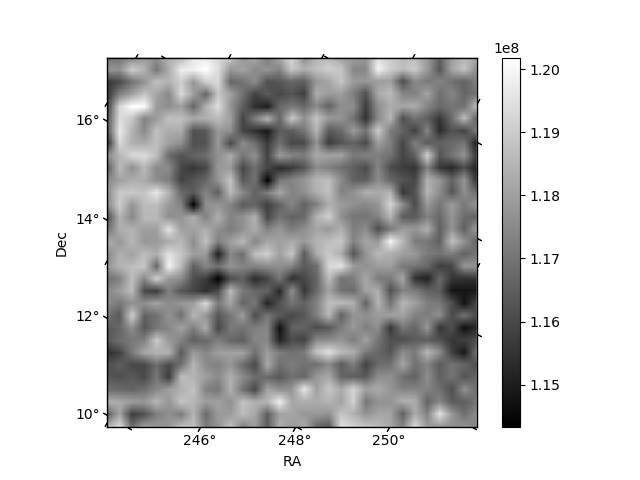
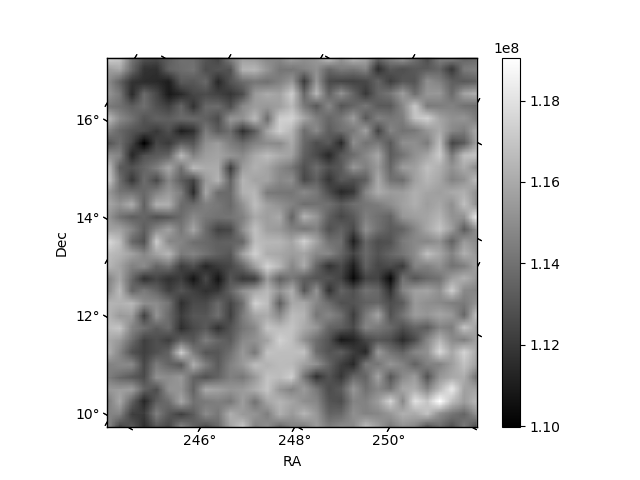
Histogram calculated using DETX and DETY for each event in the final _common_clean file
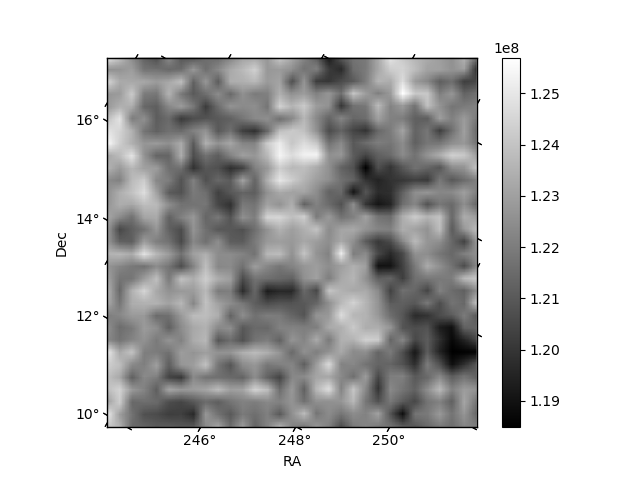
| Quadrant A | 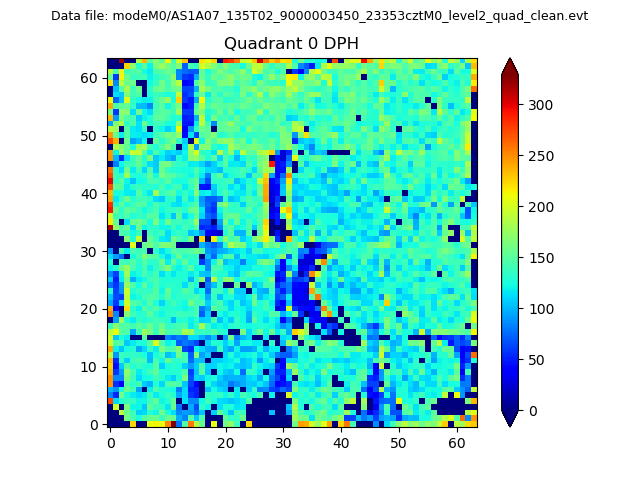 |
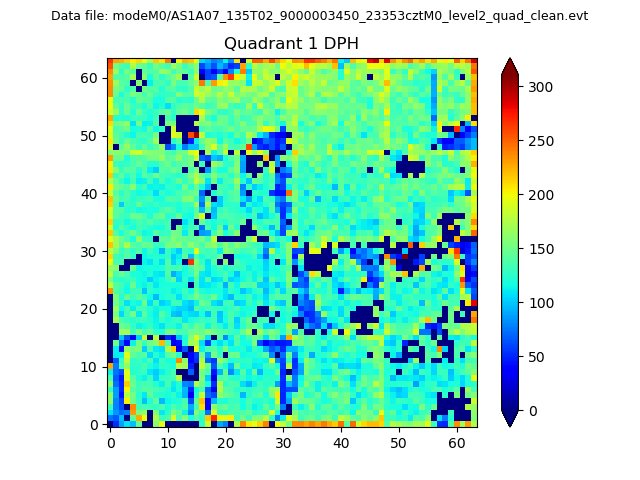 |
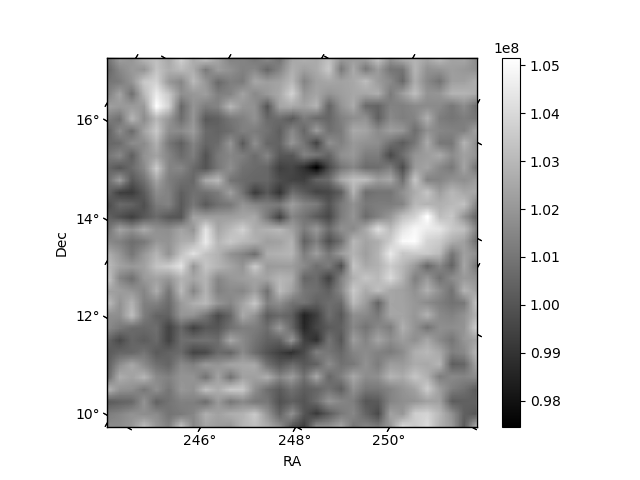
Quadrant B |
|---|---|---|---|
| Quadrant D | 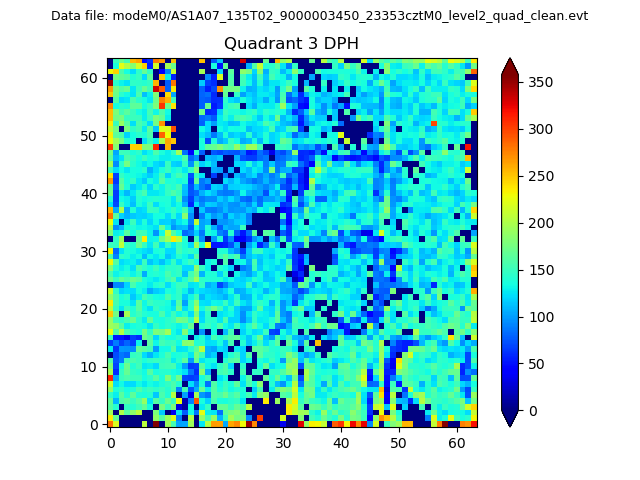 |
 |
Quadrant C |
| Plot type | Count rate plots | Images |
|---|---|---|
| Comparison with Poisson distribution Blue bars denote a histogram of data divided into 1 sec bins. Red curve is a Poisson curve with rate = median count rate of data. |
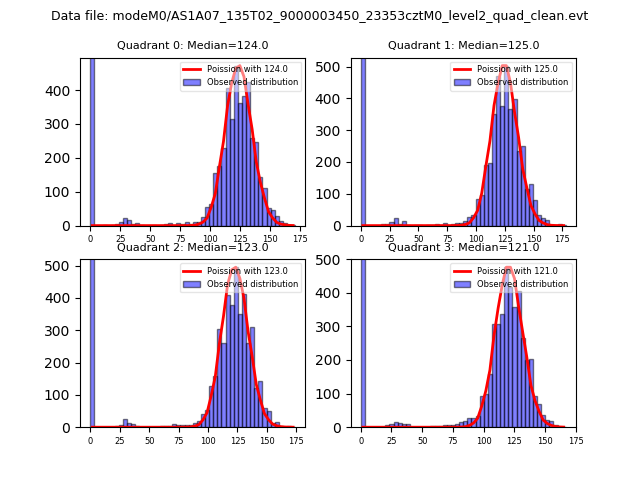 |
 |
| Quadrant-wise count rates Data is divided into 100 sec bins |
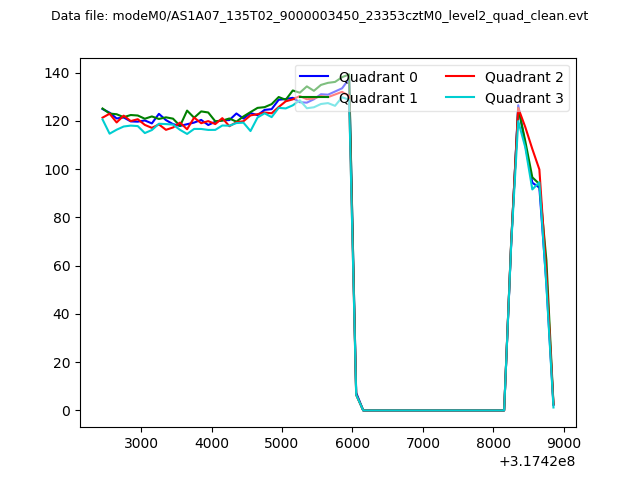 |
|
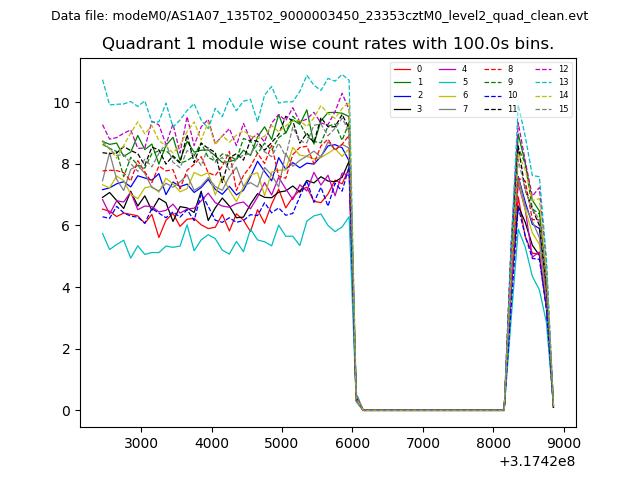
| Module-wise count rates for Quadrant A Data is divided into 100 sec bins |
 |
 |
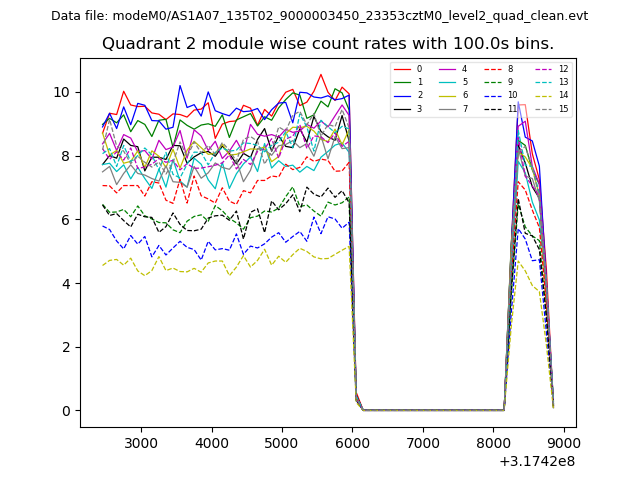
| Module-wise count rates for Quadrant B Data is divided into 100 sec bins |
 |
 |
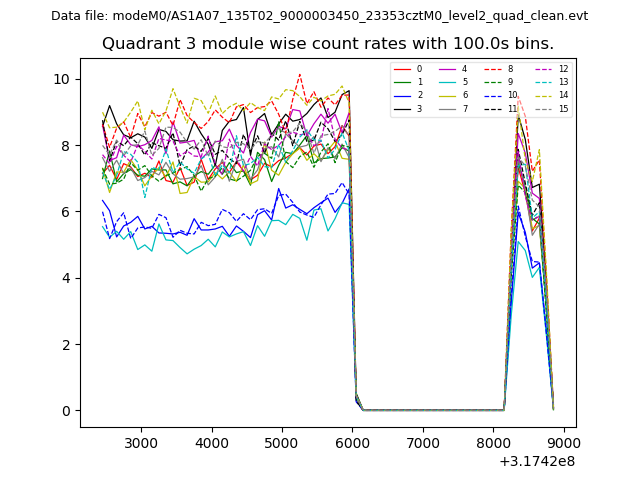
| Module-wise count rates for Quadrant C Data is divided into 100 sec bins |
 |
 |
| Module-wise count rates for Quadrant D Data is divided into 100 sec bins |
 |
 |
| Parameter | Plot |
|---|---|
| CZT HV Monitor | 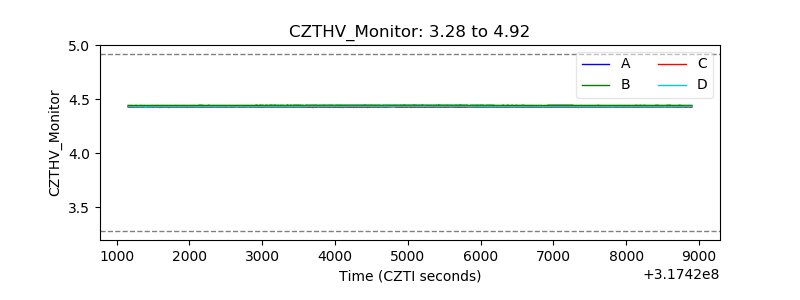 |
| D_VDD | 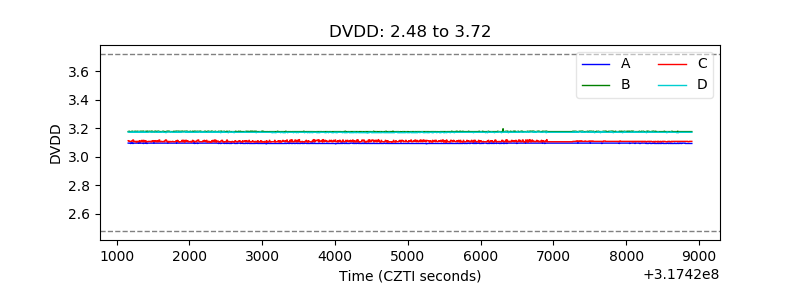 |
| Temperature 1 | 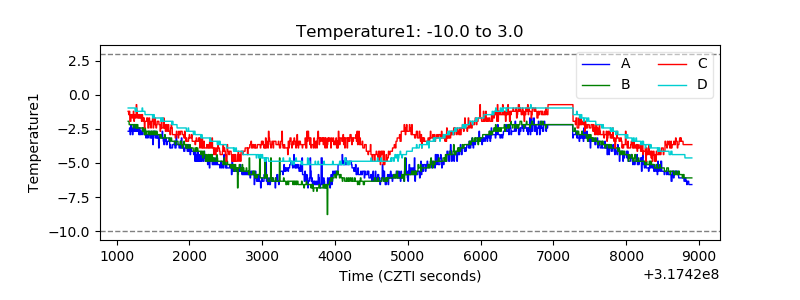 |
| Veto HV Monitor | 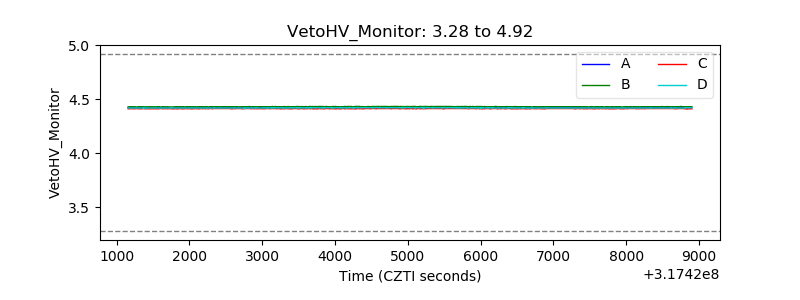 |
| Veto LLD | 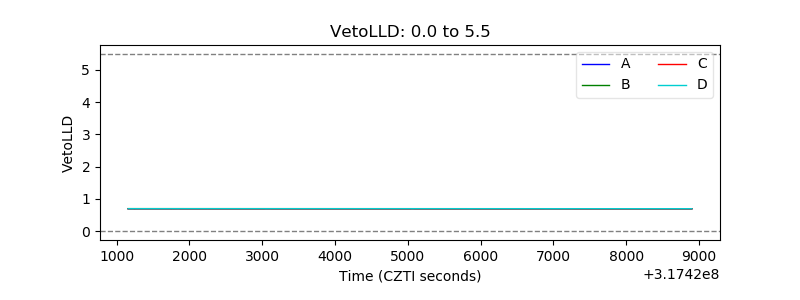 |
| Alpha Counter | 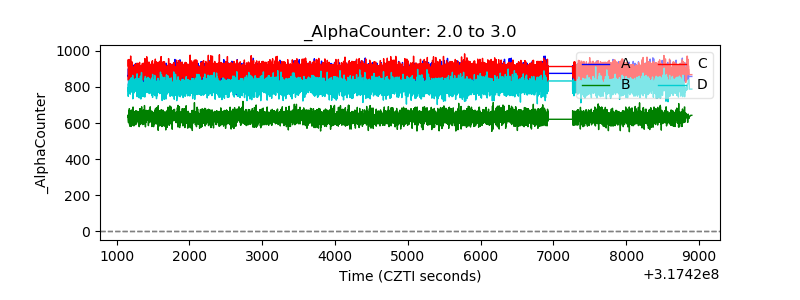 |
| _CPM_Rate |  |
| CZT Counter | 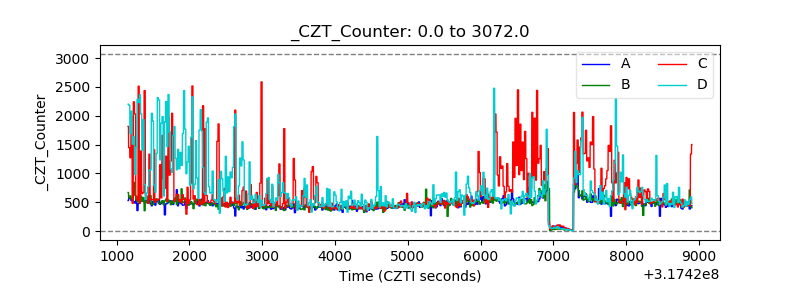 |
| +2.5 Volts monitor |  |
| +5 Volts monitor |  |
| _ROLL_ROT | 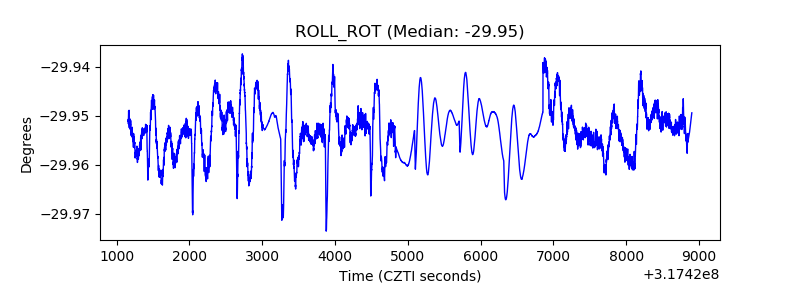 |
| _Roll_DEC | 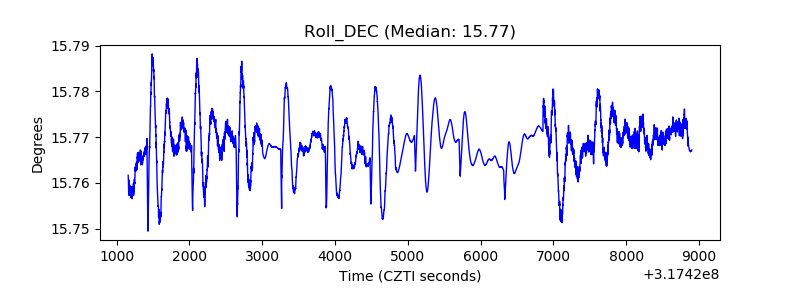 |
| _Roll_RA | 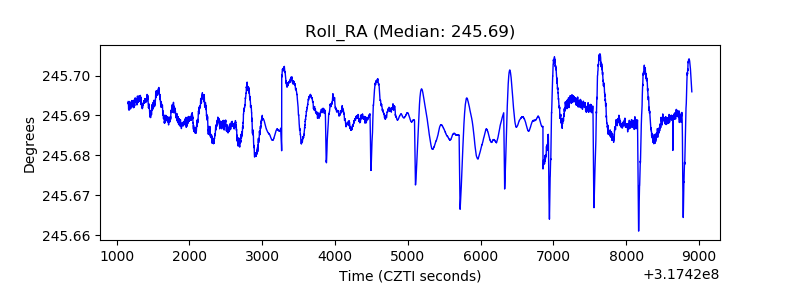 |
| Veto Counter | 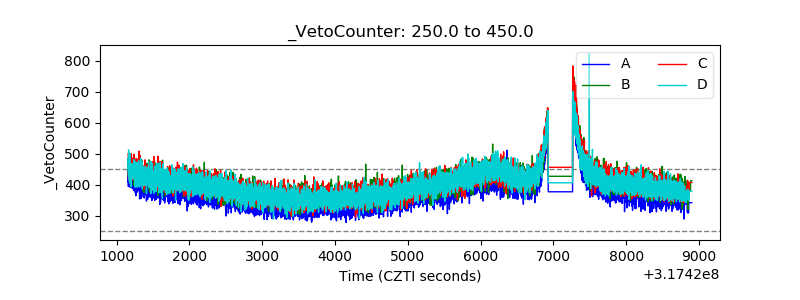 |