| Param | Original file | Final file |
|---|---|---|
| Filename | modeM0/AS1A07_135T02_9000003450_23356cztM0_level2.evt | modeM0/AS1A07_135T02_9000003450_23356cztM0_level2_quad_clean.evt |
| Size (bytes) | 111,899,520 | 15,724,800 |
| Size | 106.7 MB | 15.0 MB |
| Events in quadrant A | 673,084 | 91,965 |
| Events in quadrant B | 706,286 | 92,956 |
| Events in quadrant C | 1,003,790 | 92,920 |
| Events in quadrant D | 906,435 | 91,977 |
| Mode M0 | |||
|---|---|---|---|
| Quadrant | BADHDUFLAG | Total packets | Discarded packets |
| A | 0 | 2854 | 0 |
| B | 0 | 2920 | 0 |
| C | 0 | 3878 | 0 |
| D | 0 | 3626 | 0 |
| Mode SS | |||
|---|---|---|---|
| Quadrant | BADHDUFLAG | Total packets | Discarded packets |
| A | 0 | 28 | 0 |
| B | 0 | 28 | 0 |
| C | 0 | 28 | 0 |
| D | 0 | 28 | 0 |
| Quadrant | Total seconds | Saturated seconds | Saturation percentage |
|---|---|---|---|
| A | 1421 | 3 | 0.211119% |
| B | 1422 | 5 | 0.351617% |
| C | 1422 | 43 | 3.023910% |
| D | 1422 | 13 | 0.914205% |
Noise dominated data is calculated using 1-second bins in cleaned event files. If a bin has >2000 counts, and if more than 50% of those come from <1% of pixels, then it is considered to be noise-dominated and hence unusable.
| Quadrant | # 1 sec bins | Bins with >0 counts | Bins with >2000 counts | High rate bins dominated by noise | Noise dominated (total time) | Noise dominated (detector-on time) | Marked lightcurve |
|---|---|---|---|---|---|---|---|
| A | 1421 | 1421 | 0 | 0 | 0.00% | 0.00% | 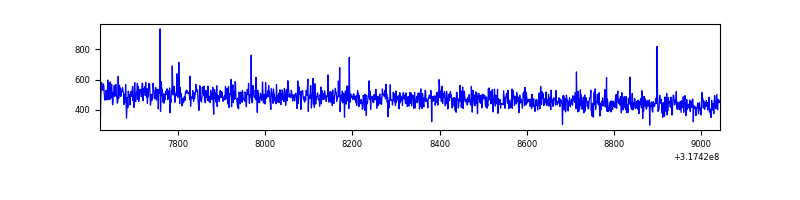 |
| B | 1422 | 1422 | 2 | 2 | 0.14% | 0.14% | 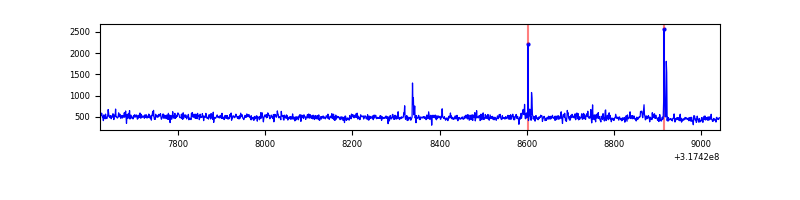 |
| C | 1422 | 1422 | 16 | 16 | 1.13% | 1.13% | 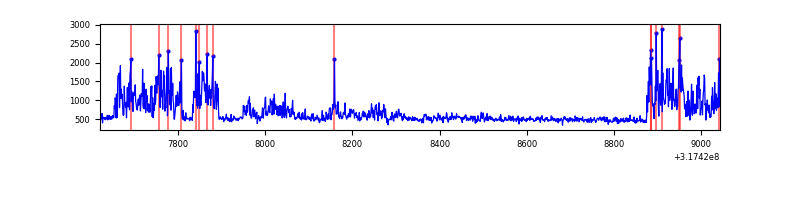 |
| D | 1422 | 1422 | 16 | 16 | 1.13% | 1.13% | 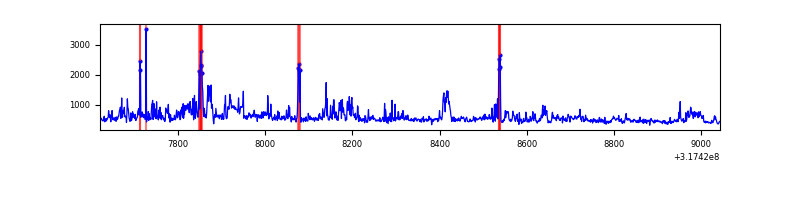 |
Top three noisy pixels from each quadrant. If the there are fewer than three noisy pixels in the level2.evt file, extra rows are filled as -1
| Pixel properties | Quadrant properties | ||||||
|---|---|---|---|---|---|---|---|
| Quadrant | DetID | PixID | Counts | Sigma | Mean | Median | Sigma |
| A | 13 | 254 | 2648 | 66.52 | 174 | 170 | 37.3 |
| A | 3 | 137 | 1590 | 38.12 | 174 | 170 | 37.3 |
| A | 0 | 226 | 1483 | 35.25 | 174 | 170 | 37.3 |
| B | 0 | 245 | 7000 | 189.27 | 173 | 169 | 36.1 |
| B | 5 | 172 | 6306 | 170.04 | 173 | 169 | 36.1 |
| B | 0 | 229 | 4746 | 126.82 | 173 | 169 | 36.1 |
| C | 0 | 239 | 307045 | 7296.82 | 168 | 168 | 42.1 |
| C | 14 | 238 | 27129 | 641.07 | 168 | 168 | 42.1 |
| C | 7 | 247 | 10348 | 242.06 | 168 | 168 | 42.1 |
| D | 1 | 52 | 135192 | 3101.99 | 170 | 165 | 43.5 |
| D | 13 | 172 | 42111 | 963.63 | 170 | 165 | 43.5 |
| D | 9 | 85 | 30195 | 689.88 | 170 | 165 | 43.5 |
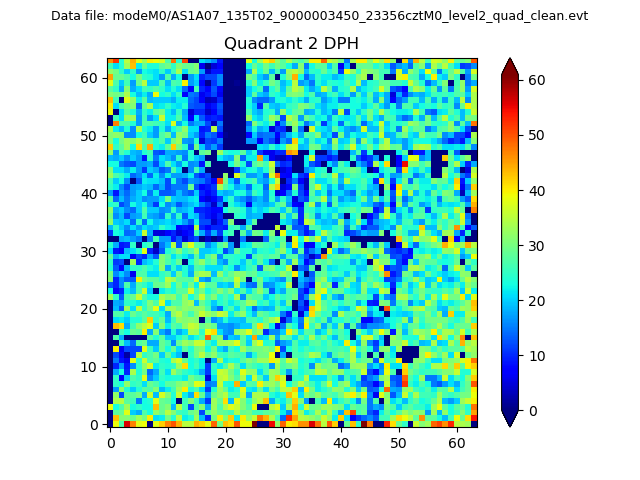
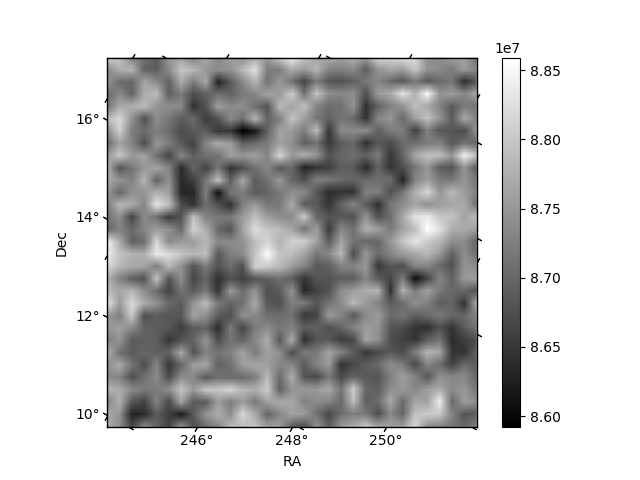
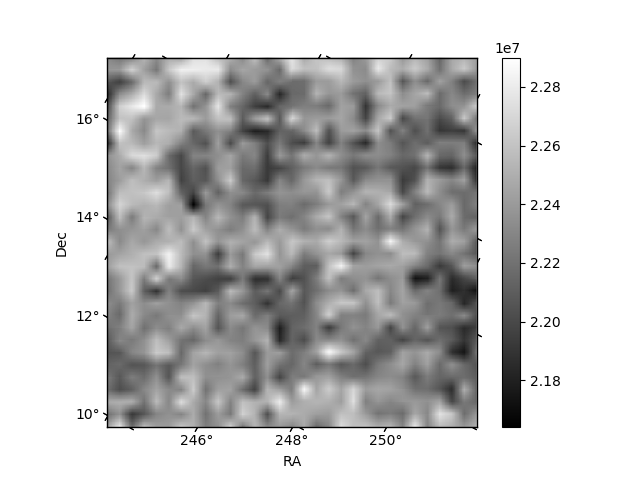
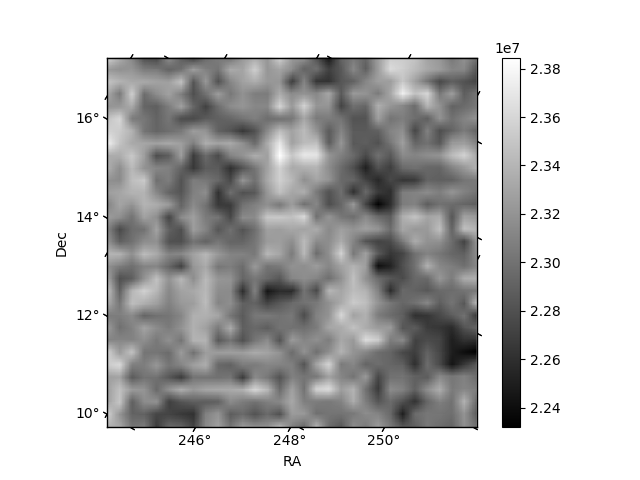
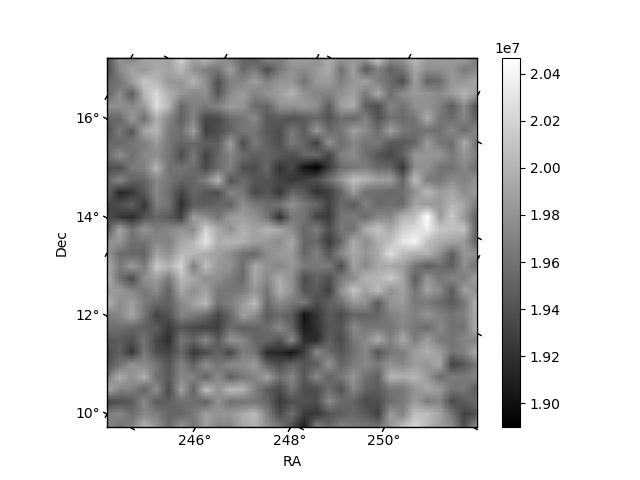
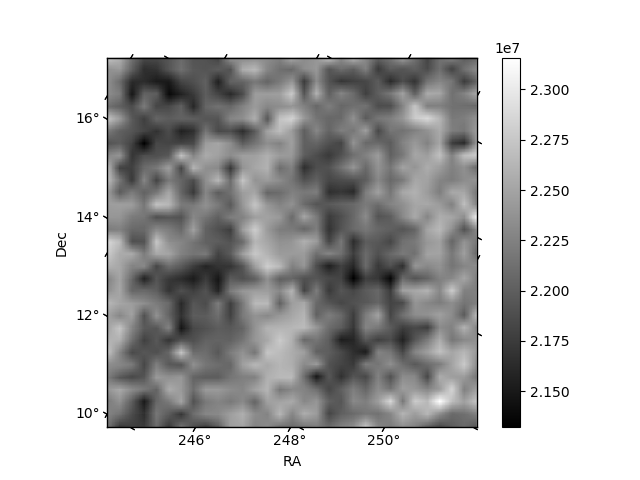
Histogram calculated using DETX and DETY for each event in the final _common_clean file
| Quadrant A | 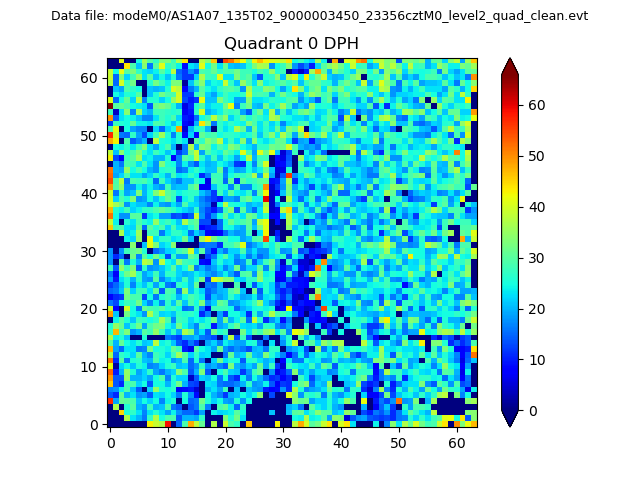 |
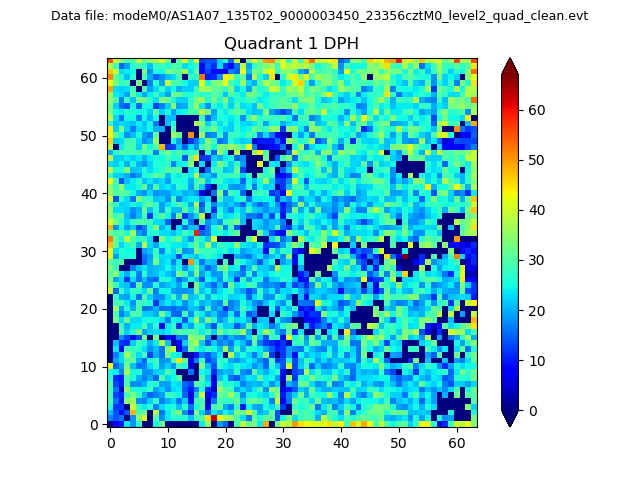 |
Quadrant B |
|---|---|---|---|
| Quadrant D | 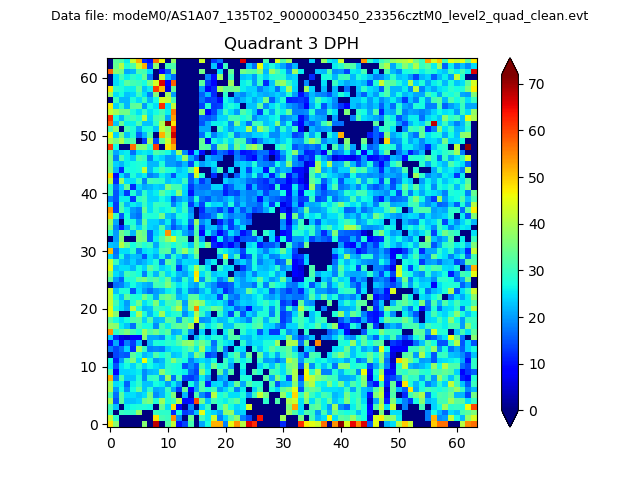 |
 |
Quadrant C |
| Plot type | Count rate plots | Images |
|---|---|---|
| Comparison with Poisson distribution Blue bars denote a histogram of data divided into 1 sec bins. Red curve is a Poisson curve with rate = median count rate of data. |
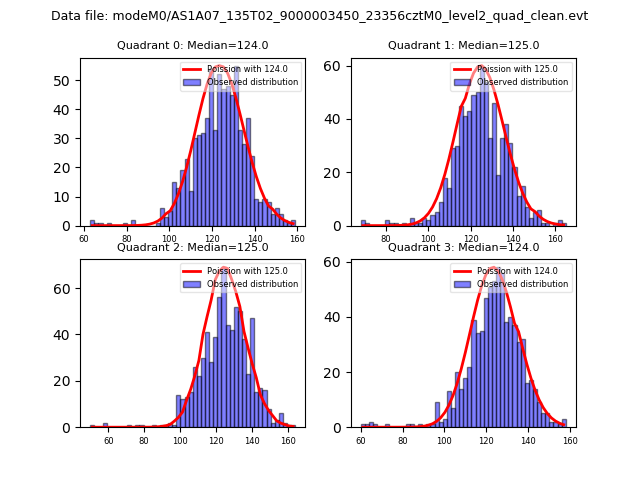 |
 |
| Quadrant-wise count rates Data is divided into 100 sec bins |
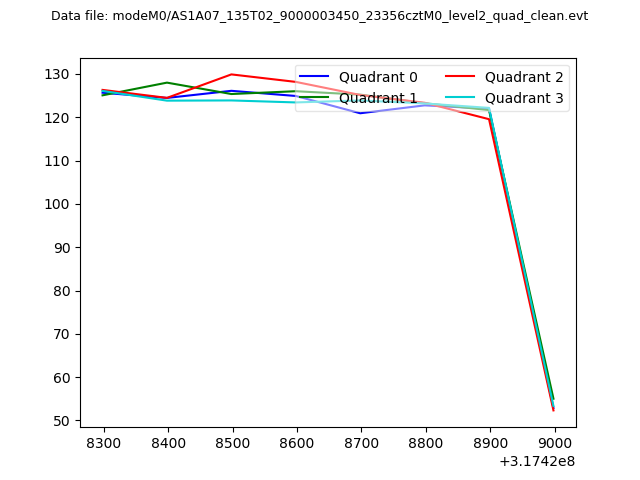 |
|
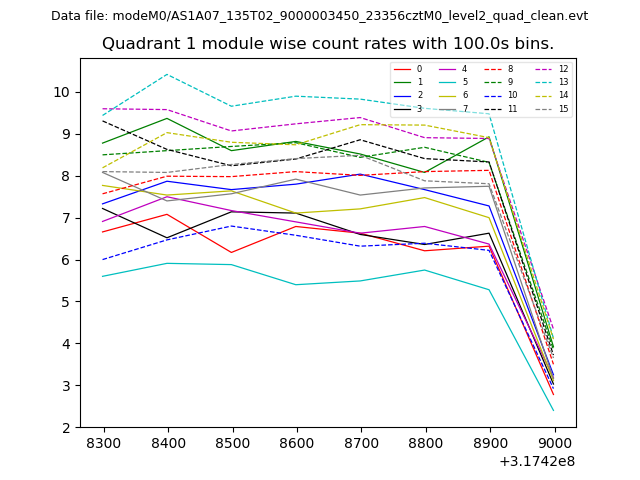
| Module-wise count rates for Quadrant A Data is divided into 100 sec bins |
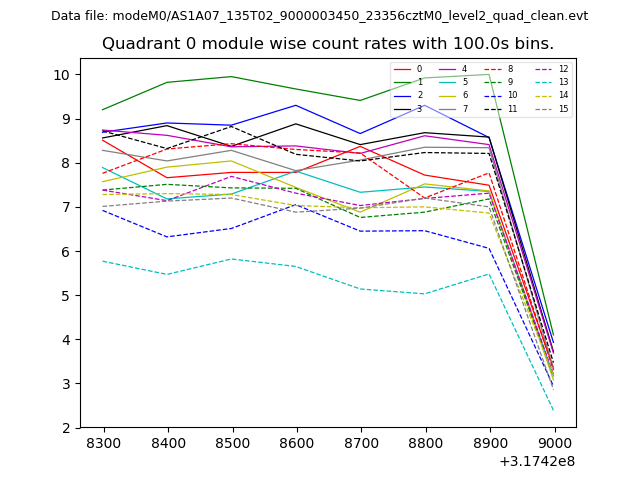 |
 |
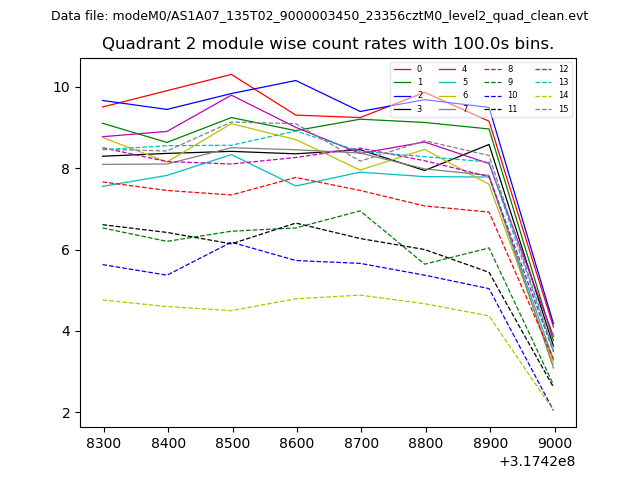
| Module-wise count rates for Quadrant B Data is divided into 100 sec bins |
 |
 |
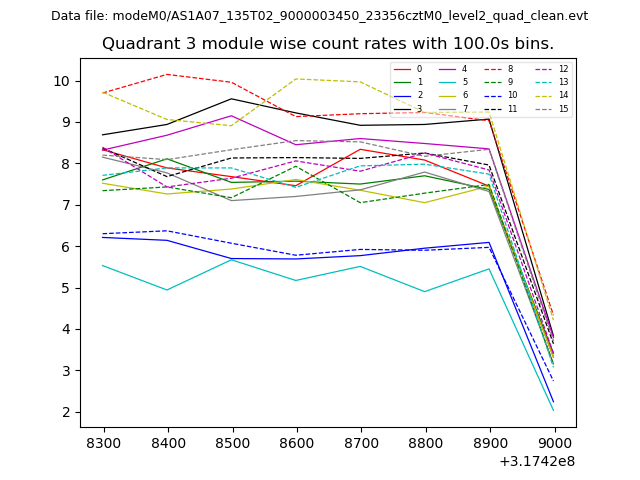
| Module-wise count rates for Quadrant C Data is divided into 100 sec bins |
 |
 |
| Module-wise count rates for Quadrant D Data is divided into 100 sec bins |
 |
 |
| Parameter | Plot |
|---|---|
| CZT HV Monitor | 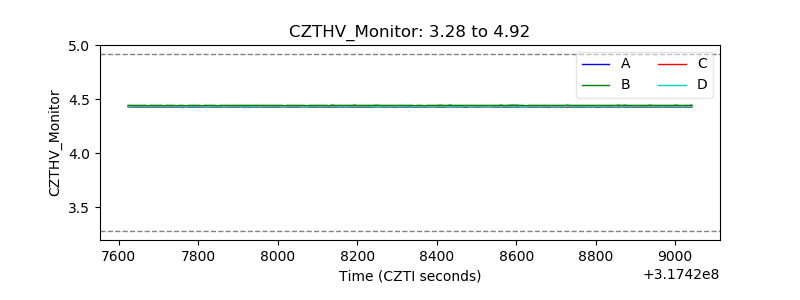 |
| D_VDD | 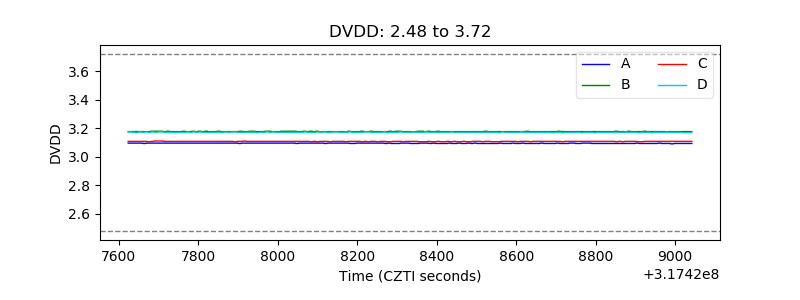 |
| Temperature 1 | 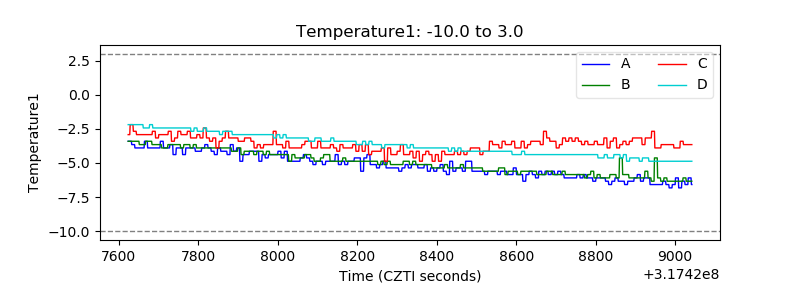 |
| Veto HV Monitor | 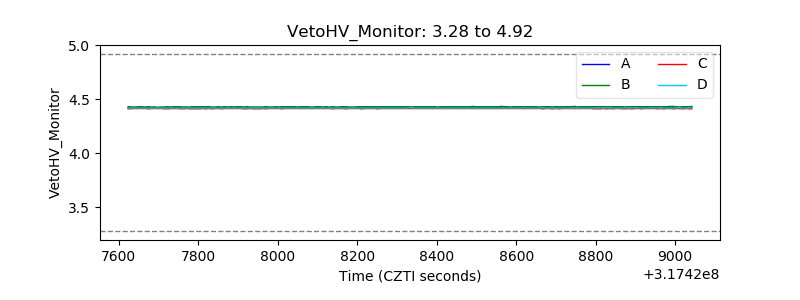 |
| Veto LLD | 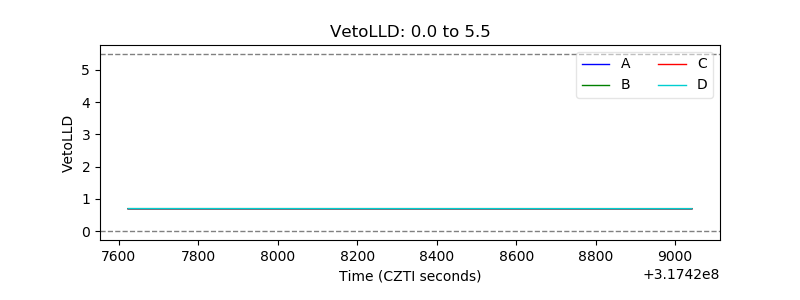 |
| Alpha Counter | 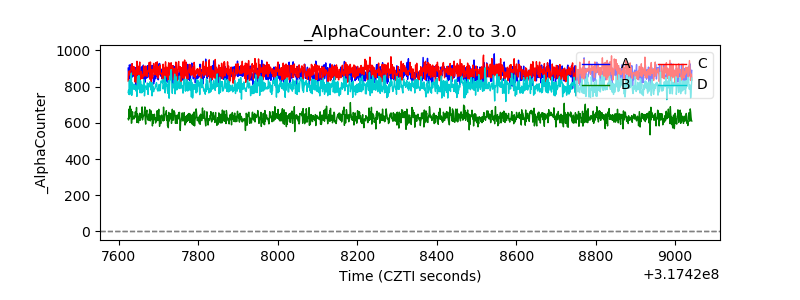 |
| _CPM_Rate |  |
| CZT Counter | 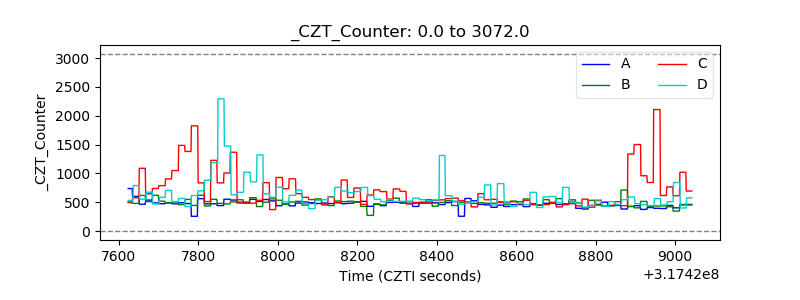 |
| +2.5 Volts monitor | 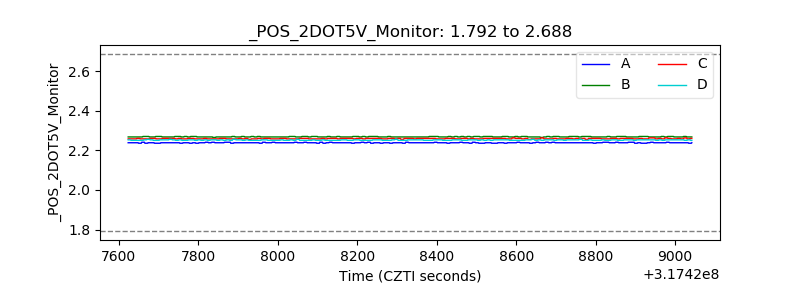 |
| +5 Volts monitor |  |
| _ROLL_ROT |  |
| _Roll_DEC | 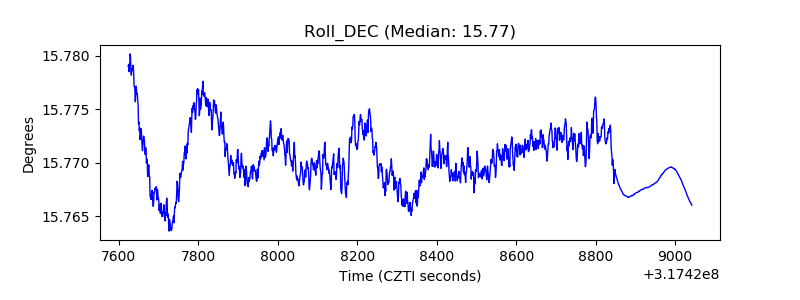 |
| _Roll_RA | 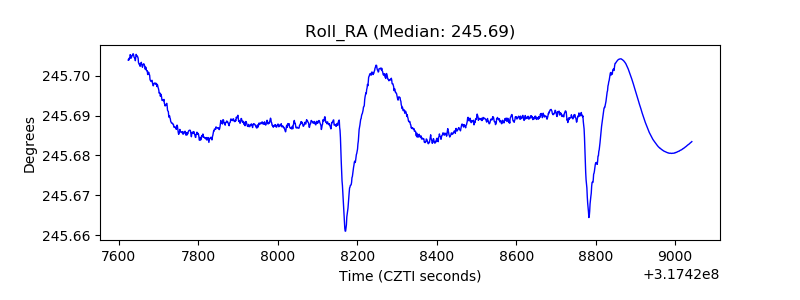 |
| Veto Counter | 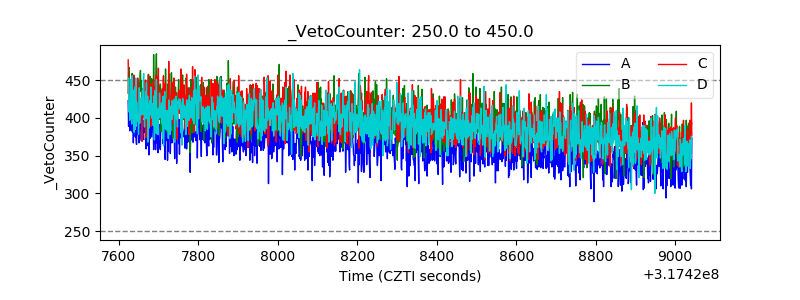 |