| Param | Original file | Final file |
|---|---|---|
| Filename | modeM0/AS1C05_002T03_9000003448cztM0_level2.fits | modeM0/AS1C05_002T03_9000003448cztM0_level2_quad_clean.evt |
| Size (bytes) | 82,290,240 | 40,124,160 |
| Size | 78.5 MB | 38.3 MB |
| Events in quadrant A | 528,394 | 186,274 |
| Events in quadrant B | 501,880 | 184,637 |
| Events in quadrant C | 517,440 | 179,170 |
| Events in quadrant D | 443,754 | 162,877 |
| Mode SS | |||
|---|---|---|---|
| Quadrant | BADHDUFLAG | Total packets | Discarded packets |
| A | 0 | 150 | 0 |
| B | 0 | 150 | 0 |
| C | 0 | 150 | 0 |
| D | 0 | 150 | 0 |
| Mode M0 | |||
|---|---|---|---|
| Quadrant | BADHDUFLAG | Total packets | Discarded packets |
| A | 0 | 15871 | 0 |
| B | 0 | 16139 | 0 |
| C | 0 | 17391 | 0 |
| D | 0 | 28430 | 0 |
| Mode M9 | |||
|---|---|---|---|
| Quadrant | BADHDUFLAG | Total packets | Discarded packets |
| A | 0 | 25 | 0 |
| B | 0 | 25 | 0 |
| C | 0 | 25 | 0 |
| D | 0 | 25 | 0 |
| Quadrant | Total seconds | Saturated seconds | Saturation percentage |
|---|---|---|---|
| A | 7187 | 158 | 2.198414% |
| B | 7187 | 174 | 2.421038% |
| C | 7187 | 247 | 3.436761% |
| D | 7187 | 335 | 4.661194% |
Noise dominated data is calculated using 1-second bins in cleaned event files. If a bin has >2000 counts, and if more than 50% of those come from <1% of pixels, then it is considered to be noise-dominated and hence unusable.
| Quadrant | # 1 sec bins | Bins with >0 counts | Bins with >2000 counts | High rate bins dominated by noise | Noise dominated (total time) | Noise dominated (detector-on time) | Marked lightcurve |
|---|---|---|---|---|---|---|---|
| A | 9792 | 7185 | 0 | 0 | 0.00% | 0.00% |  |
| B | 9792 | 7185 | 0 | 0 | 0.00% | 0.00% | 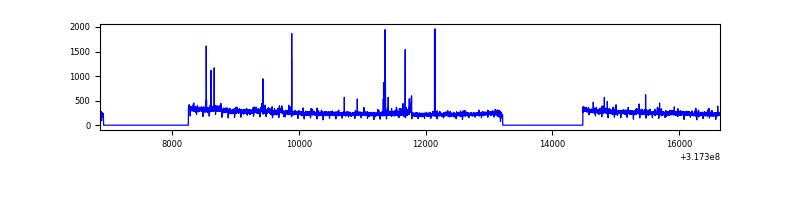 |
| C | 9792 | 7185 | 0 | 0 | 0.00% | 0.00% |  |
| D | 9792 | 7185 | 0 | 0 | 0.00% | 0.00% | 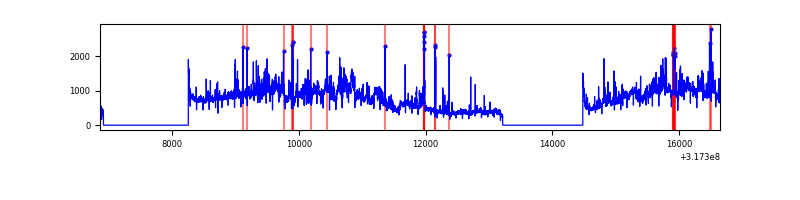 |
Top three noisy pixels from each quadrant. If the there are fewer than three noisy pixels in the level2.evt file, extra rows are filled as -1
| Pixel properties | Quadrant properties | ||||||
|---|---|---|---|---|---|---|---|
| Quadrant | DetID | PixID | Counts | Sigma | Mean | Median | Sigma |
| A | 0 | 29 | 467 | 9.71 | 137 | 130 | 34.7 |
| A | 7 | 110 | 436 | 8.82 | 137 | 130 | 34.7 |
| A | 12 | 254 | 397 | 7.7 | 137 | 130 | 34.7 |
| B | 2 | 9 | 363 | 8.42 | 132 | 127 | 28.0 |
| B | 5 | 255 | 355 | 8.13 | 132 | 127 | 28.0 |
| B | 3 | 80 | 352 | 8.03 | 132 | 127 | 28.0 |
| C | 1 | 80 | 352 | 6.27 | 136 | 130 | 35.4 |
| C | 3 | 158 | 347 | 6.13 | 136 | 130 | 35.4 |
| C | 2 | 191 | 346 | 6.1 | 136 | 130 | 35.4 |
| D | 4 | 246 | 369 | 7.32 | 126 | 116 | 34.6 |
| D | 10 | 189 | 341 | 6.51 | 126 | 116 | 34.6 |
| D | 6 | 231 | 337 | 6.39 | 126 | 116 | 34.6 |
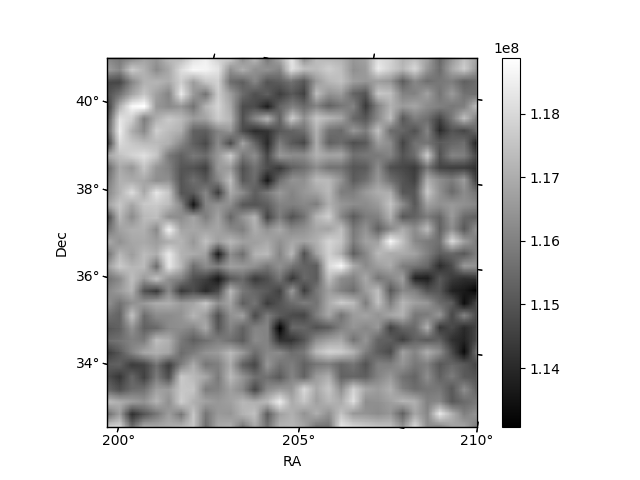
Histogram calculated using DETX and DETY for each event in the final _common_clean file
| Quadrant A | 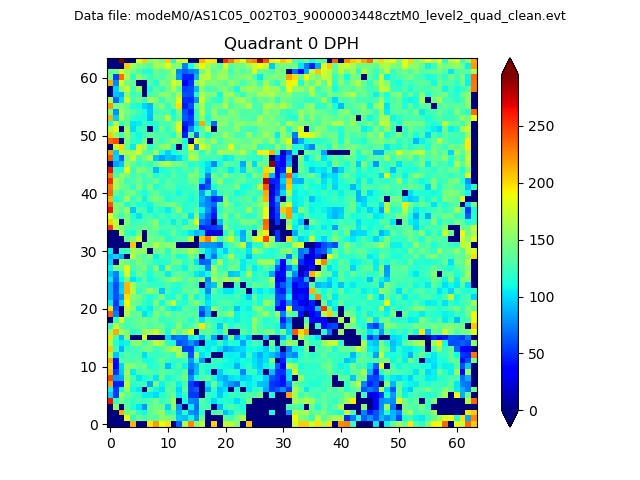 |
 |
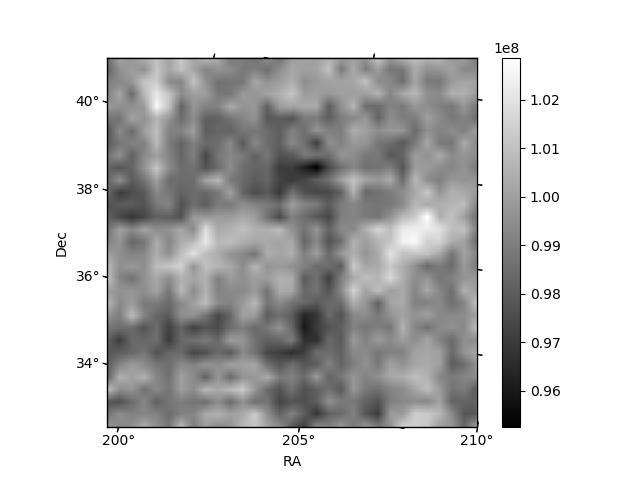
Quadrant B |
|---|---|---|---|
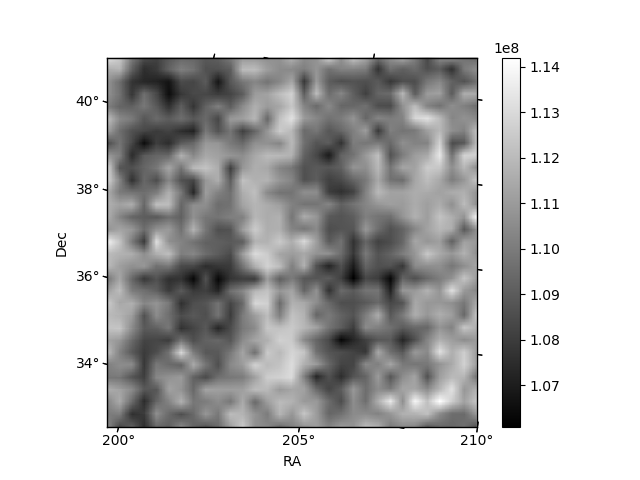
| Quadrant D | 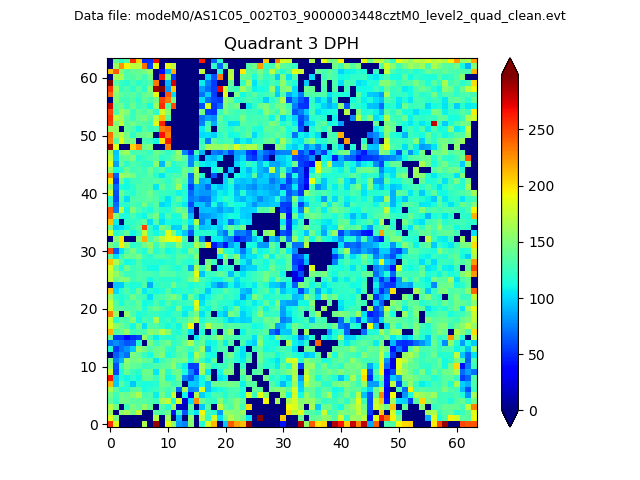 |
 |
Quadrant C |
| Plot type | Count rate plots | Images |
|---|---|---|
| Comparison with Poisson distribution Blue bars denote a histogram of data divided into 1 sec bins. Red curve is a Poisson curve with rate = median count rate of data. |
 |
 |
| Quadrant-wise count rates Data is divided into 100 sec bins |
 |
|
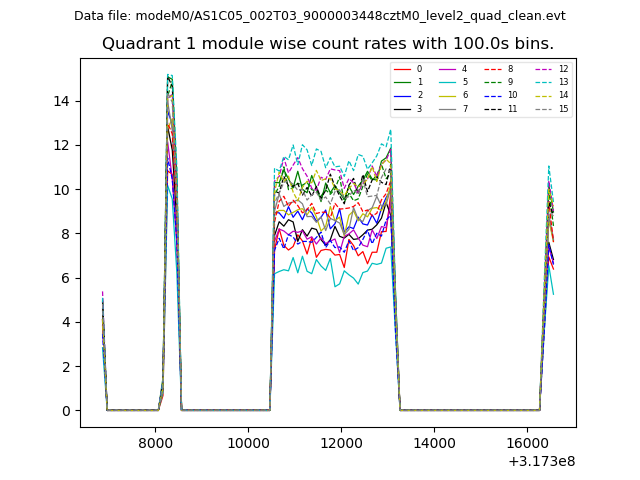
| Module-wise count rates for Quadrant A Data is divided into 100 sec bins |
 |
 |
| Module-wise count rates for Quadrant B Data is divided into 100 sec bins |
 |
 |
| Module-wise count rates for Quadrant C Data is divided into 100 sec bins |
 |
 |
| Module-wise count rates for Quadrant D Data is divided into 100 sec bins |
 |
 |
| Parameter | Plot |
|---|---|
| CZT HV Monitor | 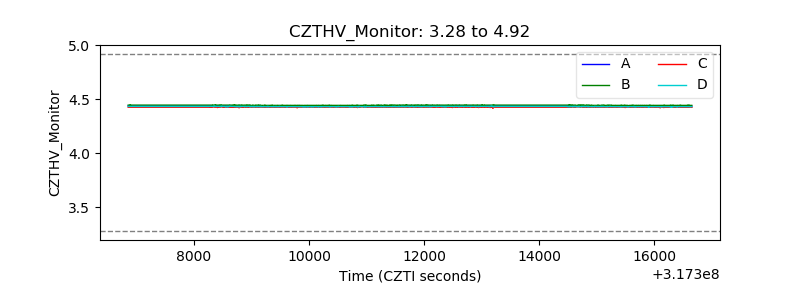 |
| D_VDD |  |
| Temperature 1 |  |
| Veto HV Monitor |  |
| Veto LLD |  |
| Alpha Counter | 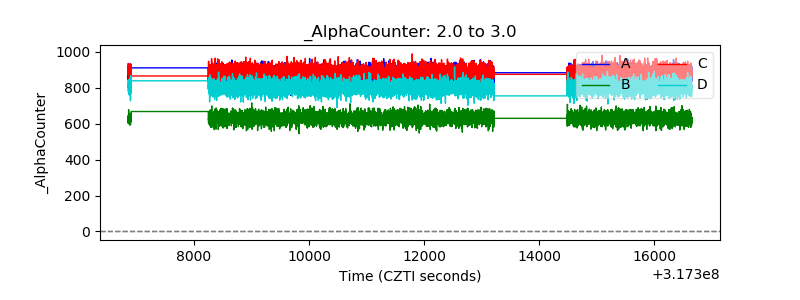 |
| _CPM_Rate |  |
| CZT Counter |  |
| +2.5 Volts monitor |  |
| +5 Volts monitor |  |
| _ROLL_ROT |  |
| _Roll_DEC | 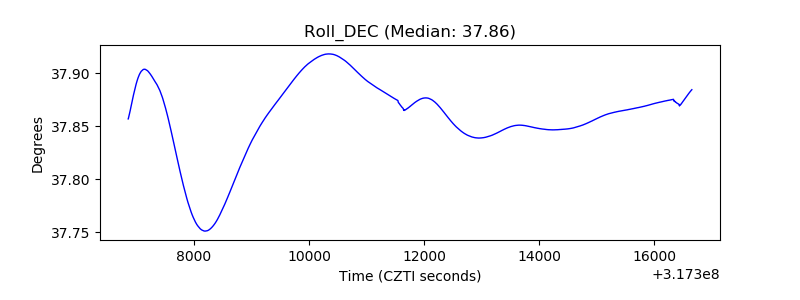 |
| _Roll_RA | 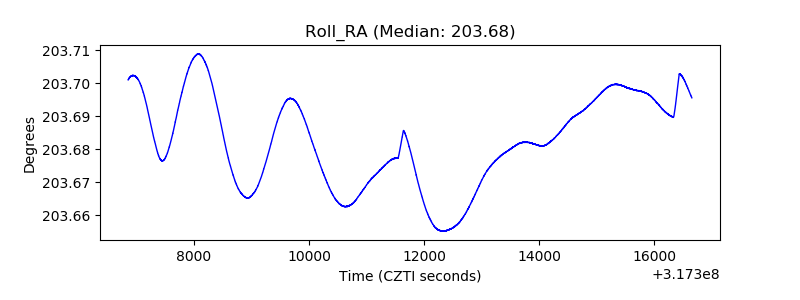 |
| Veto Counter |  |