| Param | Original file | Final file |
|---|---|---|
| Filename | modeM0/AS1C05_002T03_9000003448_23334cztM0_level2.evt | modeM0/AS1C05_002T03_9000003448_23334cztM0_level2_quad_clean.evt |
| Size (bytes) | 604,805,760 | 72,218,880 |
| Size | 576.8 MB | 68.9 MB |
| Events in quadrant A | 3,490,780 | 442,276 |
| Events in quadrant B | 3,571,831 | 445,955 |
| Events in quadrant C | 3,927,261 | 431,773 |
| Events in quadrant D | 6,891,101 | 416,998 |
| Mode SS | |||
|---|---|---|---|
| Quadrant | BADHDUFLAG | Total packets | Discarded packets |
| A | 0 | 132 | 0 |
| B | 0 | 132 | 0 |
| C | 0 | 132 | 0 |
| D | 0 | 132 | 0 |
| Mode M0 | |||
|---|---|---|---|
| Quadrant | BADHDUFLAG | Total packets | Discarded packets |
| A | 0 | 14321 | 2 |
| B | 0 | 14582 | 2 |
| C | 0 | 15812 | 2 |
| D | 0 | 25041 | 2 |
| Mode M9 | |||
|---|---|---|---|
| Quadrant | BADHDUFLAG | Total packets | Discarded packets |
| A | 0 | 12 | 0 |
| B | 0 | 13 | 0 |
| C | 0 | 13 | 0 |
| D | 0 | 13 | 0 |
| Quadrant | Total seconds | Saturated seconds | Saturation percentage |
|---|---|---|---|
| A | 6443 | 105 | 1.629676% |
| B | 6442 | 121 | 1.878299% |
| C | 6442 | 191 | 2.964918% |
| D | 6442 | 264 | 4.098106% |
Noise dominated data is calculated using 1-second bins in cleaned event files. If a bin has >2000 counts, and if more than 50% of those come from <1% of pixels, then it is considered to be noise-dominated and hence unusable.
| Quadrant | # 1 sec bins | Bins with >0 counts | Bins with >2000 counts | High rate bins dominated by noise | Noise dominated (total time) | Noise dominated (detector-on time) | Marked lightcurve |
|---|---|---|---|---|---|---|---|
| A | 7708 | 6443 | 0 | 0 | 0.00% | 0.00% | 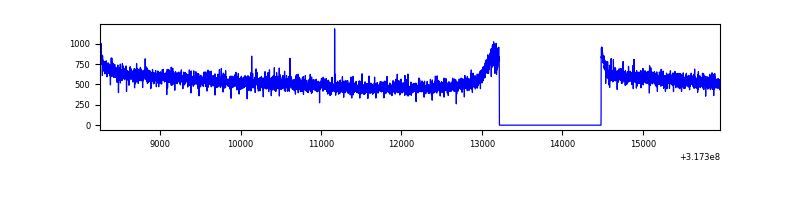 |
| B | 7707 | 6442 | 9 | 9 | 0.12% | 0.14% | 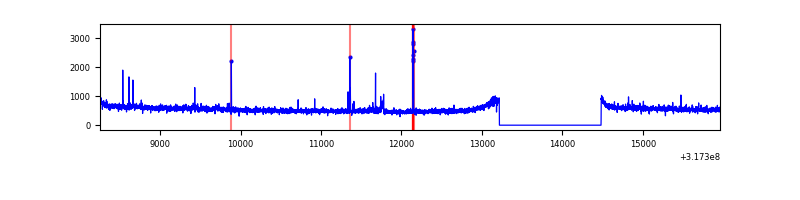 |
| C | 7707 | 6442 | 12 | 12 | 0.16% | 0.19% | 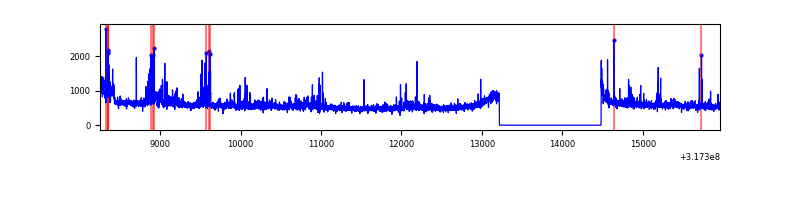 |
| D | 7707 | 6442 | 73 | 73 | 0.95% | 1.13% | 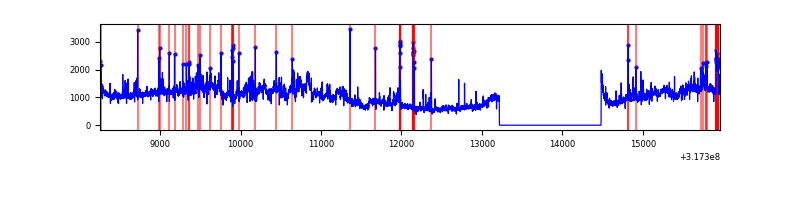 |
Top three noisy pixels from each quadrant. If the there are fewer than three noisy pixels in the level2.evt file, extra rows are filled as -1
| Pixel properties | Quadrant properties | ||||||
|---|---|---|---|---|---|---|---|
| Quadrant | DetID | PixID | Counts | Sigma | Mean | Median | Sigma |
| A | 6 | 16 | 15710 | 82.14 | 902 | 883 | 180.5 |
| A | 13 | 254 | 9847 | 49.66 | 902 | 883 | 180.5 |
| A | 0 | 226 | 7877 | 38.75 | 902 | 883 | 180.5 |
| B | 0 | 230 | 30654 | 179.37 | 889 | 868 | 166.1 |
| B | 0 | 183 | 21032 | 121.43 | 889 | 868 | 166.1 |
| B | 5 | 172 | 19002 | 109.2 | 889 | 868 | 166.1 |
| C | 10 | 9 | 367157 | 1853.54 | 867 | 876 | 197.6 |
| C | 14 | 238 | 140716 | 707.65 | 867 | 876 | 197.6 |
| C | 7 | 247 | 14701 | 69.96 | 867 | 876 | 197.6 |
| D | 7 | 223 | 3018852 | 14219.27 | 876 | 852 | 212.2 |
| D | 1 | 52 | 380596 | 1789.16 | 876 | 852 | 212.2 |
| D | 13 | 249 | 47035 | 217.59 | 876 | 852 | 212.2 |
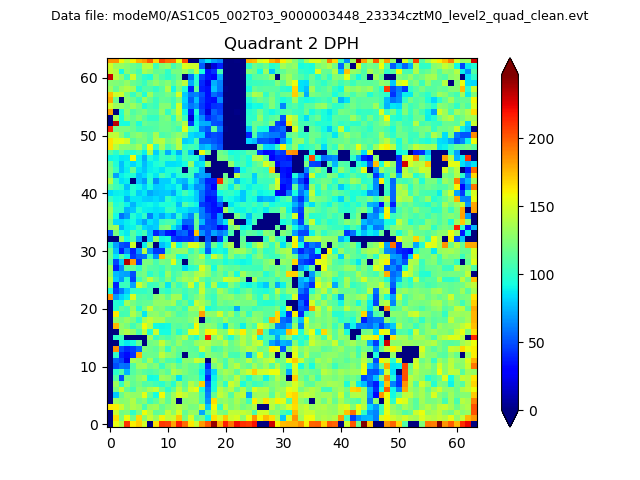
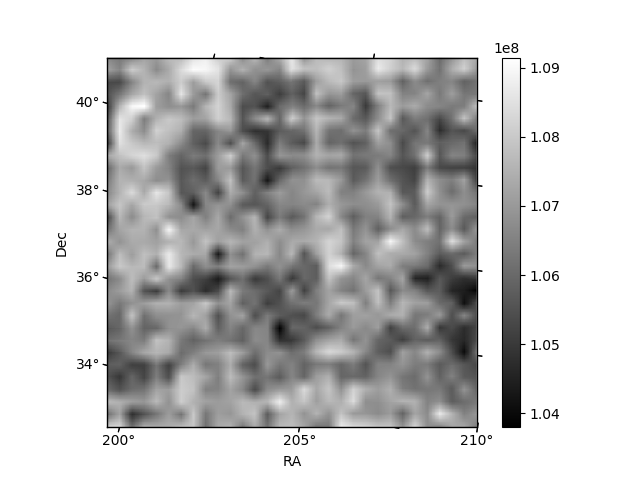
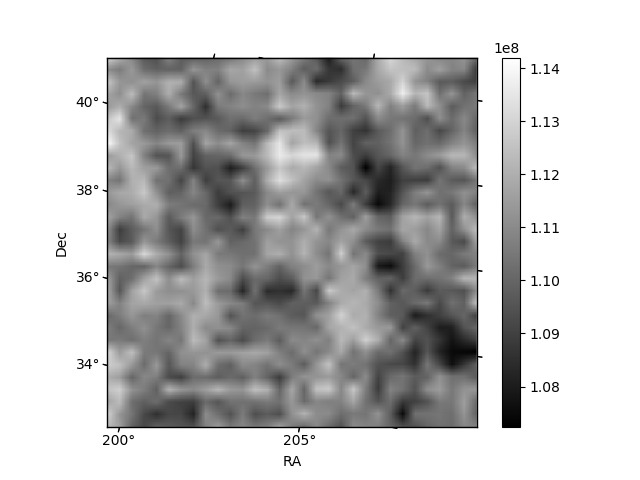
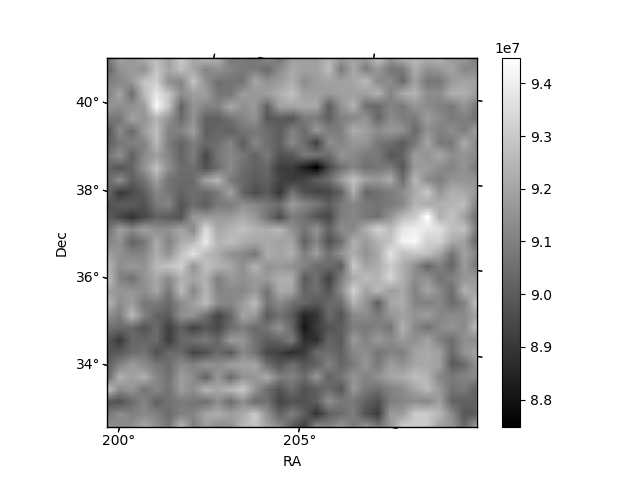
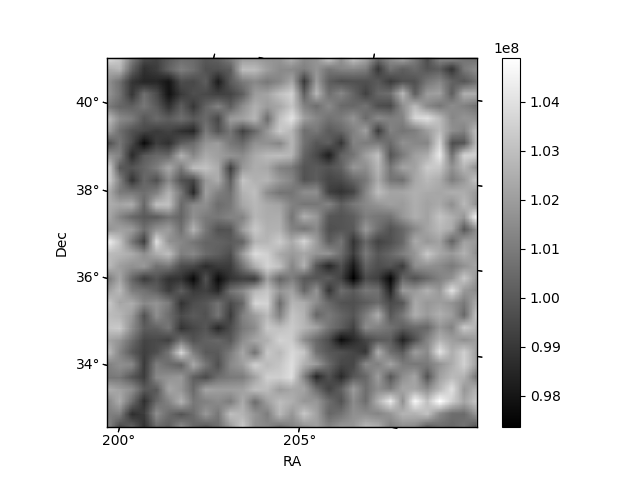
Histogram calculated using DETX and DETY for each event in the final _common_clean file
| Quadrant A | 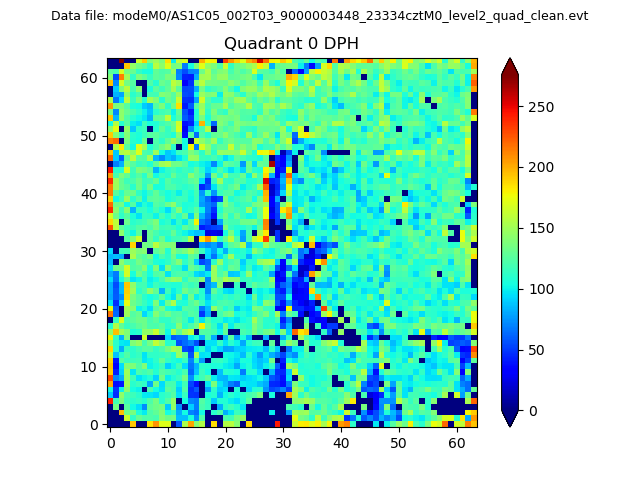 |
 |
Quadrant B |
|---|---|---|---|
| Quadrant D |  |
 |
Quadrant C |
| Plot type | Count rate plots | Images |
|---|---|---|
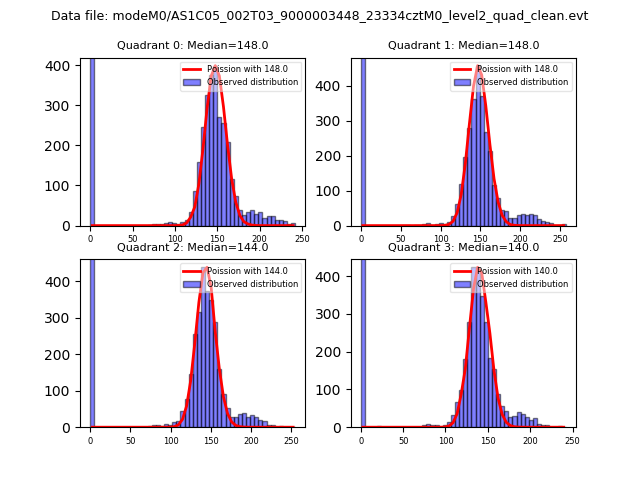
| Comparison with Poisson distribution Blue bars denote a histogram of data divided into 1 sec bins. Red curve is a Poisson curve with rate = median count rate of data. |
 |
 |
| Quadrant-wise count rates Data is divided into 100 sec bins |
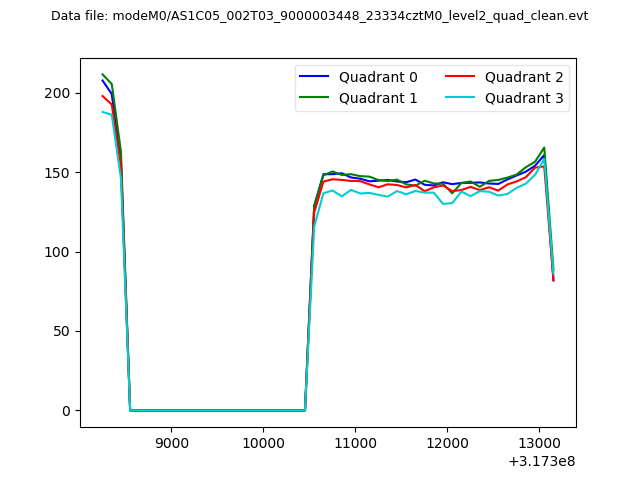 |
|
| Module-wise count rates for Quadrant A Data is divided into 100 sec bins |
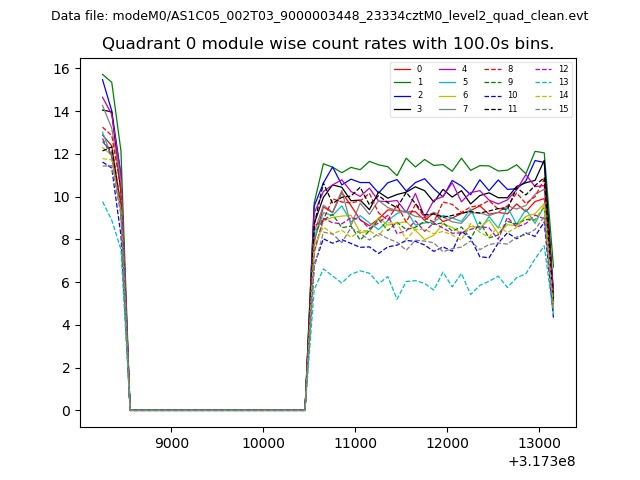 |
 |
| Module-wise count rates for Quadrant B Data is divided into 100 sec bins |
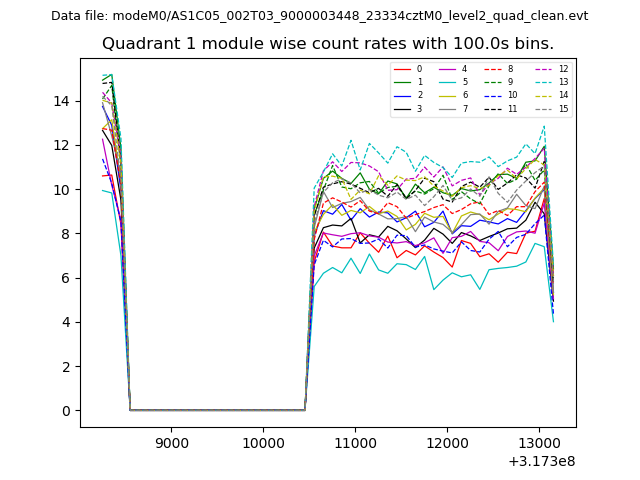 |
 |
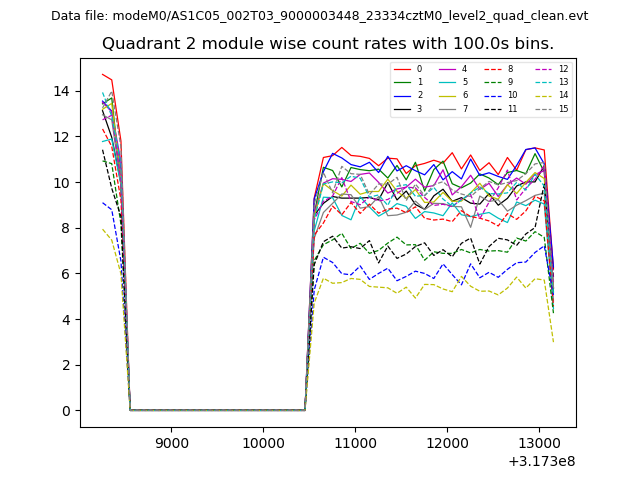
| Module-wise count rates for Quadrant C Data is divided into 100 sec bins |
 |
 |
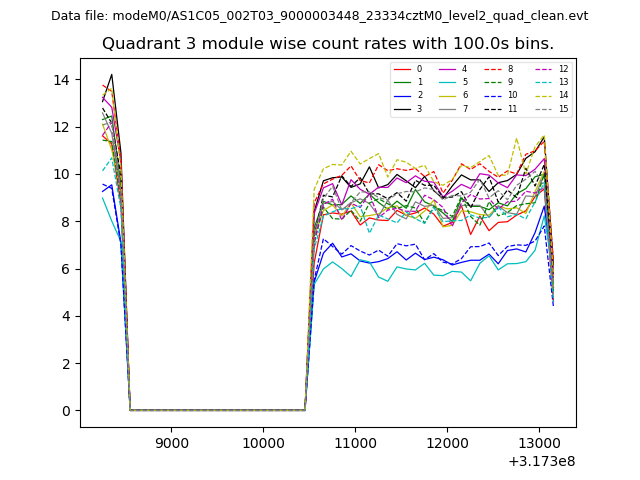
| Module-wise count rates for Quadrant D Data is divided into 100 sec bins |
 |
 |
| Parameter | Plot |
|---|---|
| CZT HV Monitor | 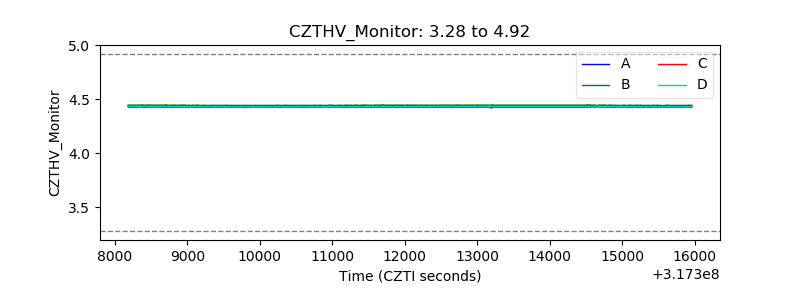 |
| D_VDD | 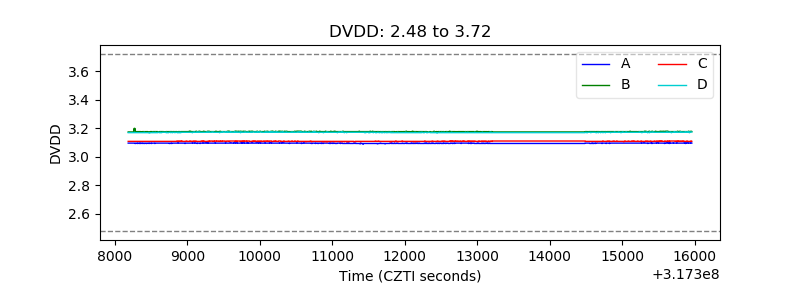 |
| Temperature 1 | 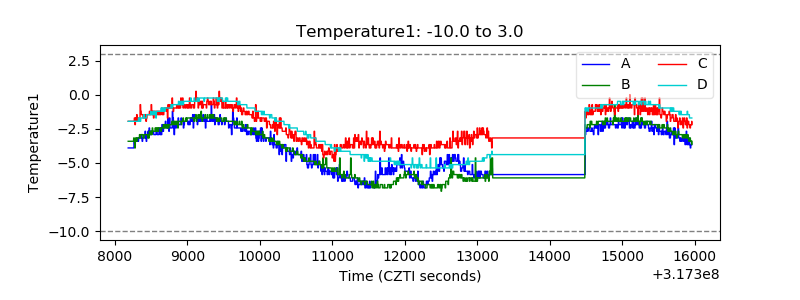 |
| Veto HV Monitor | 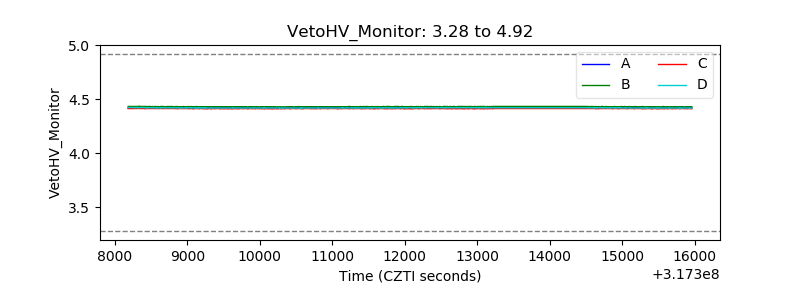 |
| Veto LLD | 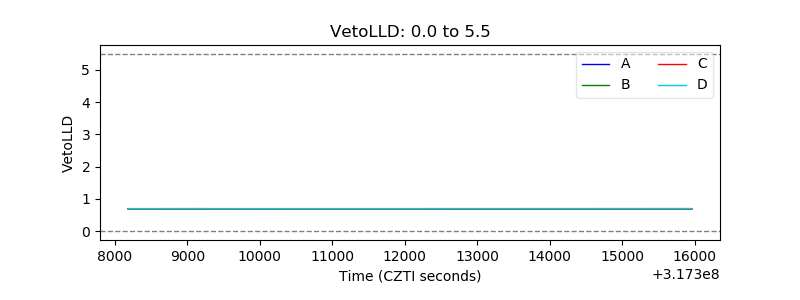 |
| Alpha Counter | 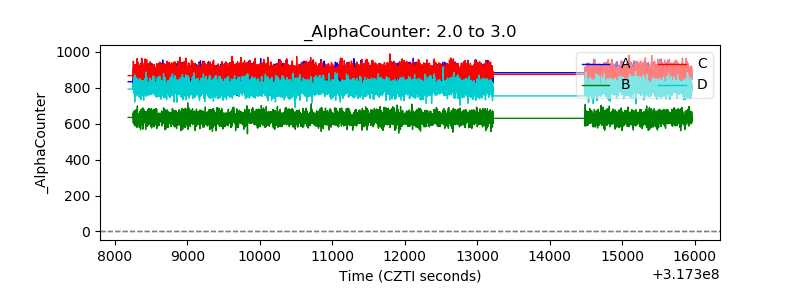 |
| _CPM_Rate | 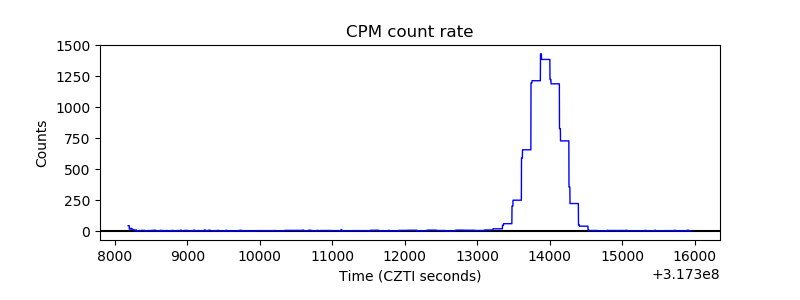 |
| CZT Counter | 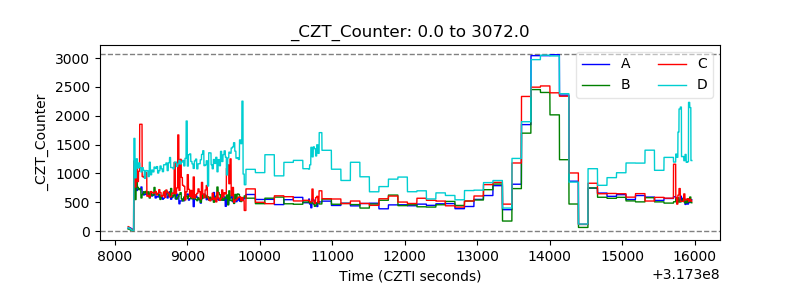 |
| +2.5 Volts monitor |  |
| +5 Volts monitor |  |
| _ROLL_ROT | 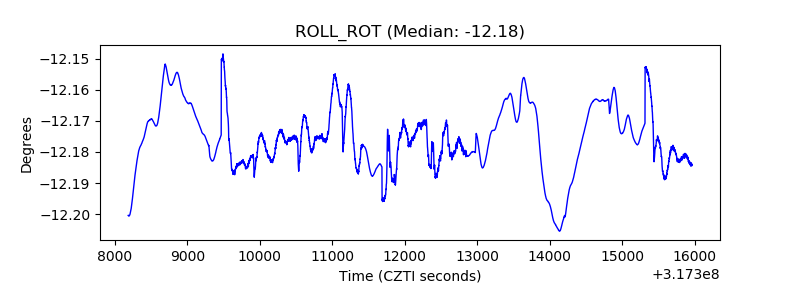 |
| _Roll_DEC | 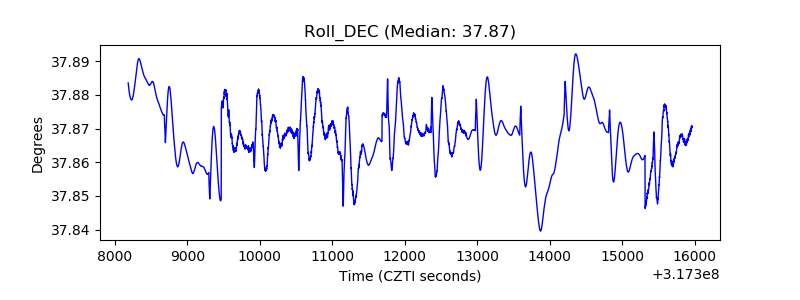 |
| _Roll_RA | 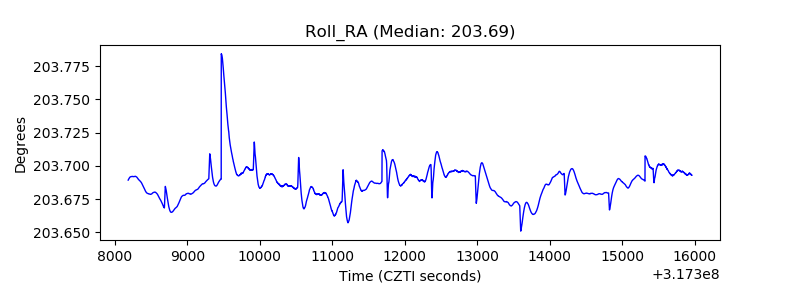 |
| Veto Counter | 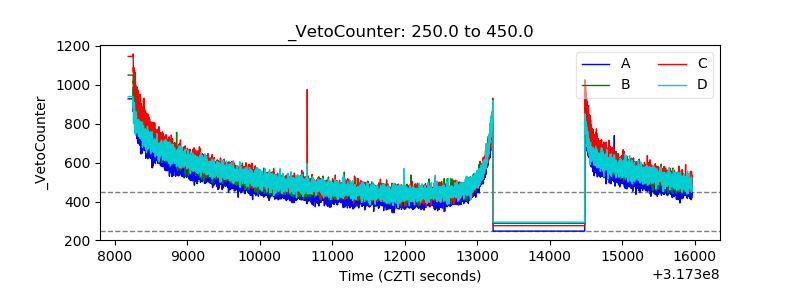 |