| Param | Original file | Final file |
|---|---|---|
| Filename | modeM0/AS1C05_002T03_9000003448_23335cztM0_level2.evt | modeM0/AS1C05_002T03_9000003448_23335cztM0_level2_quad_clean.evt |
| Size (bytes) | 211,711,680 | 9,547,200 |
| Size | 201.9 MB | 9.1 MB |
| Events in quadrant A | 1,182,291 | 33,523 |
| Events in quadrant B | 1,188,037 | 33,780 |
| Events in quadrant C | 1,268,985 | 32,602 |
| Events in quadrant D | 2,623,465 | 31,215 |
| Mode SS | |||
|---|---|---|---|
| Quadrant | BADHDUFLAG | Total packets | Discarded packets |
| A | 0 | 44 | 0 |
| B | 0 | 44 | 0 |
| C | 0 | 44 | 0 |
| D | 0 | 44 | 0 |
| Mode M0 | |||
|---|---|---|---|
| Quadrant | BADHDUFLAG | Total packets | Discarded packets |
| A | 0 | 4753 | 1 |
| B | 0 | 4791 | 1 |
| C | 0 | 5109 | 1 |
| D | 0 | 9319 | 1 |
| Mode M9 | |||
|---|---|---|---|
| Quadrant | BADHDUFLAG | Total packets | Discarded packets |
| A | 1 | 140555946560392 | 46 |
| B | 1 | -1 | -1 |
| C | 1 | -1 | -1 |
| D | 1 | -1 | -1 |
| Quadrant | Total seconds | Saturated seconds | Saturation percentage |
|---|---|---|---|
| A | 2167 | 14 | 0.646054% |
| B | 2167 | 11 | 0.507614% |
| C | 2167 | 40 | 1.845870% |
| D | 2167 | 94 | 4.337794% |
Noise dominated data is calculated using 1-second bins in cleaned event files. If a bin has >2000 counts, and if more than 50% of those come from <1% of pixels, then it is considered to be noise-dominated and hence unusable.
| Quadrant | # 1 sec bins | Bins with >0 counts | Bins with >2000 counts | High rate bins dominated by noise | Noise dominated (total time) | Noise dominated (detector-on time) | Marked lightcurve |
|---|---|---|---|---|---|---|---|
| A | 2167 | 2167 | 0 | 0 | 0.00% | 0.00% | 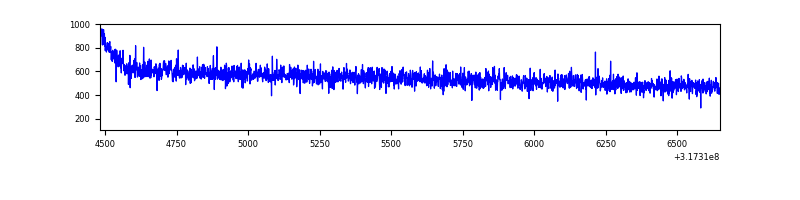 |
| B | 2167 | 2167 | 0 | 0 | 0.00% | 0.00% | 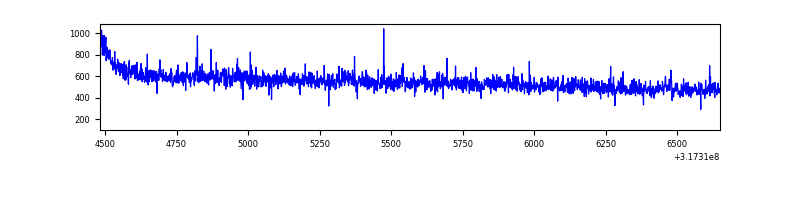 |
| C | 2167 | 2167 | 2 | 2 | 0.09% | 0.09% | 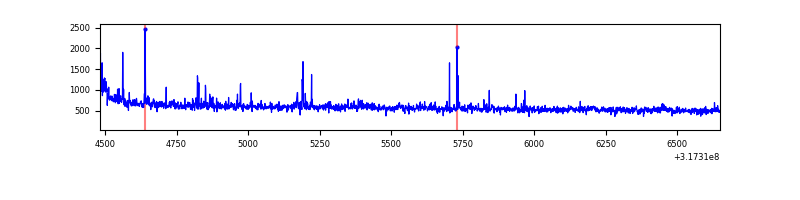 |
| D | 2167 | 2167 | 44 | 44 | 2.03% | 2.03% | 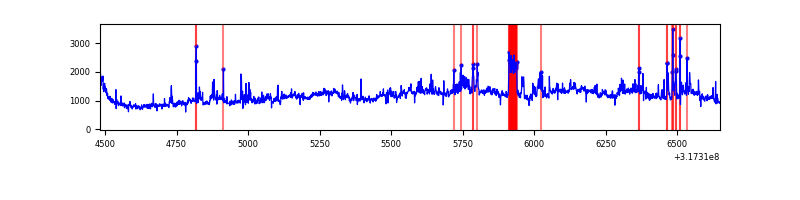 |
Top three noisy pixels from each quadrant. If the there are fewer than three noisy pixels in the level2.evt file, extra rows are filled as -1
| Pixel properties | Quadrant properties | ||||||
|---|---|---|---|---|---|---|---|
| Quadrant | DetID | PixID | Counts | Sigma | Mean | Median | Sigma |
| A | 13 | 254 | 3479 | 50.72 | 306 | 300 | 62.7 |
| A | 0 | 226 | 2652 | 37.52 | 306 | 300 | 62.7 |
| A | 3 | 137 | 2478 | 34.75 | 306 | 300 | 62.7 |
| B | 12 | 111 | 6377 | 105.84 | 301 | 295 | 57.5 |
| B | 11 | 111 | 5692 | 93.91 | 301 | 295 | 57.5 |
| B | 14 | 111 | 4659 | 75.94 | 301 | 295 | 57.5 |
| C | 10 | 9 | 54485 | 791.77 | 293 | 295 | 68.4 |
| C | 14 | 238 | 47798 | 694.07 | 293 | 295 | 68.4 |
| C | 7 | 247 | 9771 | 138.45 | 293 | 295 | 68.4 |
| D | 7 | 223 | 1249567 | 16860.92 | 297 | 287 | 74.1 |
| D | 1 | 52 | 167596 | 2258.09 | 297 | 287 | 74.1 |
| D | 12 | 233 | 50154 | 673.03 | 297 | 287 | 74.1 |
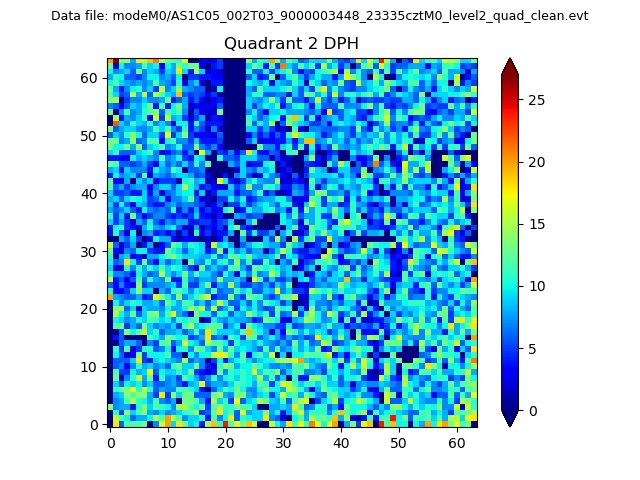
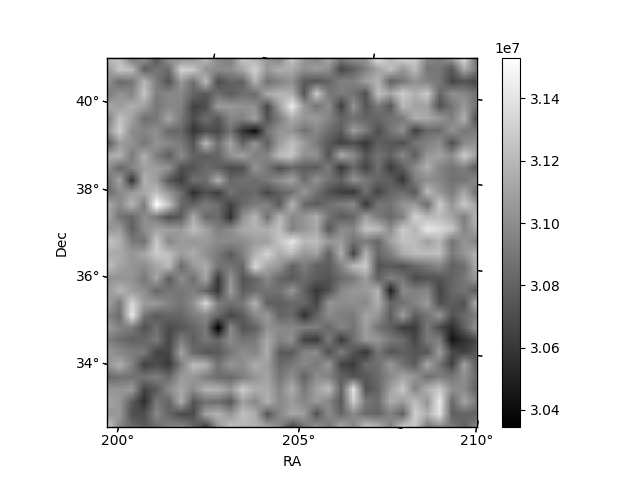
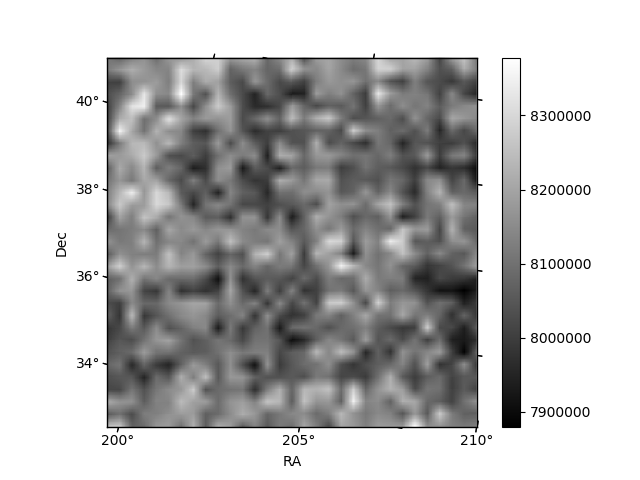
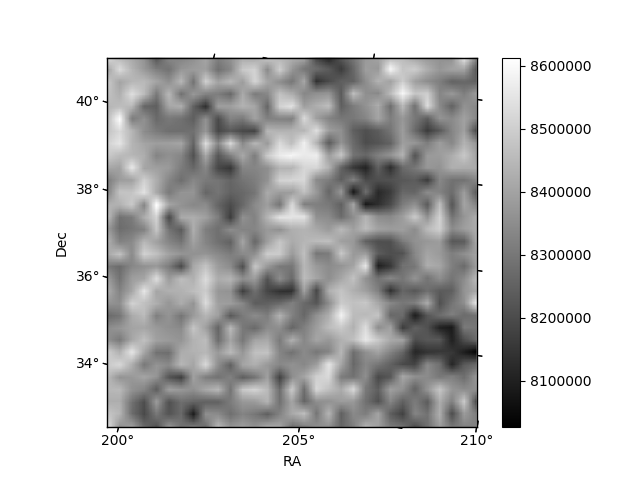
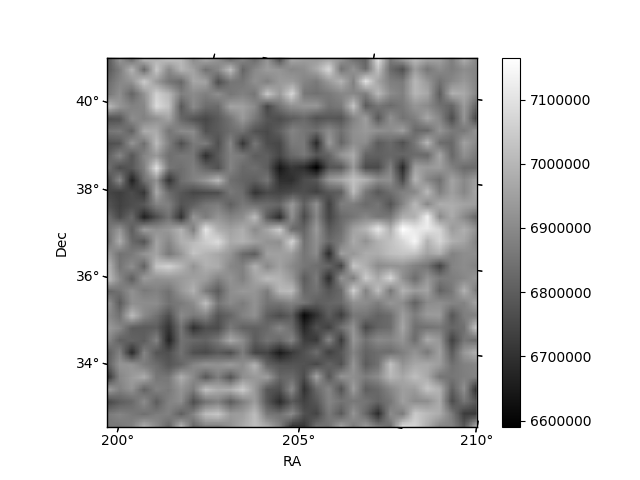
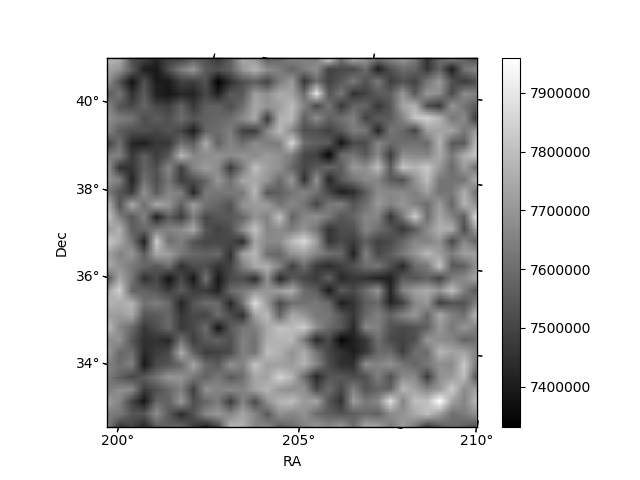
Histogram calculated using DETX and DETY for each event in the final _common_clean file
| Quadrant A | 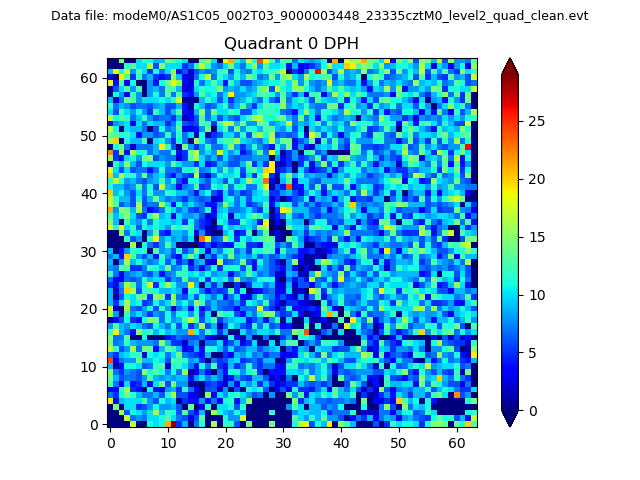 |
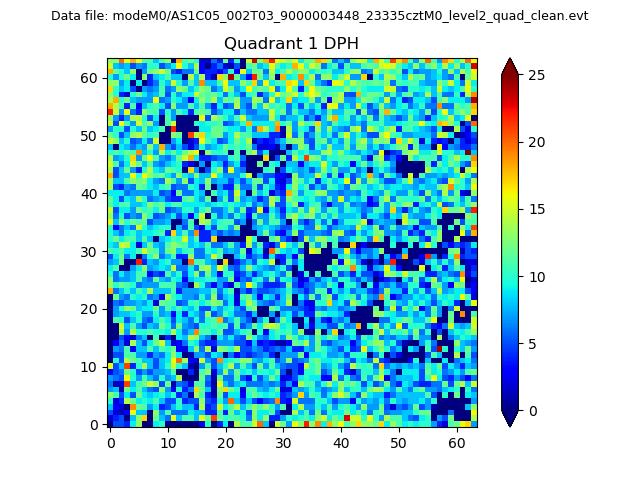 |
Quadrant B |
|---|---|---|---|
| Quadrant D | 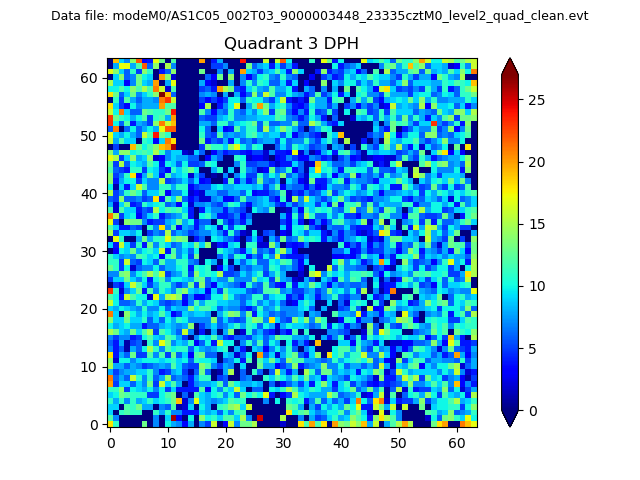 |
 |
Quadrant C |
| Plot type | Count rate plots | Images |
|---|---|---|
| Comparison with Poisson distribution Blue bars denote a histogram of data divided into 1 sec bins. Red curve is a Poisson curve with rate = median count rate of data. |
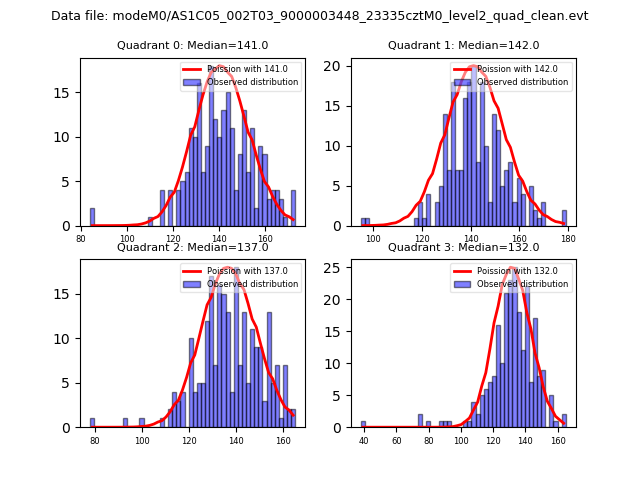 |
 |
| Quadrant-wise count rates Data is divided into 100 sec bins |
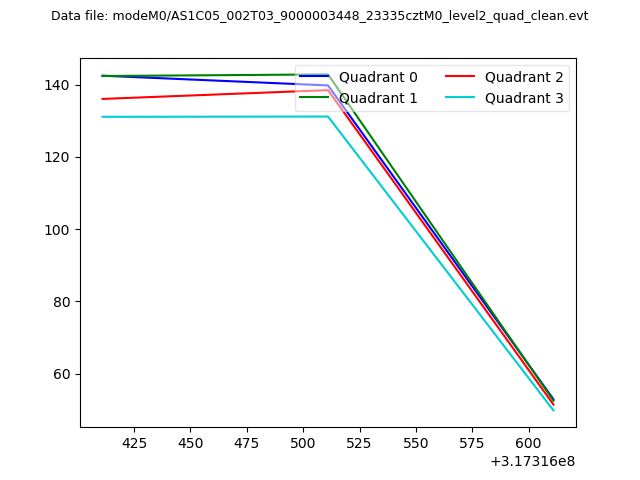 |
|
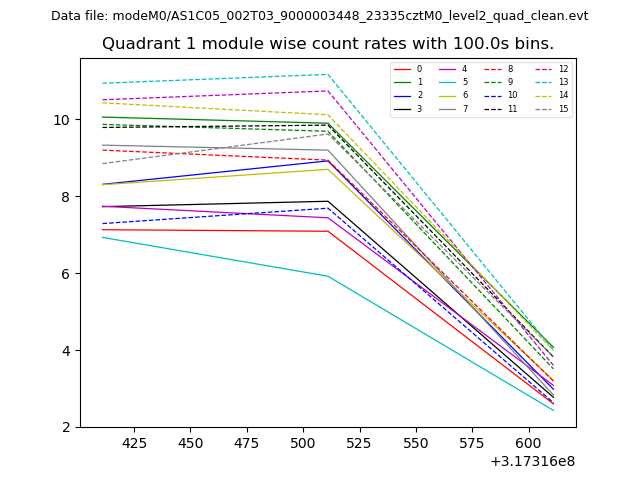
| Module-wise count rates for Quadrant A Data is divided into 100 sec bins |
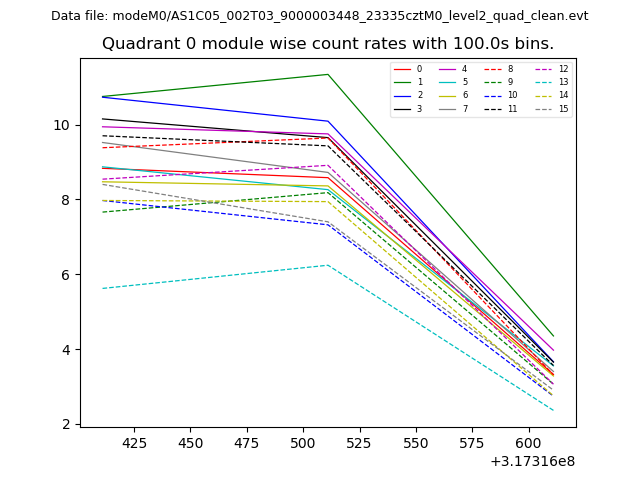 |
 |
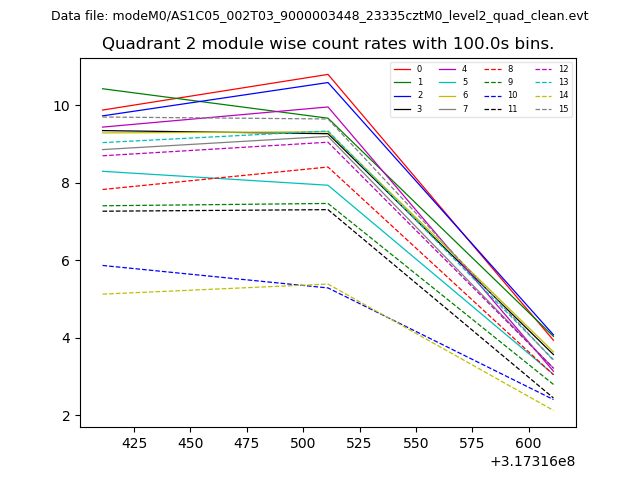
| Module-wise count rates for Quadrant B Data is divided into 100 sec bins |
 |
 |
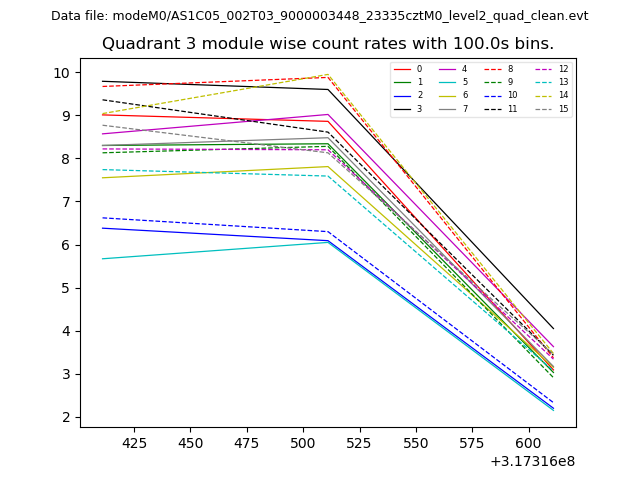
| Module-wise count rates for Quadrant C Data is divided into 100 sec bins |
 |
 |
| Module-wise count rates for Quadrant D Data is divided into 100 sec bins |
 |
 |
| Parameter | Plot |
|---|---|
| CZT HV Monitor | 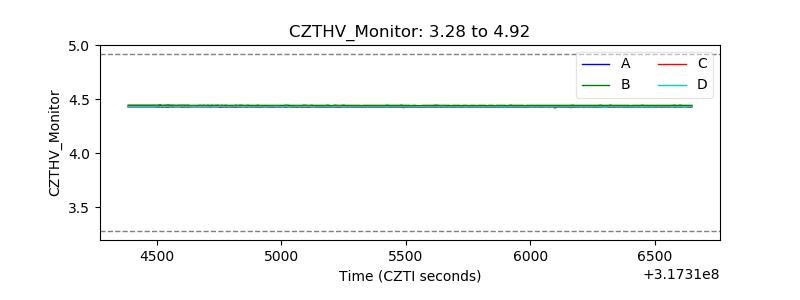 |
| D_VDD | 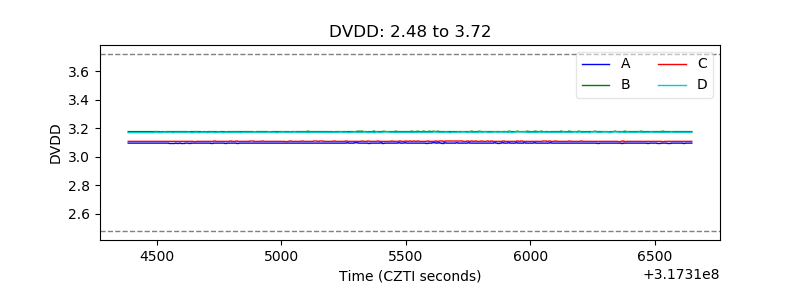 |
| Temperature 1 | 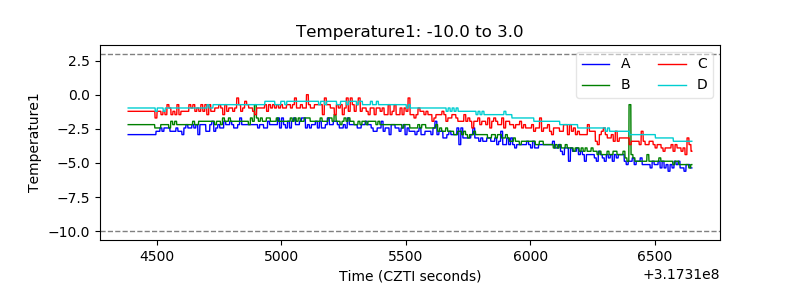 |
| Veto HV Monitor | 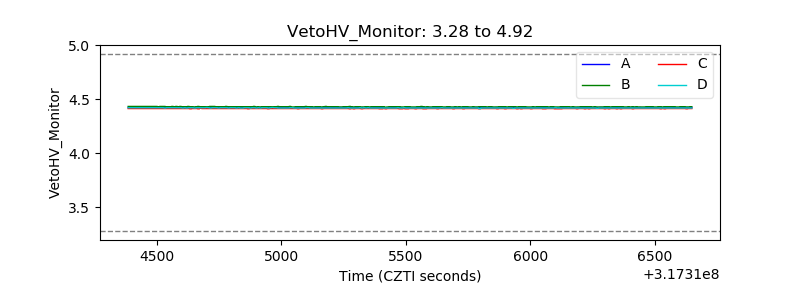 |
| Veto LLD | 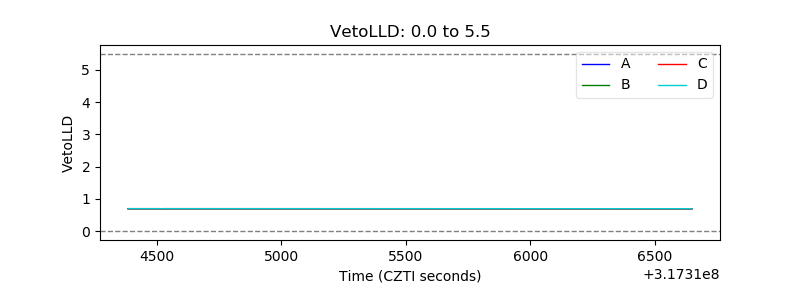 |
| Alpha Counter | 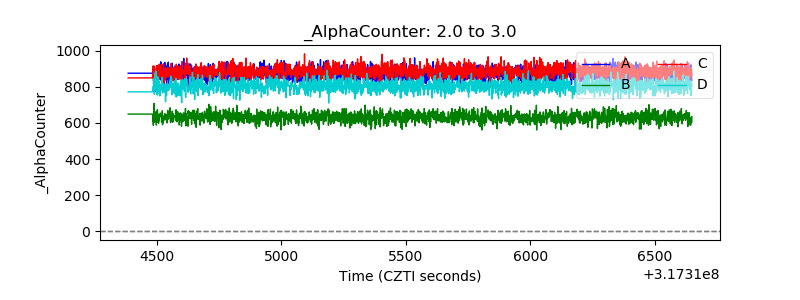 |
| _CPM_Rate | 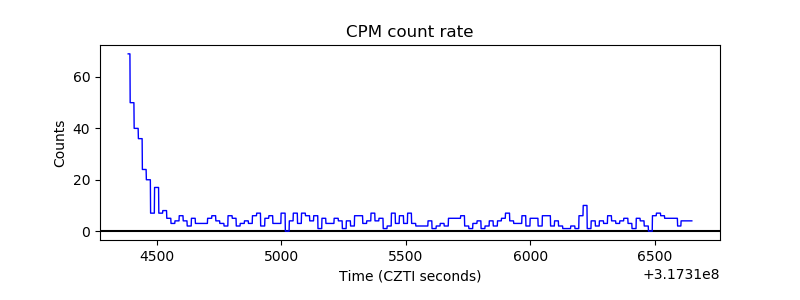 |
| CZT Counter | 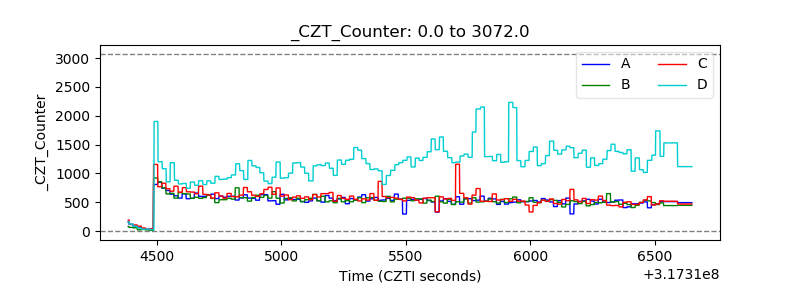 |
| +2.5 Volts monitor |  |
| +5 Volts monitor | 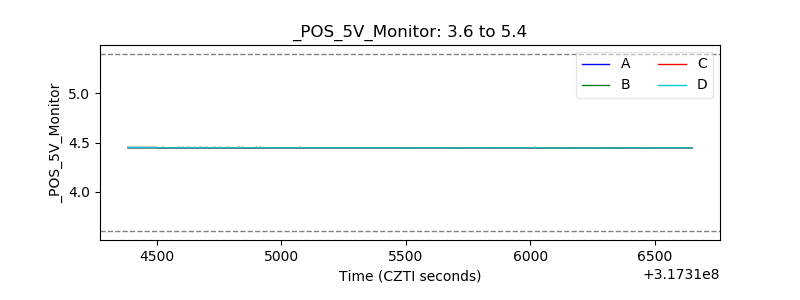 |
| _ROLL_ROT | 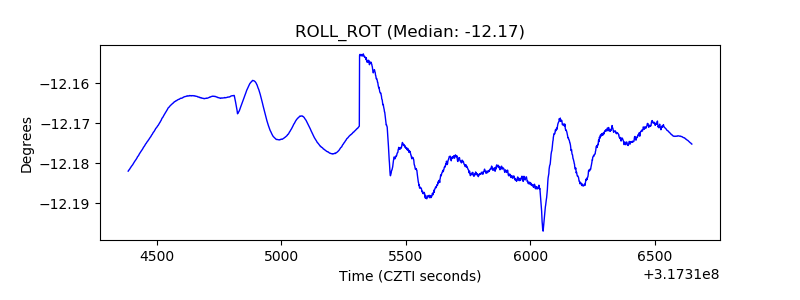 |
| _Roll_DEC |  |
| _Roll_RA | 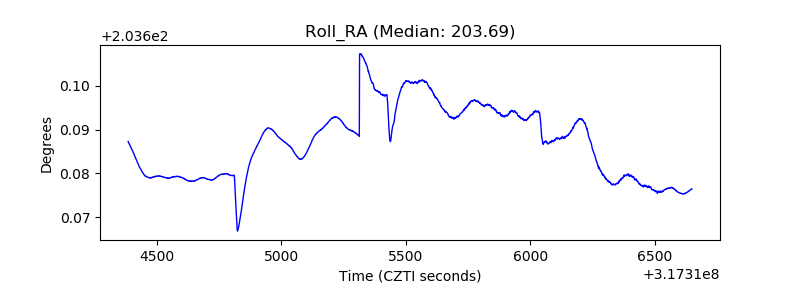 |
| Veto Counter | 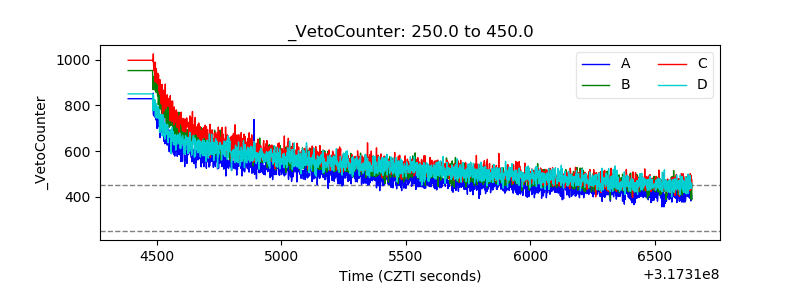 |