| Param | Original file | Final file |
|---|---|---|
| Filename | modeM0/AS1A07_135T01_9000003452cztM0_level2.fits | modeM0/AS1A07_135T01_9000003452cztM0_level2_quad_clean.evt |
| Size (bytes) | 395,853,120 | 268,735,680 |
| Size | 377.5 MB | 256.3 MB |
| Events in quadrant A | 2,477,648 | 1,434,661 |
| Events in quadrant B | 2,353,960 | 1,438,149 |
| Events in quadrant C | 2,388,204 | 1,355,125 |
| Events in quadrant D | 2,130,862 | 1,270,460 |
| Mode SS | |||
|---|---|---|---|
| Quadrant | BADHDUFLAG | Total packets | Discarded packets |
| A | 0 | 784 | 0 |
| B | 0 | 784 | 0 |
| C | 0 | 784 | 0 |
| D | 0 | 784 | 0 |
| Mode M0 | |||
|---|---|---|---|
| Quadrant | BADHDUFLAG | Total packets | Discarded packets |
| A | 0 | 80357 | 0 |
| B | 0 | 83085 | 0 |
| C | 0 | 100489 | 0 |
| D | 0 | 89660 | 0 |
| Mode M9 | |||
|---|---|---|---|
| Quadrant | BADHDUFLAG | Total packets | Discarded packets |
| A | 0 | 67 | 0 |
| B | 0 | 67 | 0 |
| C | 0 | 67 | 0 |
| D | 0 | 67 | 0 |
| Quadrant | Total seconds | Saturated seconds | Saturation percentage |
|---|---|---|---|
| A | 38412 | 281 | 0.731542% |
| B | 38408 | 469 | 1.221100% |
| C | 38410 | 1081 | 2.814371% |
| D | 38415 | 526 | 1.369257% |
Noise dominated data is calculated using 1-second bins in cleaned event files. If a bin has >2000 counts, and if more than 50% of those come from <1% of pixels, then it is considered to be noise-dominated and hence unusable.
| Quadrant | # 1 sec bins | Bins with >0 counts | Bins with >2000 counts | High rate bins dominated by noise | Noise dominated (total time) | Noise dominated (detector-on time) | Marked lightcurve |
|---|---|---|---|---|---|---|---|
| A | 45149 | 38412 | 0 | 0 | 0.00% | 0.00% |  |
| B | 45149 | 38408 | 0 | 0 | 0.00% | 0.00% |  |
| C | 45149 | 38406 | 0 | 0 | 0.00% | 0.00% |  |
| D | 45149 | 38412 | 0 | 0 | 0.00% | 0.00% |  |
Top three noisy pixels from each quadrant. If the there are fewer than three noisy pixels in the level2.evt file, extra rows are filled as -1
| Pixel properties | Quadrant properties | ||||||
|---|---|---|---|---|---|---|---|
| Quadrant | DetID | PixID | Counts | Sigma | Mean | Median | Sigma |
| A | 0 | 29 | 2303 | 10.67 | 645 | 605 | 159.1 |
| A | 7 | 110 | 1991 | 8.71 | 645 | 605 | 159.1 |
| A | 9 | 19 | 1916 | 8.24 | 645 | 605 | 159.1 |
| B | 2 | 9 | 1869 | 10.17 | 622 | 594 | 125.4 |
| B | 2 | 8 | 1584 | 7.9 | 622 | 594 | 125.4 |
| B | 5 | 128 | 1573 | 7.81 | 622 | 594 | 125.4 |
| C | 1 | 80 | 1823 | 7.61 | 631 | 595 | 161.4 |
| C | 1 | 81 | 1793 | 7.42 | 631 | 595 | 161.4 |
| C | 3 | 126 | 1661 | 6.6 | 631 | 595 | 161.4 |
| D | 6 | 67 | 1543 | 6.07 | 609 | 555 | 162.7 |
| D | 3 | 14 | 1490 | 5.75 | 609 | 555 | 162.7 |
| D | 7 | 3 | 1467 | 5.6 | 609 | 555 | 162.7 |
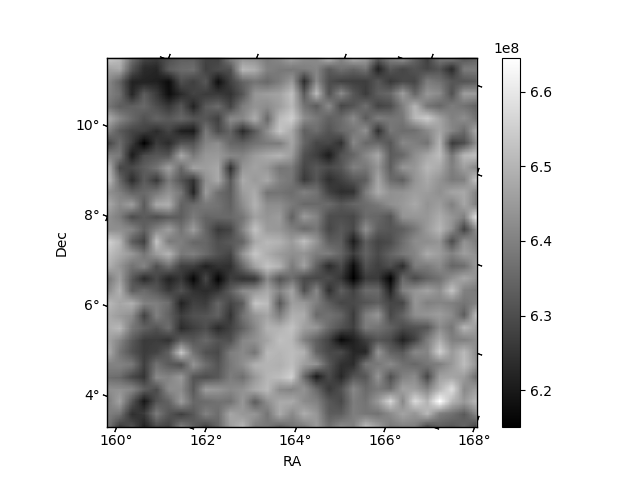
Histogram calculated using DETX and DETY for each event in the final _common_clean file
| Quadrant A | 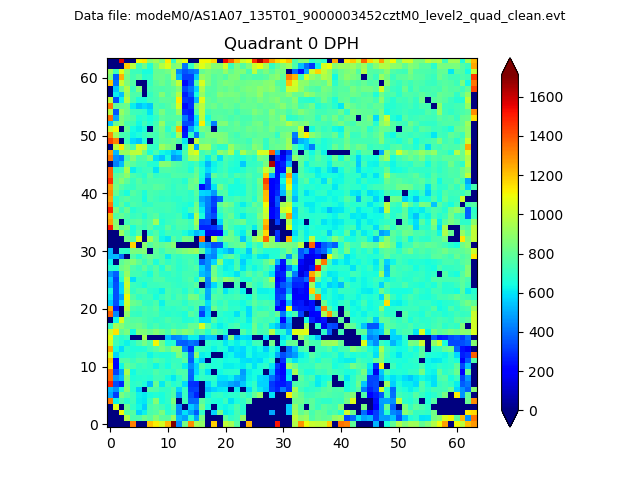 |
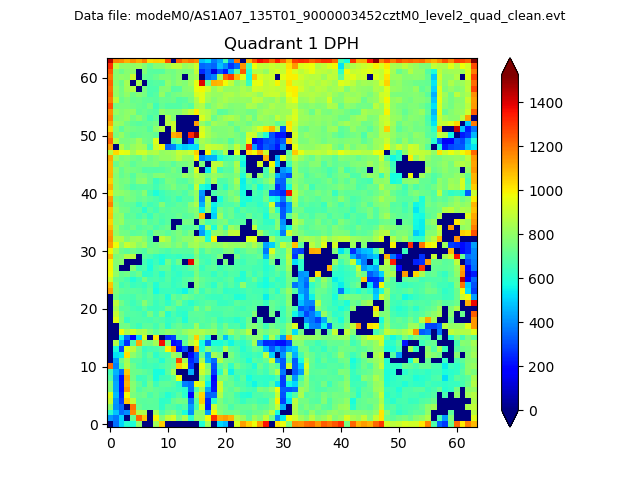 |
Quadrant B |
|---|---|---|---|
| Quadrant D |  |
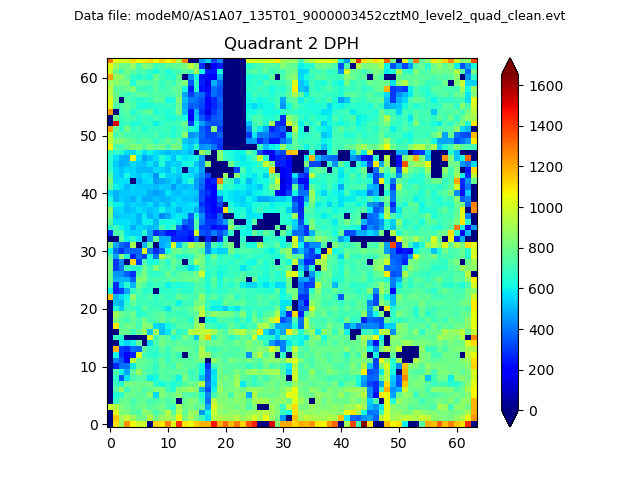 |
Quadrant C |
| Plot type | Count rate plots | Images |
|---|---|---|
| Comparison with Poisson distribution Blue bars denote a histogram of data divided into 1 sec bins. Red curve is a Poisson curve with rate = median count rate of data. |
 |
 |
| Quadrant-wise count rates Data is divided into 100 sec bins |
 |
|
| Module-wise count rates for Quadrant A Data is divided into 100 sec bins |
 |
 |
| Module-wise count rates for Quadrant B Data is divided into 100 sec bins |
 |
 |
| Module-wise count rates for Quadrant C Data is divided into 100 sec bins |
 |
 |
| Module-wise count rates for Quadrant D Data is divided into 100 sec bins |
 |
 |
| Parameter | Plot |
|---|---|
| CZT HV Monitor |  |
| D_VDD |  |
| Temperature 1 |  |
| Veto HV Monitor |  |
| Veto LLD |  |
| Alpha Counter |  |
| _CPM_Rate |  |
| CZT Counter |  |
| +2.5 Volts monitor |  |
| +5 Volts monitor |  |
| _ROLL_ROT | 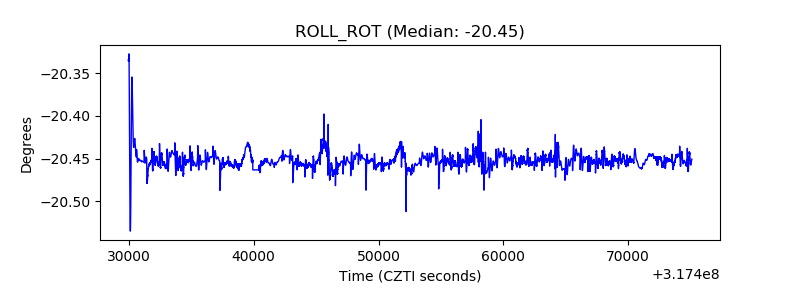 |
| _Roll_DEC |  |
| _Roll_RA |  |
| Veto Counter |  |