| Param | Original file | Final file |
|---|---|---|
| Filename | modeM0/AS1A07_135T01_9000003452_23357cztM0_level2.evt | modeM0/AS1A07_135T01_9000003452_23357cztM0_level2_quad_clean.evt |
| Size (bytes) | 533,937,600 | 93,568,320 |
| Size | 509.2 MB | 89.2 MB |
| Events in quadrant A | 3,211,537 | 600,315 |
| Events in quadrant B | 3,304,607 | 612,385 |
| Events in quadrant C | 5,479,899 | 578,550 |
| Events in quadrant D | 3,720,786 | 575,943 |
| Mode SS | |||
|---|---|---|---|
| Quadrant | BADHDUFLAG | Total packets | Discarded packets |
| A | 0 | 136 | 0 |
| B | 0 | 136 | 0 |
| C | 0 | 136 | 0 |
| D | 0 | 136 | 0 |
| Mode M0 | |||
|---|---|---|---|
| Quadrant | BADHDUFLAG | Total packets | Discarded packets |
| A | 0 | 13625 | 2 |
| B | 0 | 13797 | 2 |
| C | 0 | 20890 | 2 |
| D | 0 | 15259 | 2 |
| Mode M9 | |||
|---|---|---|---|
| Quadrant | BADHDUFLAG | Total packets | Discarded packets |
| A | 0 | 10 | 0 |
| B | 0 | 10 | 0 |
| C | 0 | 10 | 0 |
| D | 0 | 10 | 0 |
| Quadrant | Total seconds | Saturated seconds | Saturation percentage |
|---|---|---|---|
| A | 6689 | 30 | 0.448498% |
| B | 6690 | 37 | 0.553064% |
| C | 6690 | 263 | 3.931241% |
| D | 6690 | 104 | 1.554559% |
Noise dominated data is calculated using 1-second bins in cleaned event files. If a bin has >2000 counts, and if more than 50% of those come from <1% of pixels, then it is considered to be noise-dominated and hence unusable.
| Quadrant | # 1 sec bins | Bins with >0 counts | Bins with >2000 counts | High rate bins dominated by noise | Noise dominated (total time) | Noise dominated (detector-on time) | Marked lightcurve |
|---|---|---|---|---|---|---|---|
| A | 7689 | 6689 | 0 | 0 | 0.00% | 0.00% | 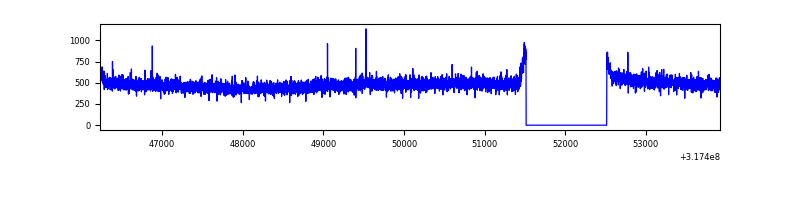 |
| B | 7690 | 6690 | 3 | 3 | 0.04% | 0.04% | 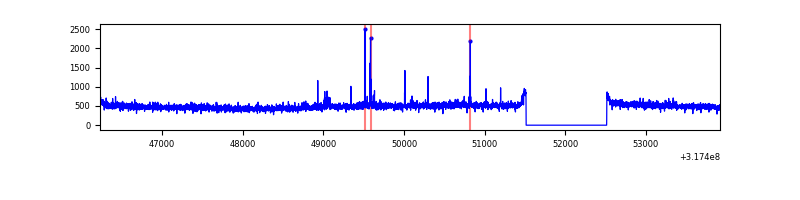 |
| C | 7690 | 6690 | 64 | 64 | 0.83% | 0.96% | 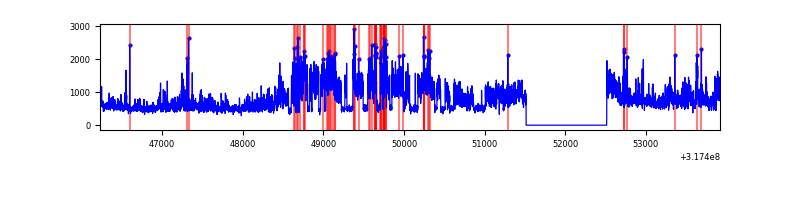 |
| D | 7690 | 6690 | 77 | 77 | 1.00% | 1.15% | 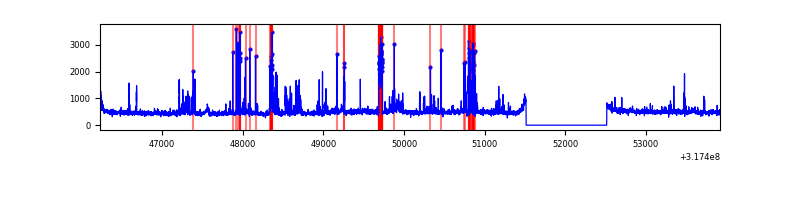 |
Top three noisy pixels from each quadrant. If the there are fewer than three noisy pixels in the level2.evt file, extra rows are filled as -1
| Pixel properties | Quadrant properties | ||||||
|---|---|---|---|---|---|---|---|
| Quadrant | DetID | PixID | Counts | Sigma | Mean | Median | Sigma |
| A | 13 | 254 | 9795 | 53.24 | 832 | 814 | 168.7 |
| A | 0 | 226 | 7178 | 37.72 | 832 | 814 | 168.7 |
| A | 3 | 137 | 7118 | 37.37 | 832 | 814 | 168.7 |
| B | 0 | 189 | 24819 | 152.71 | 825 | 806 | 157.2 |
| B | 12 | 111 | 19237 | 117.21 | 825 | 806 | 157.2 |
| B | 11 | 111 | 17248 | 104.56 | 825 | 806 | 157.2 |
| C | 0 | 239 | 2202813 | 11814.38 | 791 | 797 | 186.4 |
| C | 14 | 238 | 124101 | 661.56 | 791 | 797 | 186.4 |
| C | 7 | 247 | 41420 | 217.95 | 791 | 797 | 186.4 |
| D | 1 | 52 | 470924 | 2359.25 | 809 | 784 | 199.3 |
| D | 2 | 152 | 92718 | 461.34 | 809 | 784 | 199.3 |
| D | 12 | 233 | 32763 | 160.48 | 809 | 784 | 199.3 |
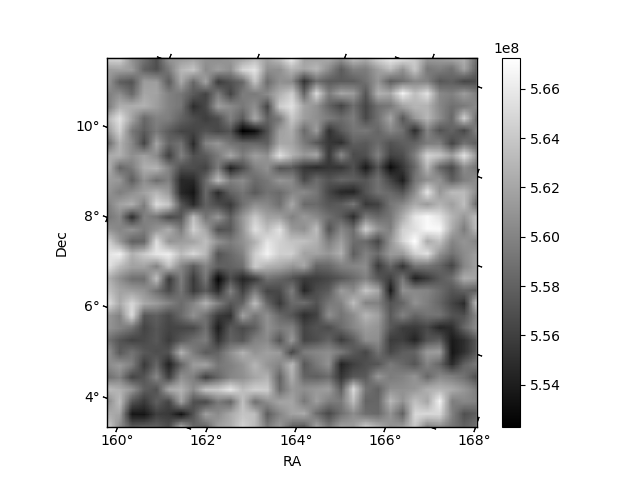
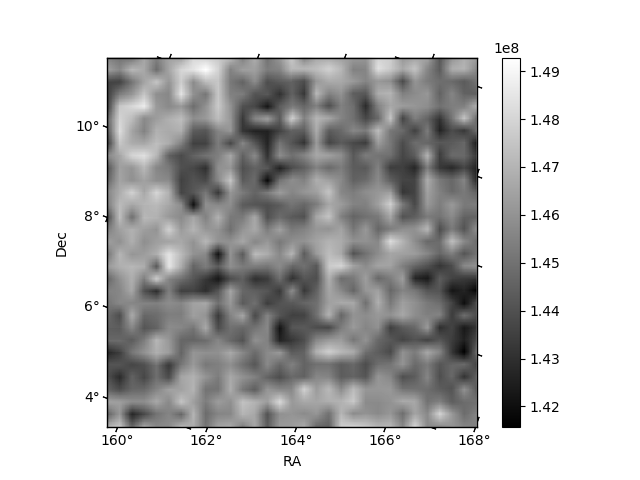
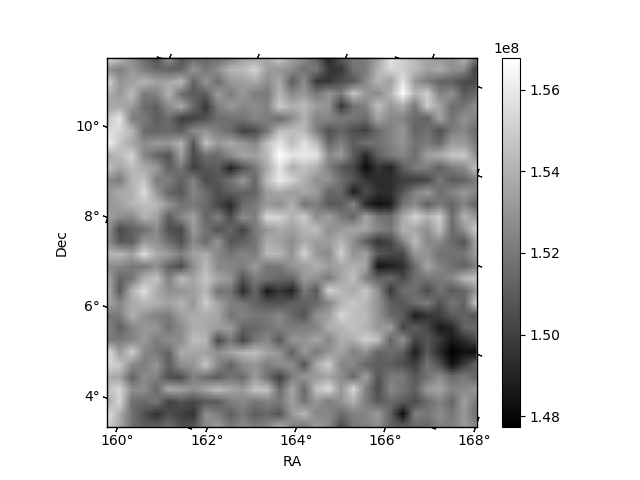
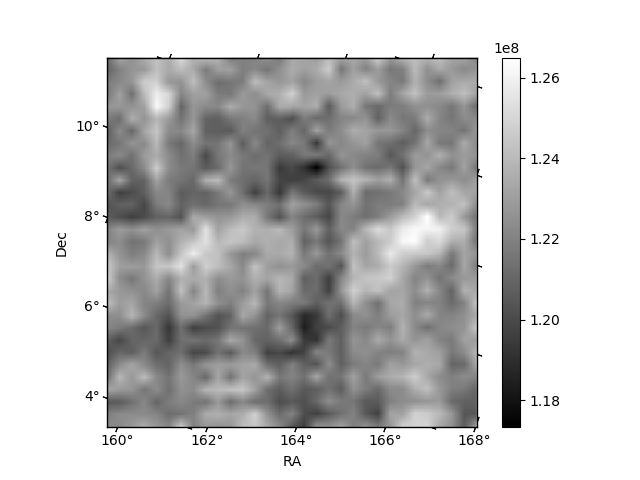
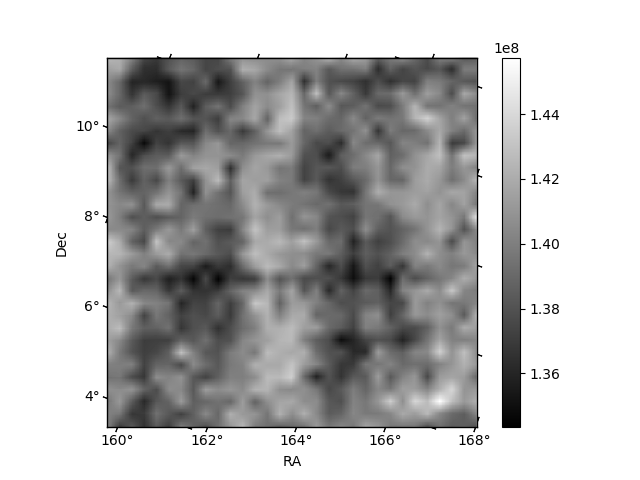
Histogram calculated using DETX and DETY for each event in the final _common_clean file
| Quadrant A | 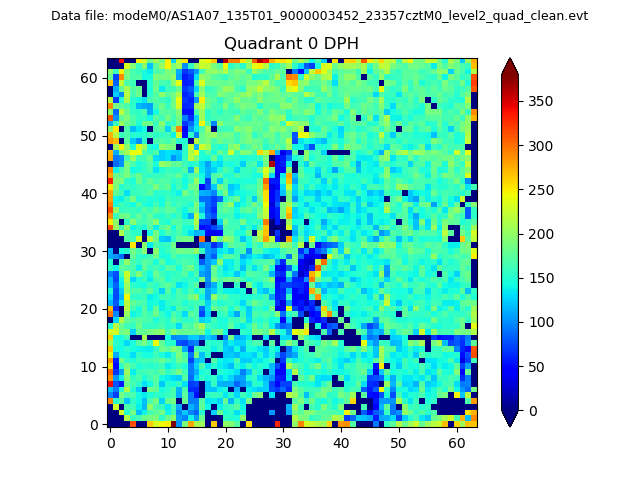 |
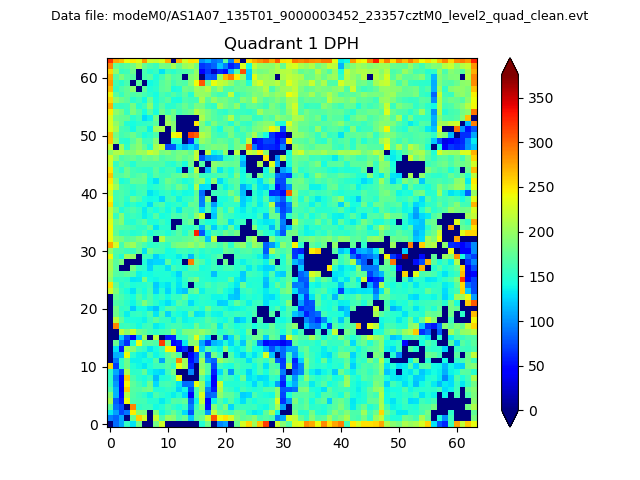 |
Quadrant B |
|---|---|---|---|
| Quadrant D | 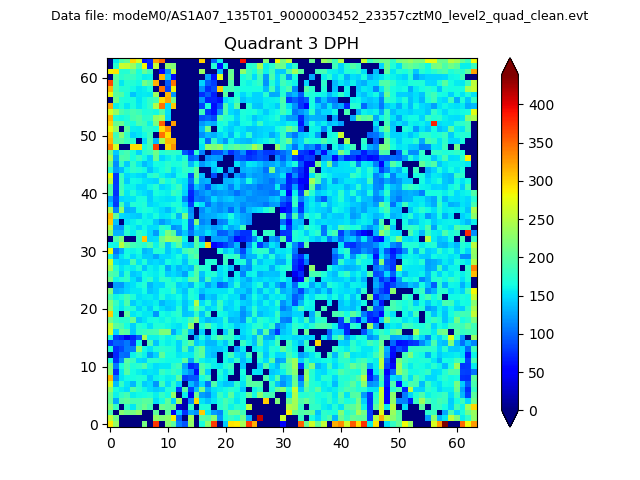 |
 |
Quadrant C |
| Plot type | Count rate plots | Images |
|---|---|---|
| Comparison with Poisson distribution Blue bars denote a histogram of data divided into 1 sec bins. Red curve is a Poisson curve with rate = median count rate of data. |
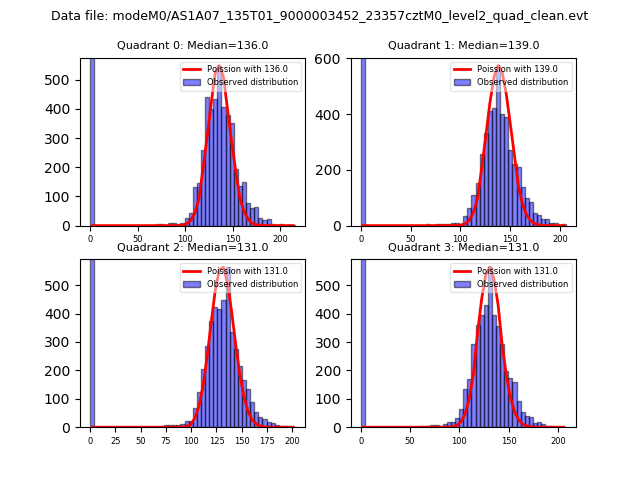 |
 |
| Quadrant-wise count rates Data is divided into 100 sec bins |
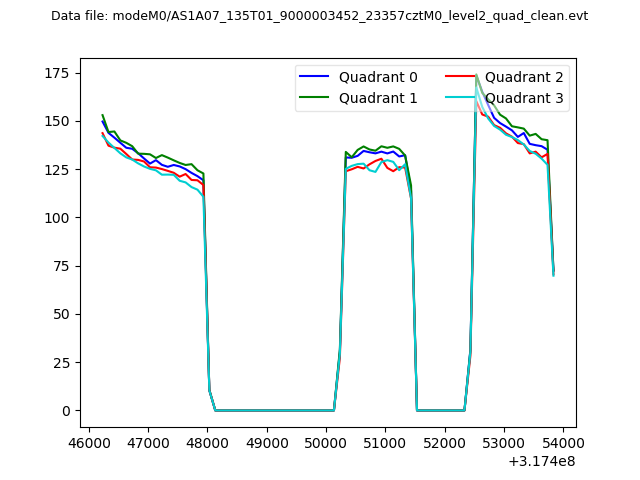 |
|
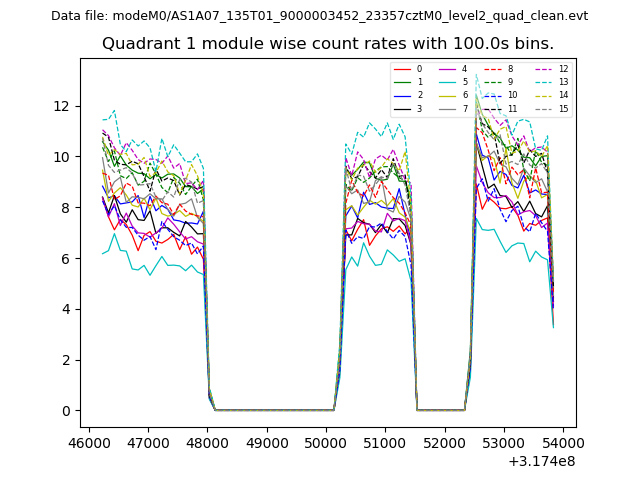
| Module-wise count rates for Quadrant A Data is divided into 100 sec bins |
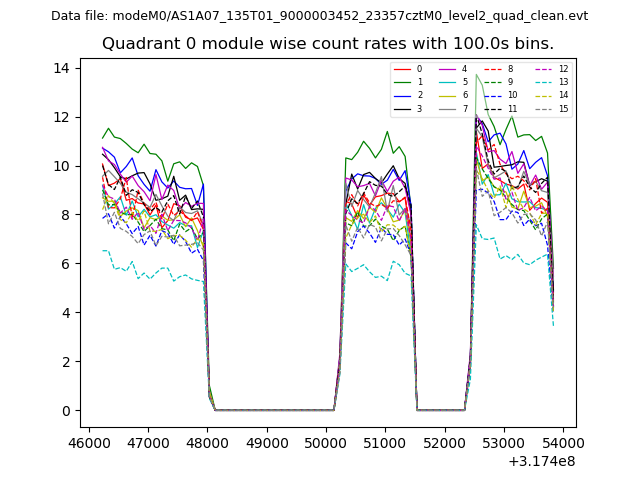 |
 |
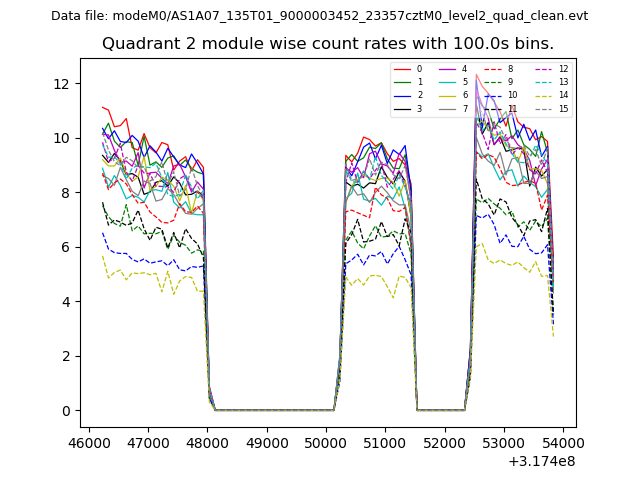
| Module-wise count rates for Quadrant B Data is divided into 100 sec bins |
 |
 |
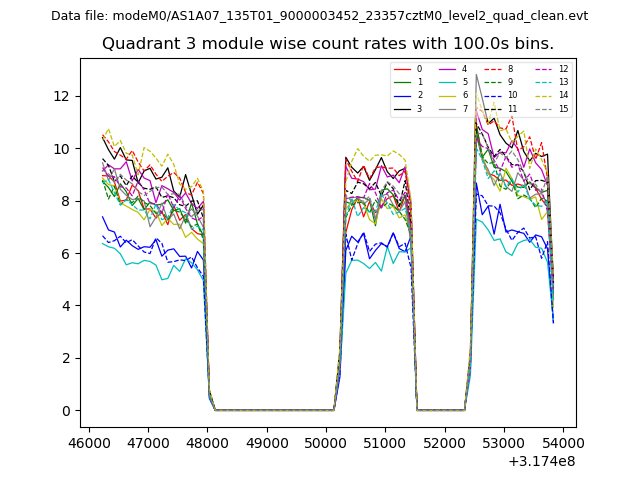
| Module-wise count rates for Quadrant C Data is divided into 100 sec bins |
 |
 |
| Module-wise count rates for Quadrant D Data is divided into 100 sec bins |
 |
 |
| Parameter | Plot |
|---|---|
| CZT HV Monitor | 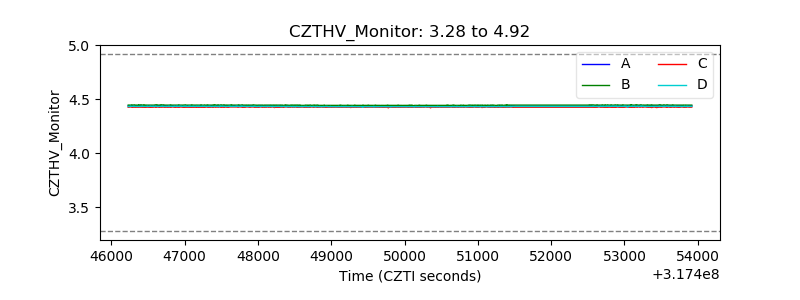 |
| D_VDD | 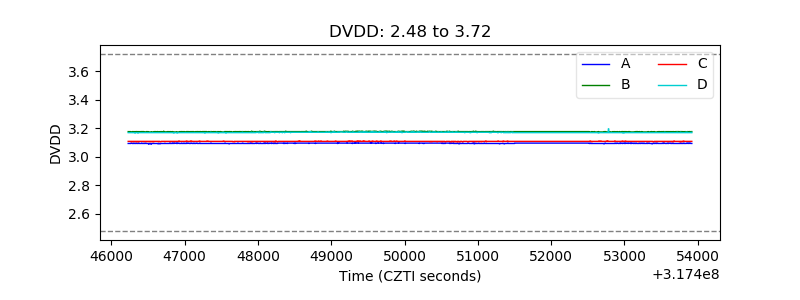 |
| Temperature 1 | 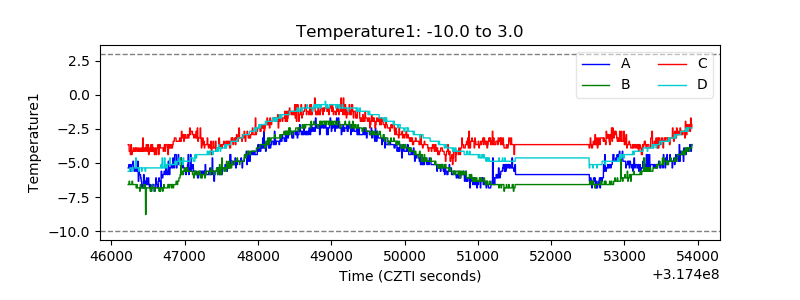 |
| Veto HV Monitor | 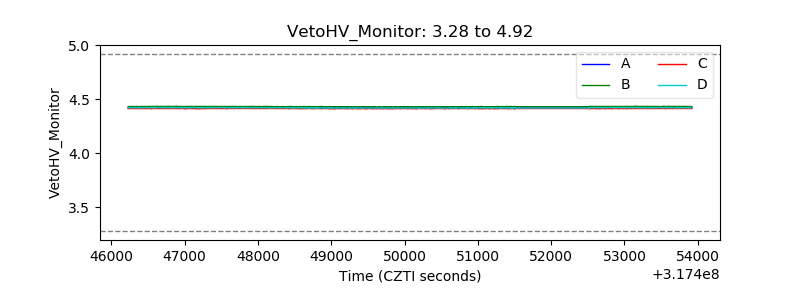 |
| Veto LLD | 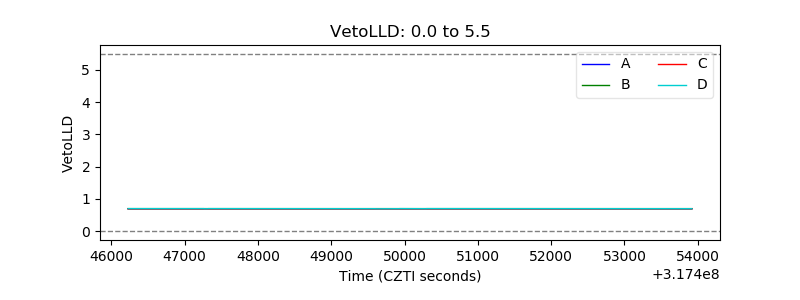 |
| Alpha Counter | 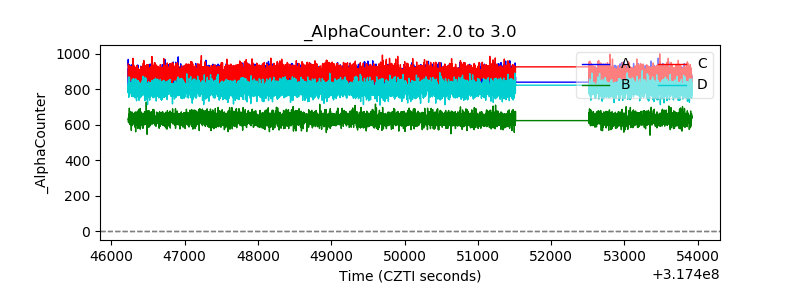 |
| _CPM_Rate | 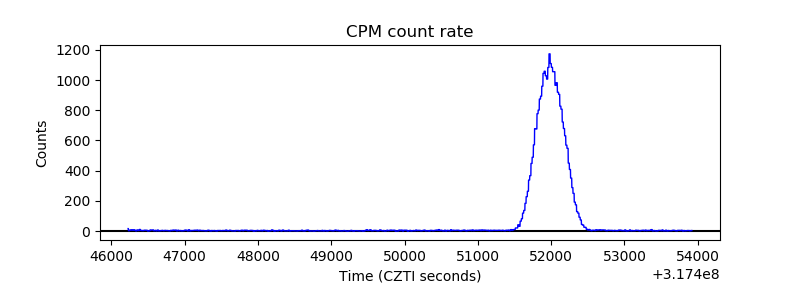 |
| CZT Counter | 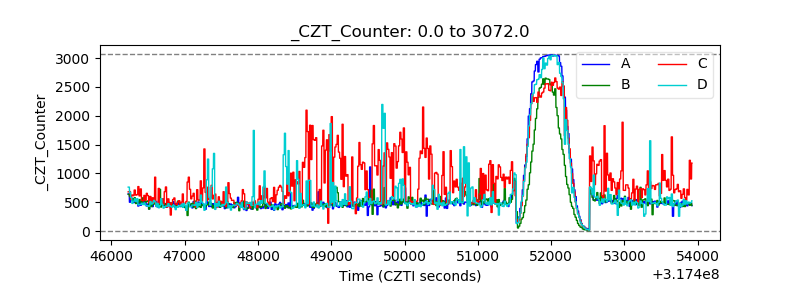 |
| +2.5 Volts monitor | 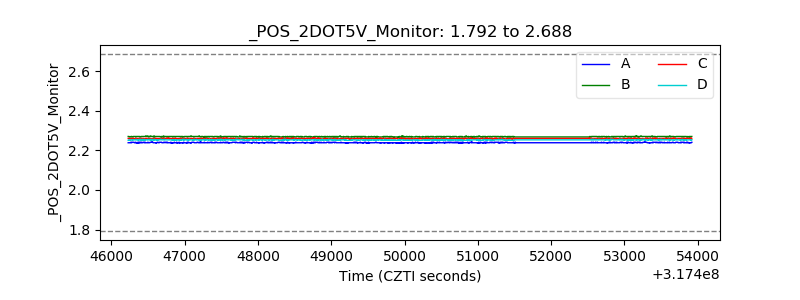 |
| +5 Volts monitor |  |
| _ROLL_ROT | 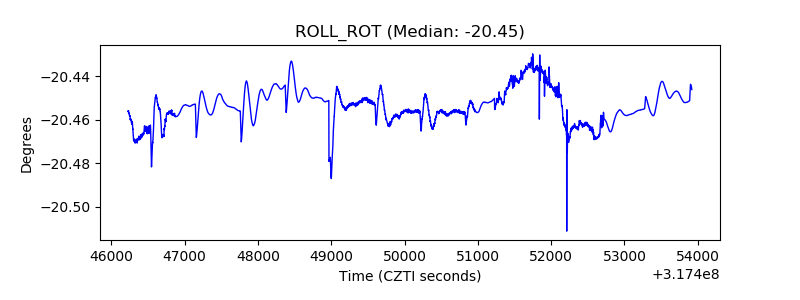 |
| _Roll_DEC | 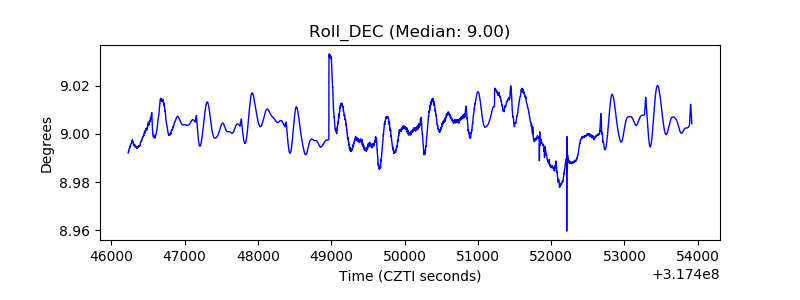 |
| _Roll_RA | 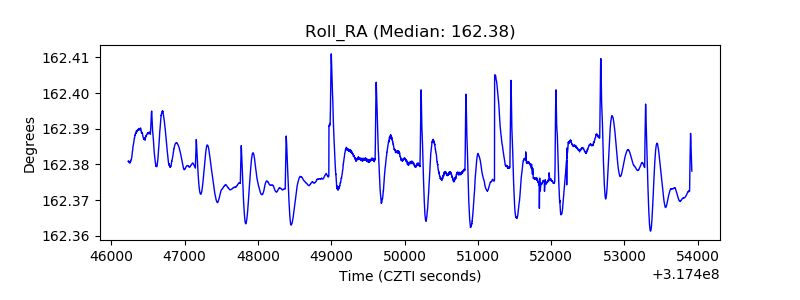 |
| Veto Counter | 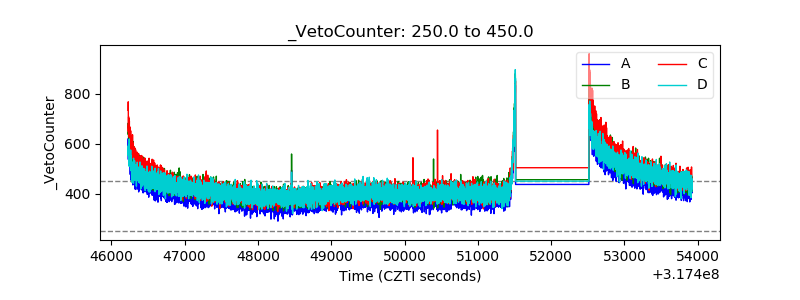 |