| Param | Original file | Final file |
|---|---|---|
| Filename | modeM0/AS1A07_135T01_9000003452_23359cztM0_level2.evt | modeM0/AS1A07_135T01_9000003452_23359cztM0_level2_quad_clean.evt |
| Size (bytes) | 477,406,080 | 77,837,760 |
| Size | 455.3 MB | 74.2 MB |
| Events in quadrant A | 2,978,306 | 492,385 |
| Events in quadrant B | 3,098,847 | 500,442 |
| Events in quadrant C | 4,739,170 | 475,860 |
| Events in quadrant D | 3,239,513 | 473,748 |
| Mode SS | |||
|---|---|---|---|
| Quadrant | BADHDUFLAG | Total packets | Discarded packets |
| A | 0 | 118 | 0 |
| B | 0 | 118 | 0 |
| C | 0 | 118 | 0 |
| D | 0 | 118 | 0 |
| Mode M0 | |||
|---|---|---|---|
| Quadrant | BADHDUFLAG | Total packets | Discarded packets |
| A | 0 | 12430 | 1 |
| B | 0 | 12718 | 1 |
| C | 0 | 18139 | 1 |
| D | 0 | 13204 | 1 |
| Mode M9 | |||
|---|---|---|---|
| Quadrant | BADHDUFLAG | Total packets | Discarded packets |
| A | 0 | 12 | 0 |
| B | 0 | 12 | 0 |
| C | 0 | 12 | 0 |
| D | 0 | 12 | 0 |
| Quadrant | Total seconds | Saturated seconds | Saturation percentage |
|---|---|---|---|
| A | 5943 | 47 | 0.790846% |
| B | 5944 | 53 | 0.891655% |
| C | 5944 | 176 | 2.960969% |
| D | 5943 | 53 | 0.891805% |
Noise dominated data is calculated using 1-second bins in cleaned event files. If a bin has >2000 counts, and if more than 50% of those come from <1% of pixels, then it is considered to be noise-dominated and hence unusable.
| Quadrant | # 1 sec bins | Bins with >0 counts | Bins with >2000 counts | High rate bins dominated by noise | Noise dominated (total time) | Noise dominated (detector-on time) | Marked lightcurve |
|---|---|---|---|---|---|---|---|
| A | 7063 | 5943 | 0 | 0 | 0.00% | 0.00% | 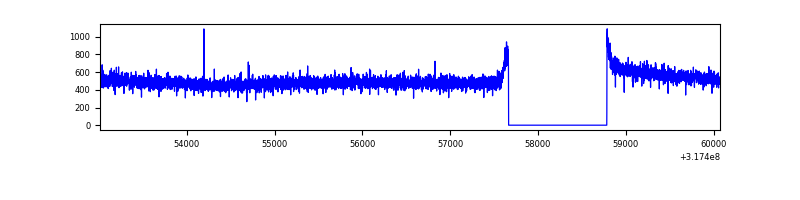 |
| B | 7064 | 5944 | 1 | 1 | 0.01% | 0.02% |  |
| C | 7064 | 5944 | 22 | 22 | 0.31% | 0.37% | 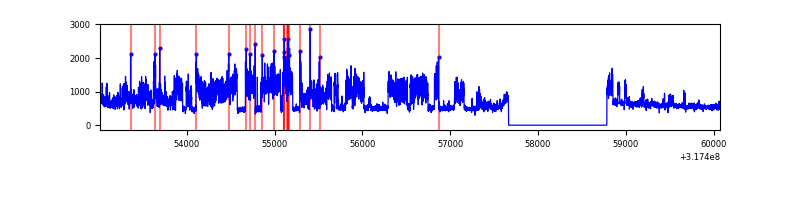 |
| D | 7063 | 5943 | 17 | 17 | 0.24% | 0.29% | 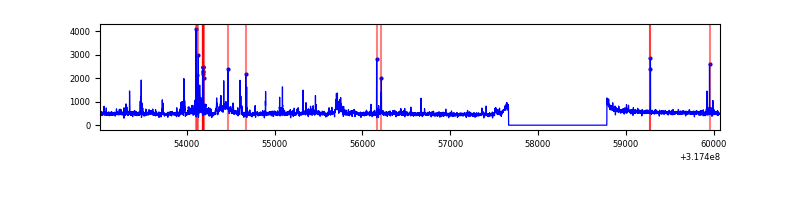 |
Top three noisy pixels from each quadrant. If the there are fewer than three noisy pixels in the level2.evt file, extra rows are filled as -1
| Pixel properties | Quadrant properties | ||||||
|---|---|---|---|---|---|---|---|
| Quadrant | DetID | PixID | Counts | Sigma | Mean | Median | Sigma |
| A | 13 | 254 | 8869 | 52.36 | 772 | 756 | 154.9 |
| A | 0 | 226 | 6787 | 38.92 | 772 | 756 | 154.9 |
| A | 3 | 137 | 6500 | 37.07 | 772 | 756 | 154.9 |
| B | 0 | 189 | 35786 | 242.92 | 761 | 742 | 144.3 |
| B | 0 | 229 | 27708 | 186.92 | 761 | 742 | 144.3 |
| B | 0 | 190 | 19506 | 130.07 | 761 | 742 | 144.3 |
| C | 0 | 239 | 1650564 | 9559.35 | 738 | 746 | 172.6 |
| C | 14 | 238 | 116893 | 672.98 | 738 | 746 | 172.6 |
| C | 7 | 247 | 73766 | 423.09 | 738 | 746 | 172.6 |
| D | 12 | 227 | 119958 | 641.41 | 756 | 735 | 185.9 |
| D | 1 | 52 | 96297 | 514.12 | 756 | 735 | 185.9 |
| D | 2 | 152 | 84944 | 453.04 | 756 | 735 | 185.9 |
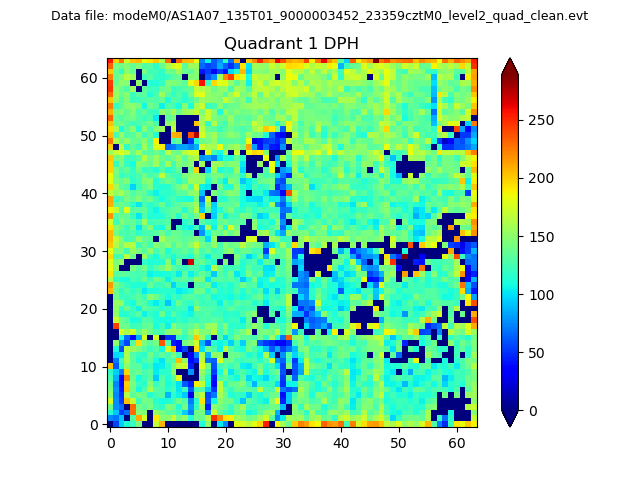
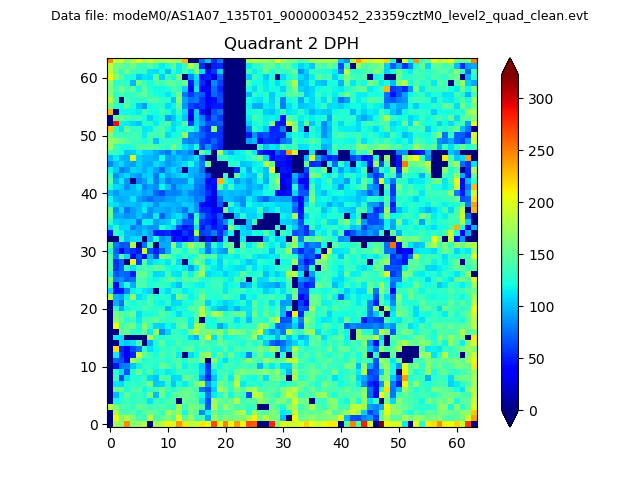
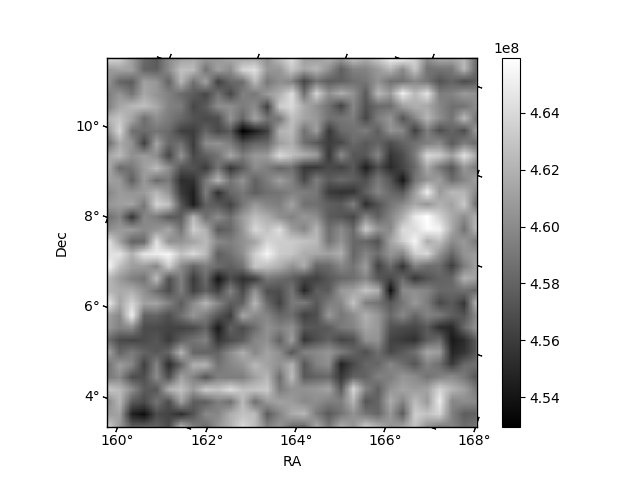
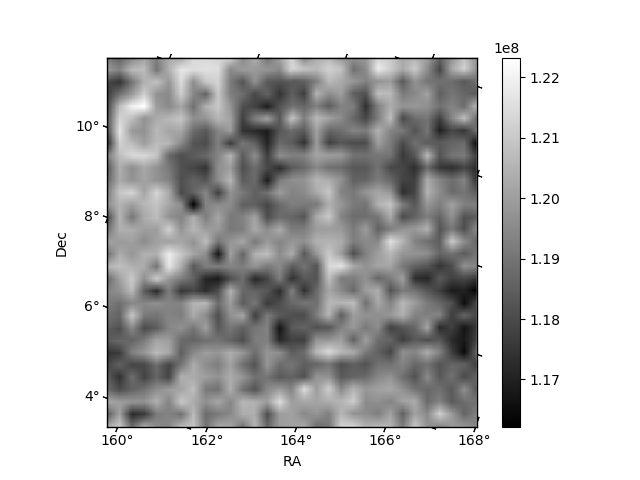
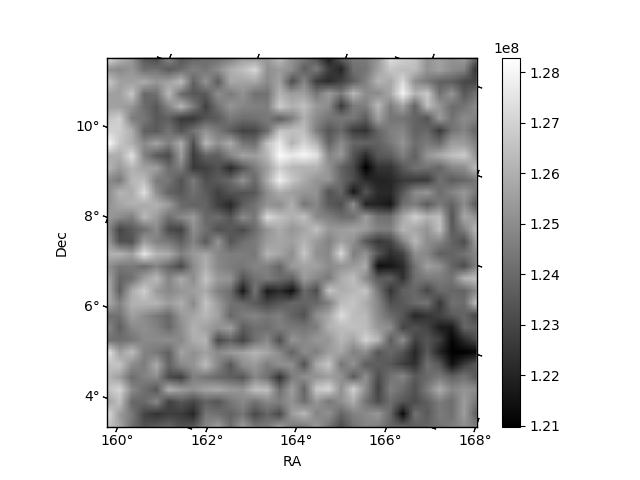
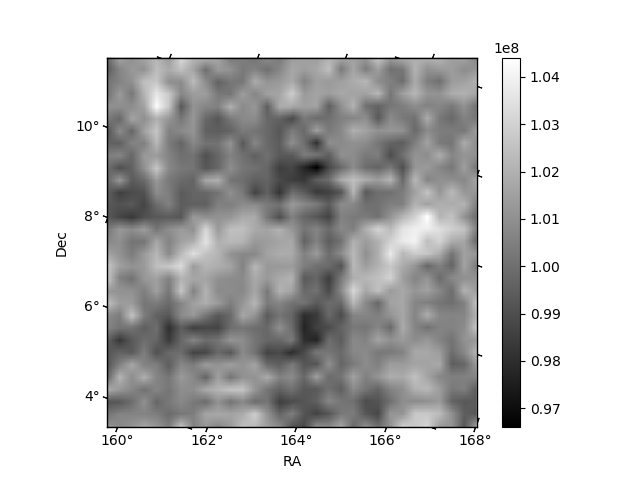
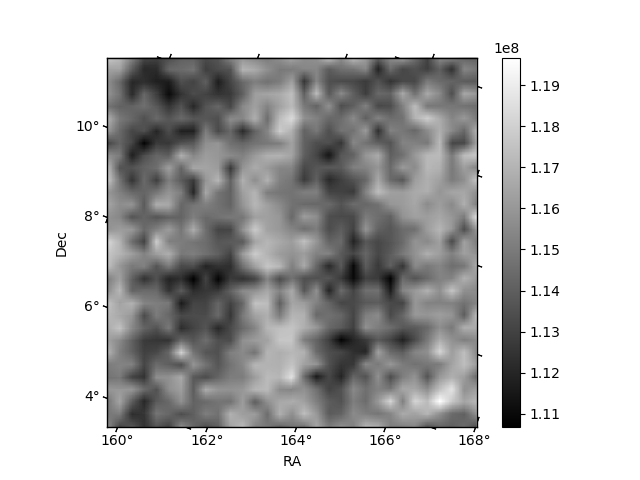
Histogram calculated using DETX and DETY for each event in the final _common_clean file
| Quadrant A | 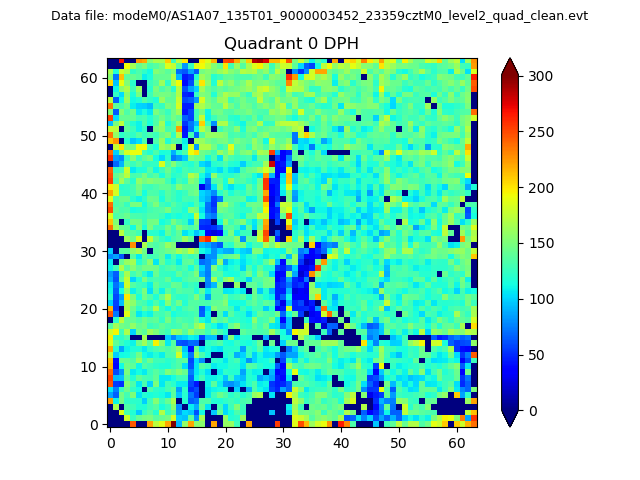 |
 |
Quadrant B |
|---|---|---|---|
| Quadrant D | 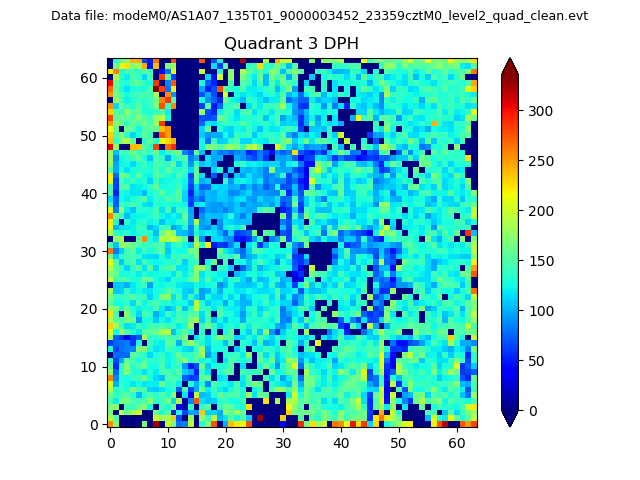 |
 |
Quadrant C |
| Plot type | Count rate plots | Images |
|---|---|---|
| Comparison with Poisson distribution Blue bars denote a histogram of data divided into 1 sec bins. Red curve is a Poisson curve with rate = median count rate of data. |
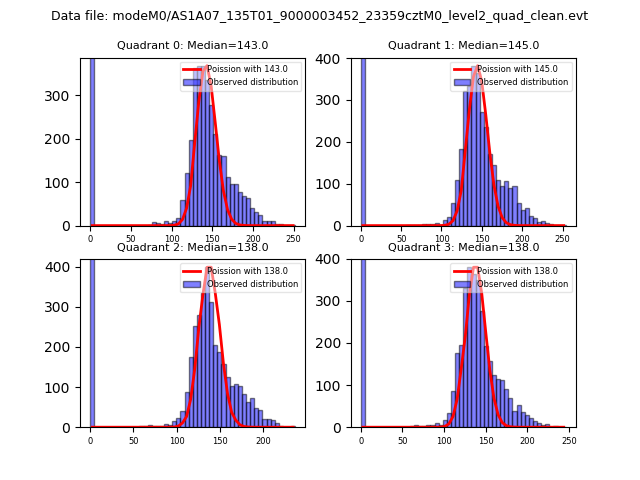 |
 |
| Quadrant-wise count rates Data is divided into 100 sec bins |
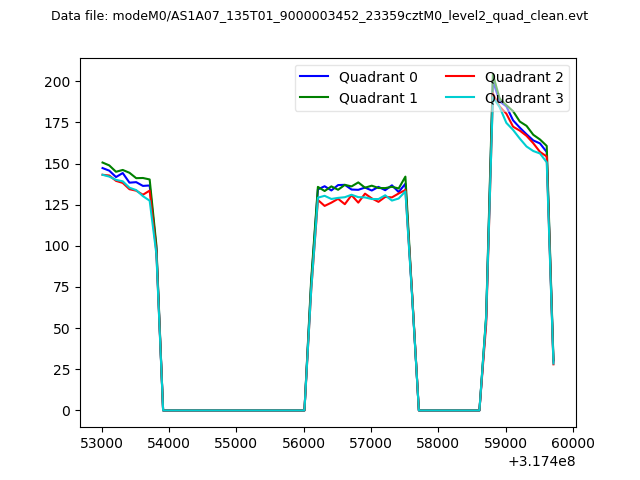 |
|
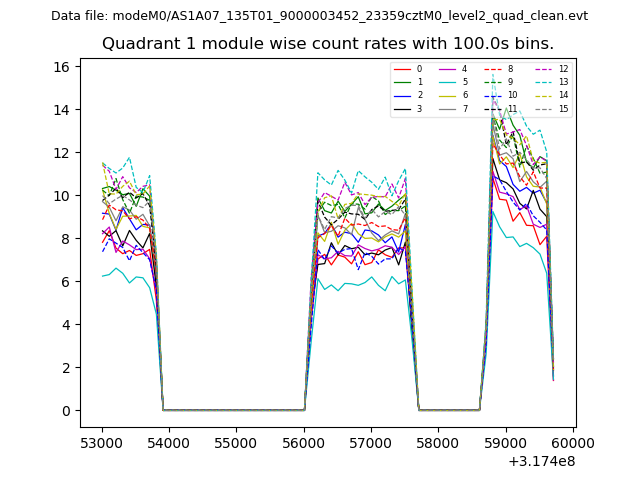
| Module-wise count rates for Quadrant A Data is divided into 100 sec bins |
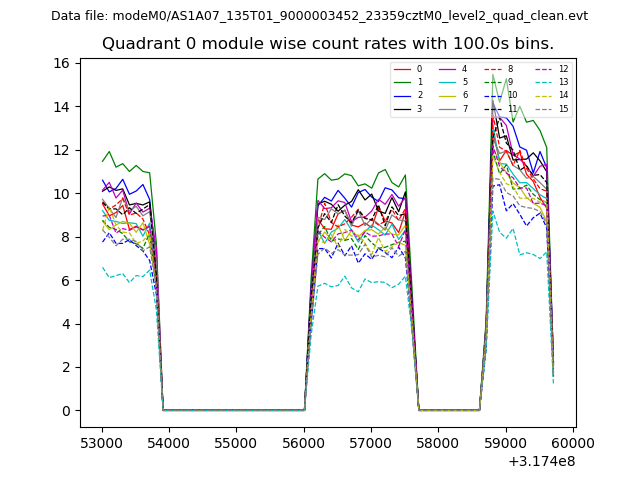 |
 |
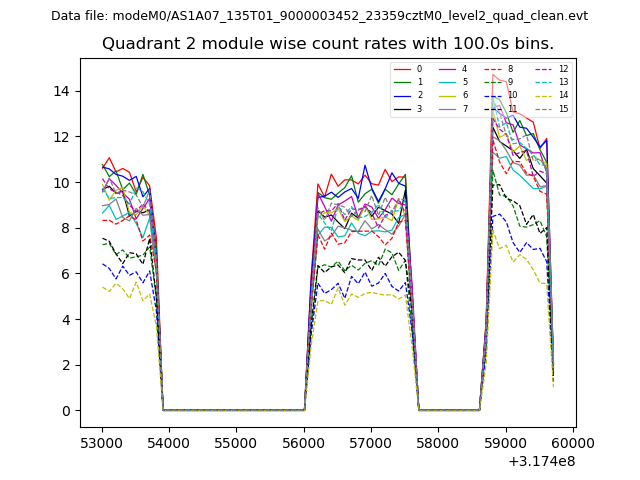
| Module-wise count rates for Quadrant B Data is divided into 100 sec bins |
 |
 |
| Module-wise count rates for Quadrant C Data is divided into 100 sec bins |
 |
 |
| Module-wise count rates for Quadrant D Data is divided into 100 sec bins |
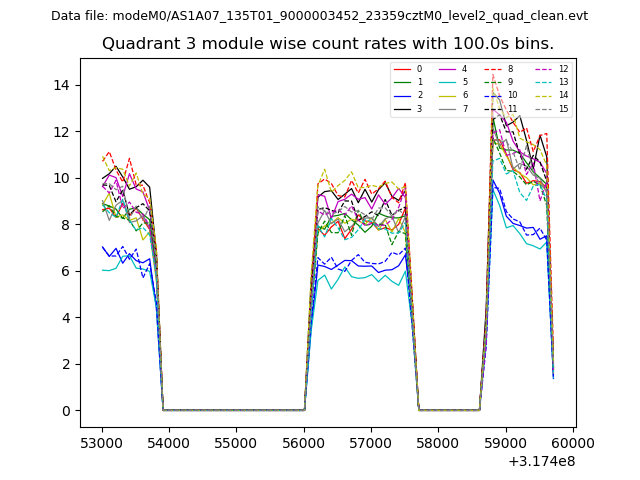 |
 |
| Parameter | Plot |
|---|---|
| CZT HV Monitor | 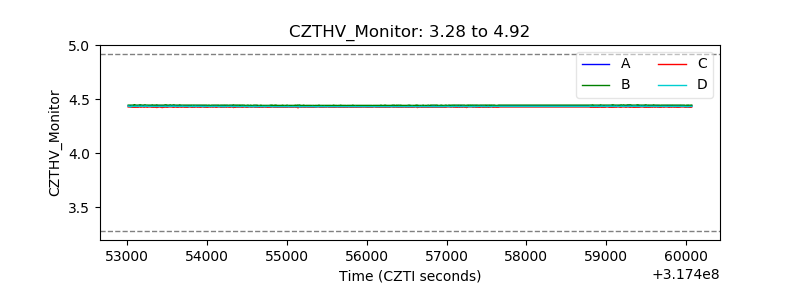 |
| D_VDD | 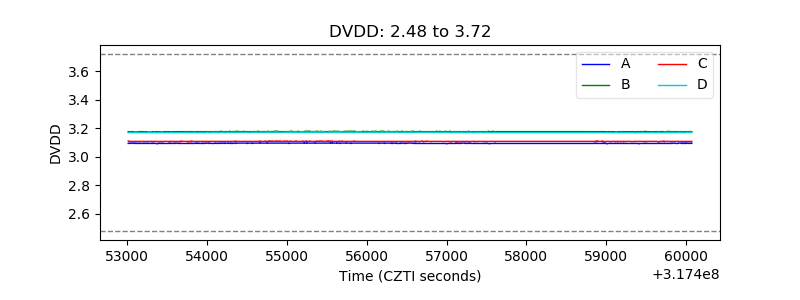 |
| Temperature 1 | 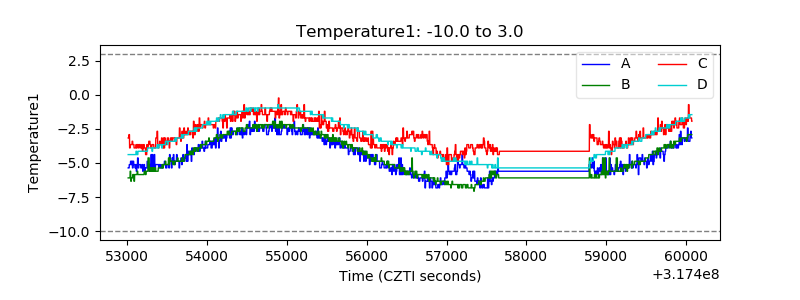 |
| Veto HV Monitor | 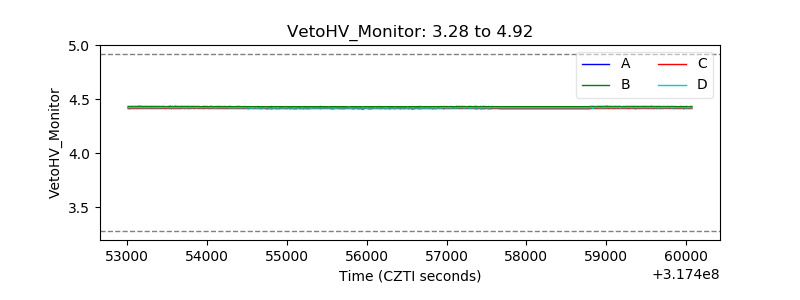 |
| Veto LLD | 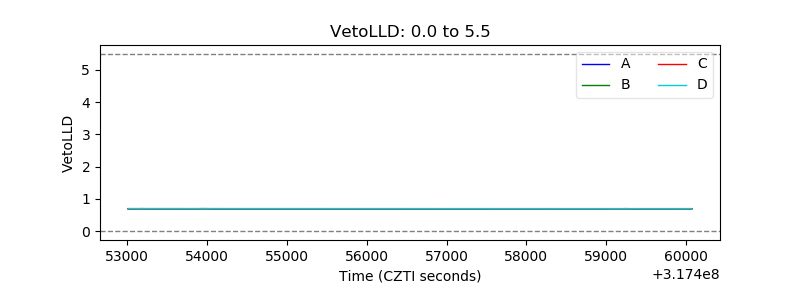 |
| Alpha Counter | 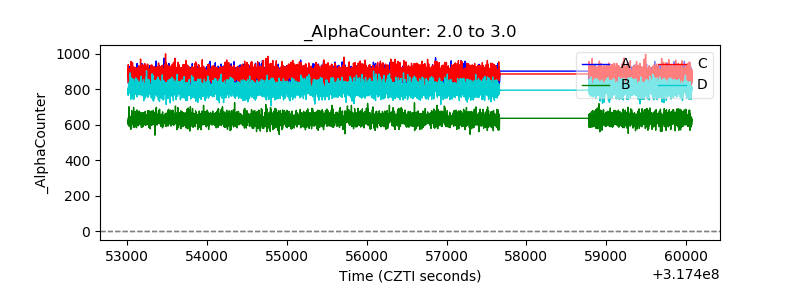 |
| _CPM_Rate | 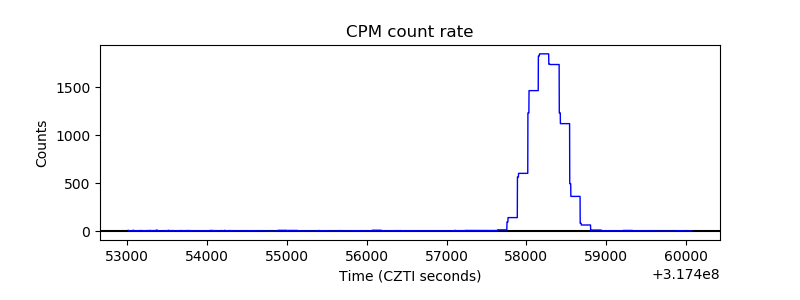 |
| CZT Counter | 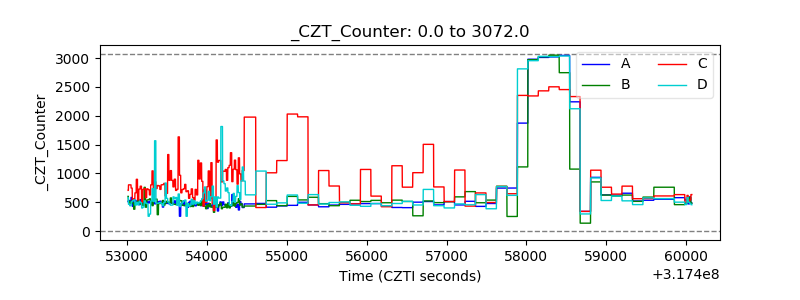 |
| +2.5 Volts monitor |  |
| +5 Volts monitor |  |
| _ROLL_ROT | 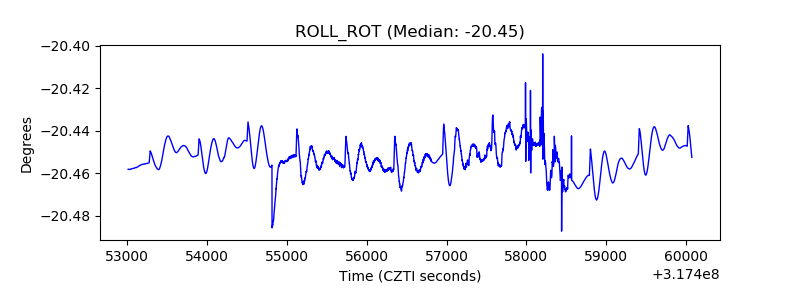 |
| _Roll_DEC | 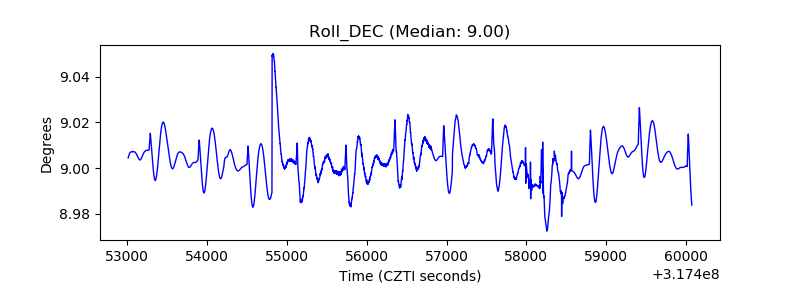 |
| _Roll_RA | 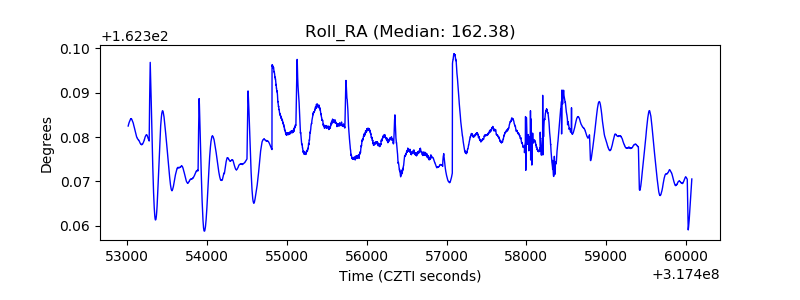 |
| Veto Counter | 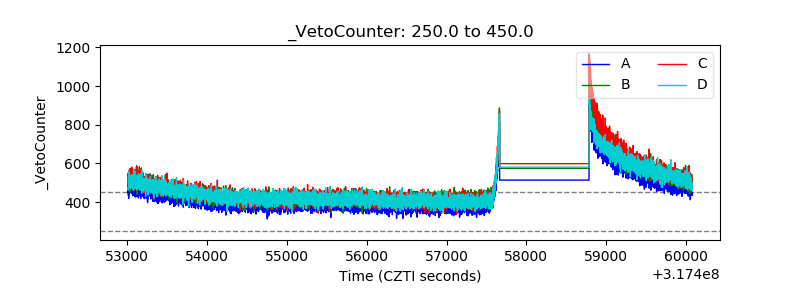 |