| Param | Original file | Final file |
|---|---|---|
| Filename | modeM0/AS1A07_135T01_9000003452_23360cztM0_level2.evt | modeM0/AS1A07_135T01_9000003452_23360cztM0_level2_quad_clean.evt |
| Size (bytes) | 491,909,760 | 80,801,280 |
| Size | 469.1 MB | 77.1 MB |
| Events in quadrant A | 3,309,266 | 511,385 |
| Events in quadrant B | 3,413,519 | 517,715 |
| Events in quadrant C | 4,052,709 | 494,518 |
| Events in quadrant D | 3,700,846 | 489,631 |
| Mode SS | |||
|---|---|---|---|
| Quadrant | BADHDUFLAG | Total packets | Discarded packets |
| A | 0 | 128 | 0 |
| B | 0 | 128 | 0 |
| C | 0 | 128 | 0 |
| D | 0 | 128 | 0 |
| Mode M0 | |||
|---|---|---|---|
| Quadrant | BADHDUFLAG | Total packets | Discarded packets |
| A | 0 | 13628 | 2 |
| B | 0 | 13864 | 2 |
| C | 0 | 16125 | 2 |
| D | 0 | 14848 | 2 |
| Mode M9 | |||
|---|---|---|---|
| Quadrant | BADHDUFLAG | Total packets | Discarded packets |
| A | 0 | 12 | 0 |
| B | 0 | 12 | 0 |
| C | 0 | 12 | 0 |
| D | 0 | 12 | 0 |
| Quadrant | Total seconds | Saturated seconds | Saturation percentage |
|---|---|---|---|
| A | 6202 | 37 | 0.596582% |
| B | 6202 | 48 | 0.773944% |
| C | 6203 | 126 | 2.031275% |
| D | 6203 | 58 | 0.935031% |
Noise dominated data is calculated using 1-second bins in cleaned event files. If a bin has >2000 counts, and if more than 50% of those come from <1% of pixels, then it is considered to be noise-dominated and hence unusable.
| Quadrant | # 1 sec bins | Bins with >0 counts | Bins with >2000 counts | High rate bins dominated by noise | Noise dominated (total time) | Noise dominated (detector-on time) | Marked lightcurve |
|---|---|---|---|---|---|---|---|
| A | 7457 | 6202 | 0 | 0 | 0.00% | 0.00% | 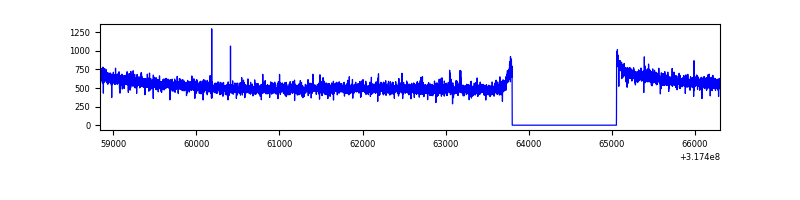 |
| B | 7457 | 6202 | 9 | 9 | 0.12% | 0.15% | 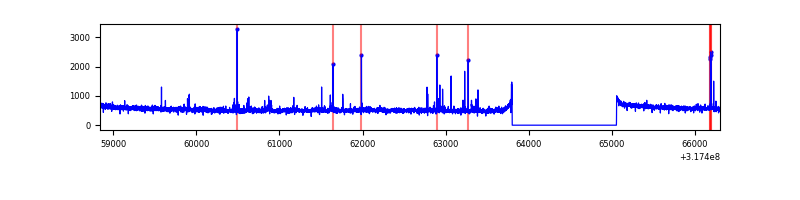 |
| C | 7458 | 6204 | 9 | 9 | 0.12% | 0.15% | 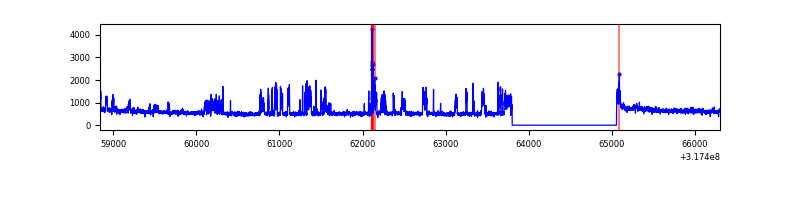 |
| D | 7458 | 6203 | 36 | 36 | 0.48% | 0.58% | 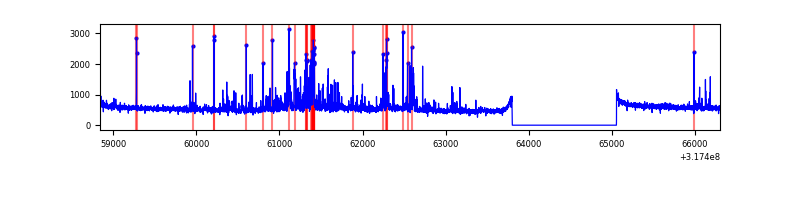 |
Top three noisy pixels from each quadrant. If the there are fewer than three noisy pixels in the level2.evt file, extra rows are filled as -1
| Pixel properties | Quadrant properties | ||||||
|---|---|---|---|---|---|---|---|
| Quadrant | DetID | PixID | Counts | Sigma | Mean | Median | Sigma |
| A | 2 | 79 | 9002 | 48.16 | 856 | 841 | 169.5 |
| A | 13 | 254 | 8909 | 47.61 | 856 | 841 | 169.5 |
| A | 0 | 226 | 7445 | 38.97 | 856 | 841 | 169.5 |
| B | 0 | 189 | 70583 | 443.5 | 841 | 822 | 157.3 |
| B | 0 | 190 | 20971 | 128.1 | 841 | 822 | 157.3 |
| B | 12 | 111 | 18515 | 112.48 | 841 | 822 | 157.3 |
| C | 0 | 239 | 627875 | 3315.2 | 821 | 832 | 189.1 |
| C | 14 | 238 | 132215 | 694.63 | 821 | 832 | 189.1 |
| C | 7 | 247 | 57318 | 298.64 | 821 | 832 | 189.1 |
| D | 1 | 52 | 190334 | 933.59 | 839 | 818 | 203.0 |
| D | 12 | 233 | 127213 | 622.64 | 839 | 818 | 203.0 |
| D | 9 | 85 | 124227 | 607.93 | 839 | 818 | 203.0 |
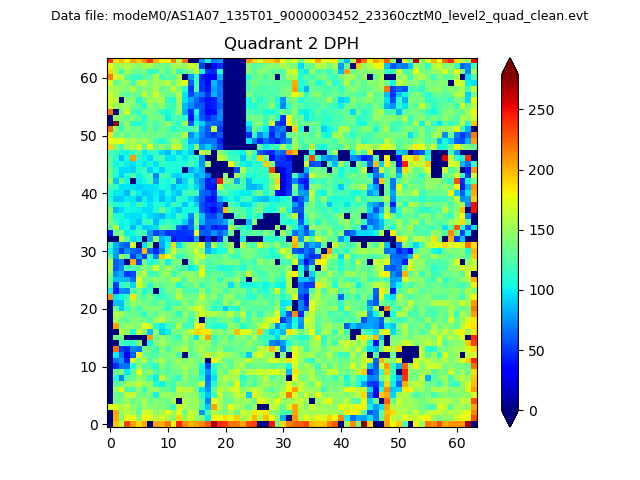
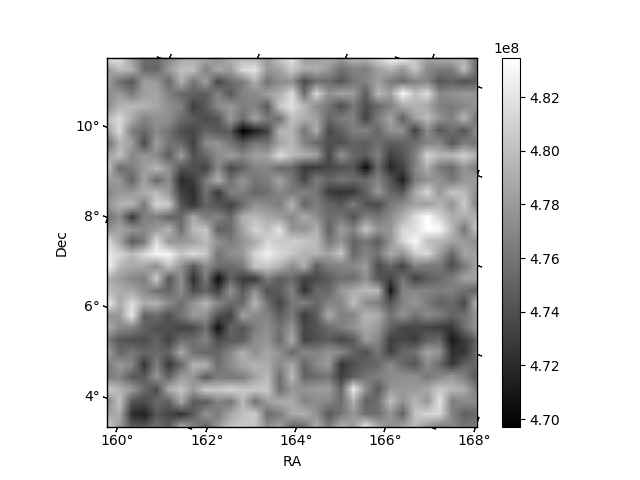
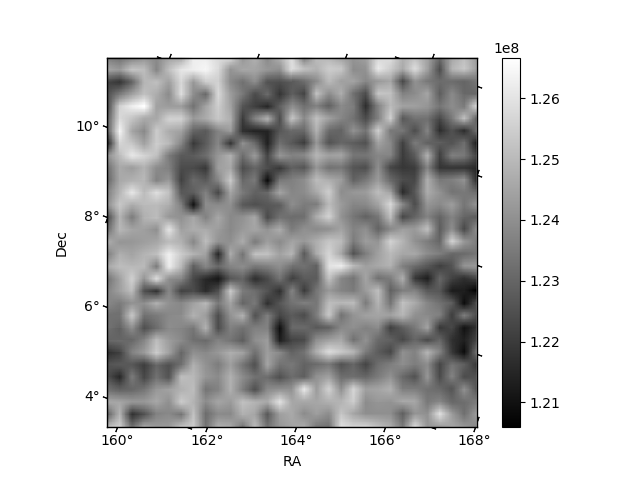
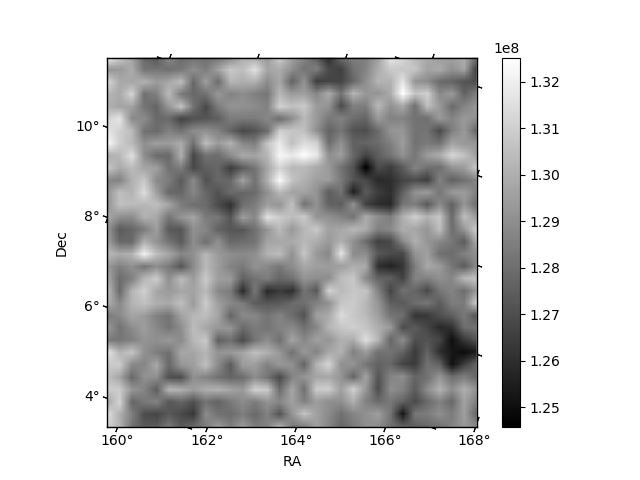
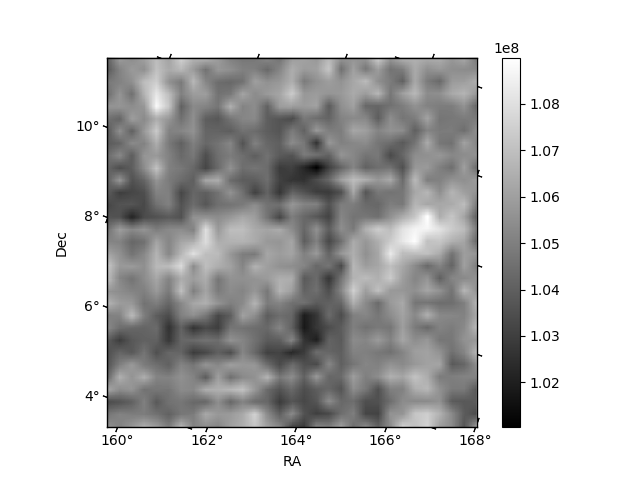
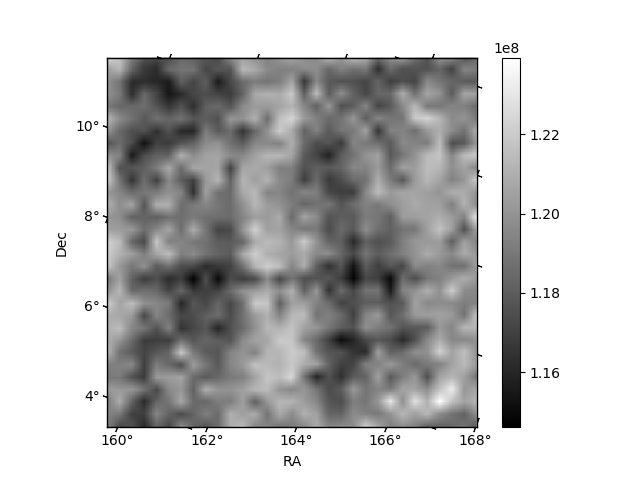
Histogram calculated using DETX and DETY for each event in the final _common_clean file
| Quadrant A | 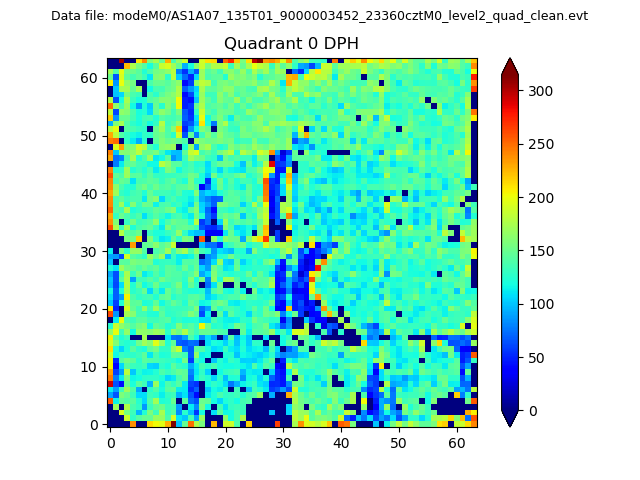 |
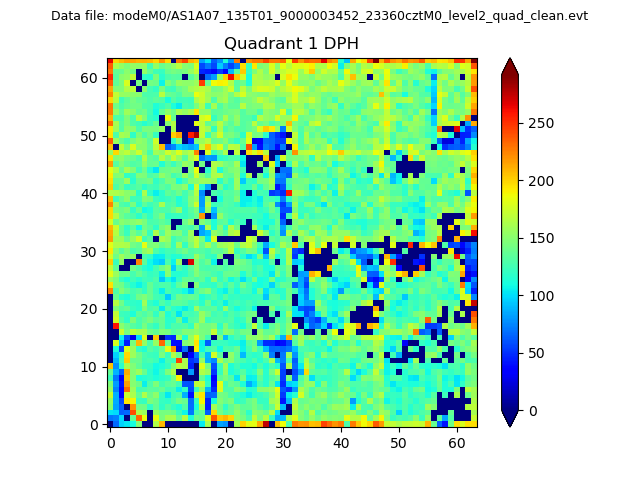 |
Quadrant B |
|---|---|---|---|
| Quadrant D | 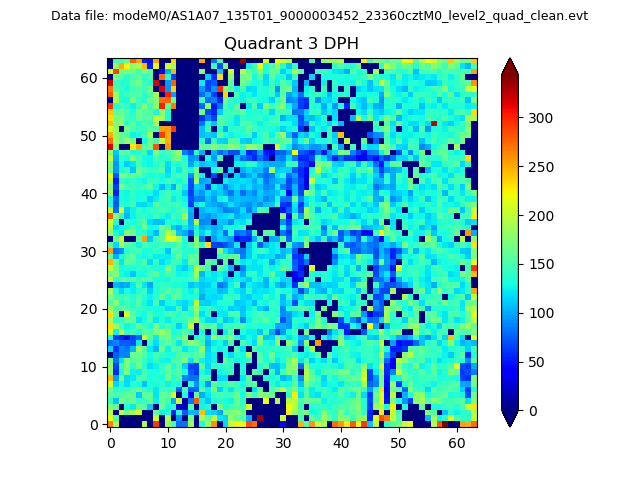 |
 |
Quadrant C |
| Plot type | Count rate plots | Images |
|---|---|---|
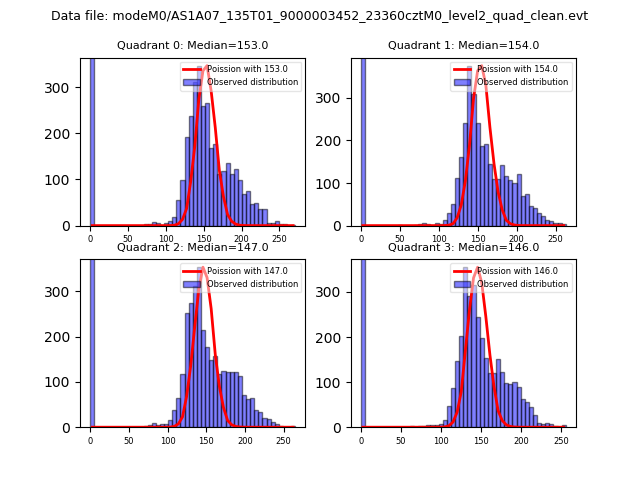
| Comparison with Poisson distribution Blue bars denote a histogram of data divided into 1 sec bins. Red curve is a Poisson curve with rate = median count rate of data. |
 |
 |
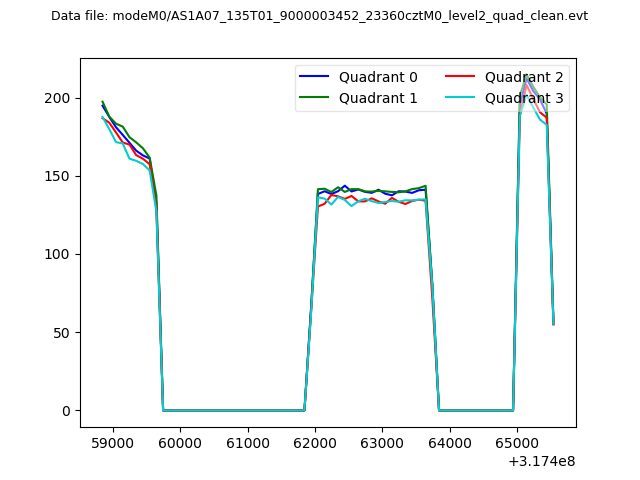
| Quadrant-wise count rates Data is divided into 100 sec bins |
 |
|
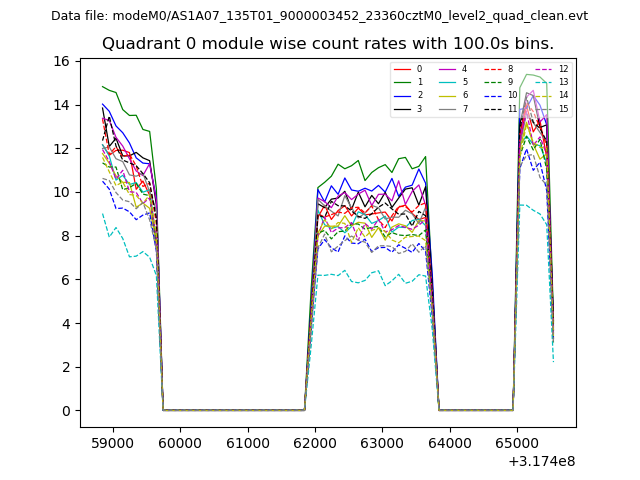
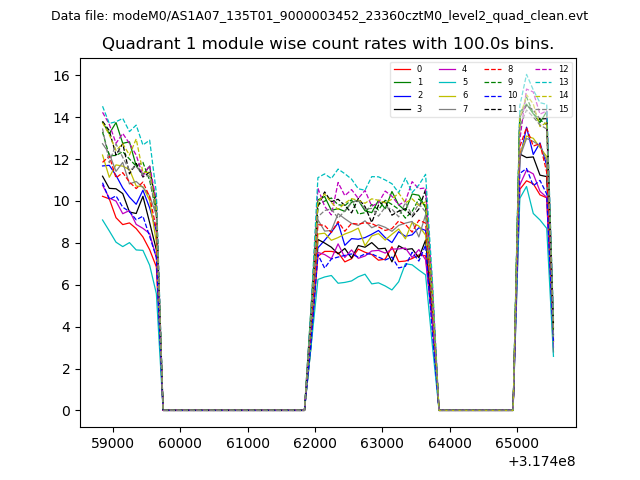
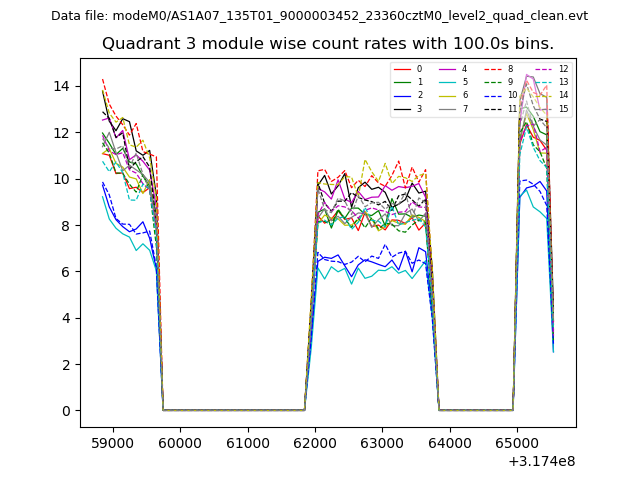
| Module-wise count rates for Quadrant A Data is divided into 100 sec bins |
 |
 |
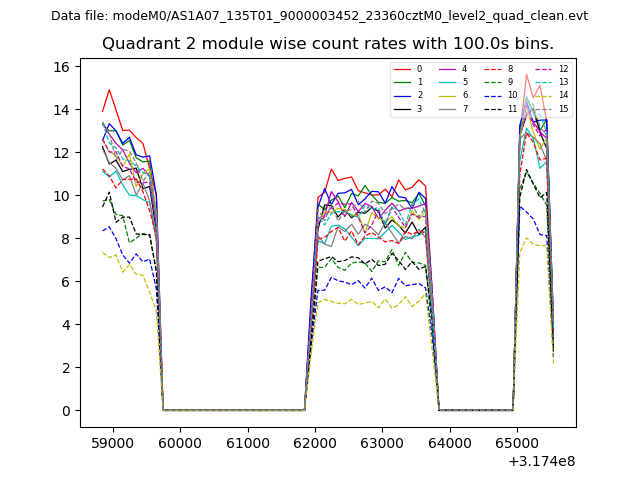
| Module-wise count rates for Quadrant B Data is divided into 100 sec bins |
 |
 |
| Module-wise count rates for Quadrant C Data is divided into 100 sec bins |
 |
 |
| Module-wise count rates for Quadrant D Data is divided into 100 sec bins |
 |
 |
| Parameter | Plot |
|---|---|
| CZT HV Monitor | 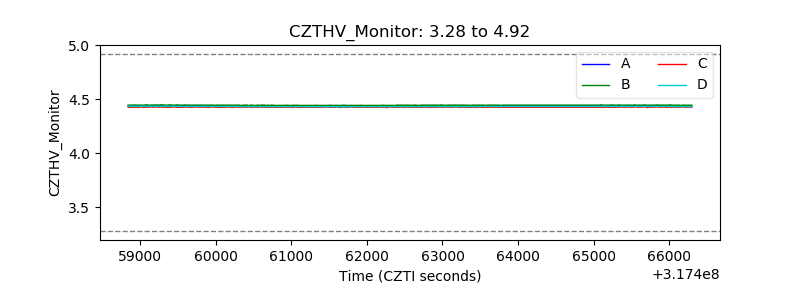 |
| D_VDD | 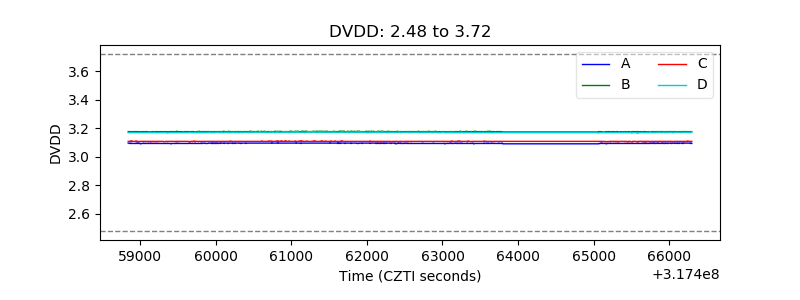 |
| Temperature 1 | 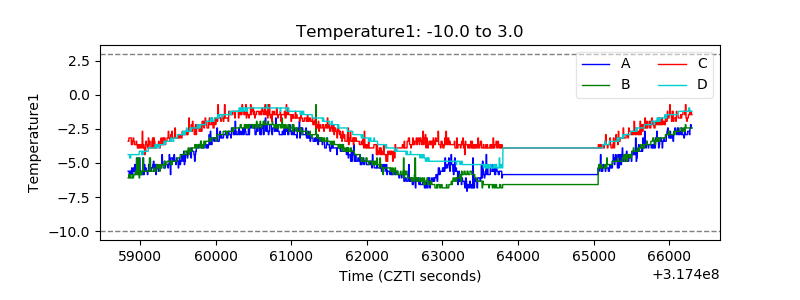 |
| Veto HV Monitor | 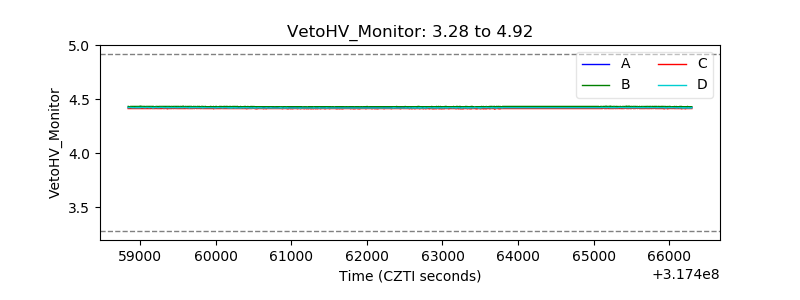 |
| Veto LLD | 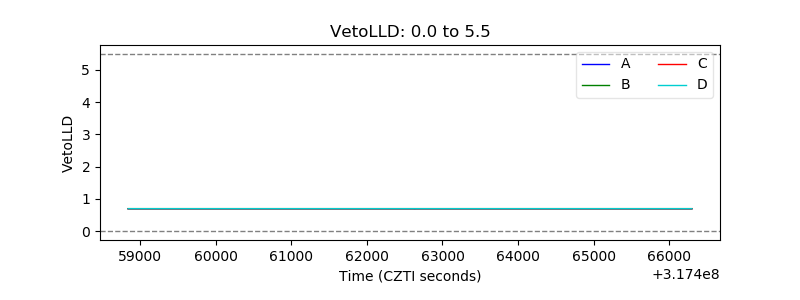 |
| Alpha Counter | 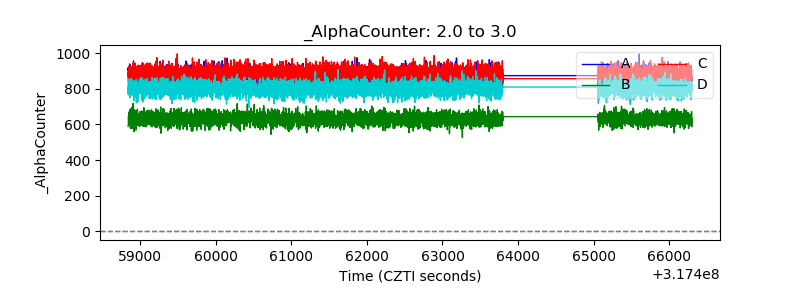 |
| _CPM_Rate | 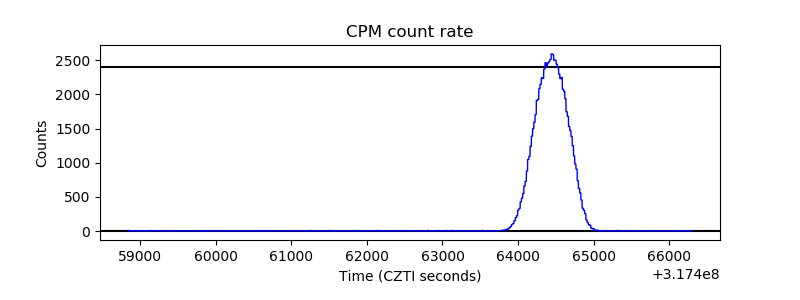 |
| CZT Counter | 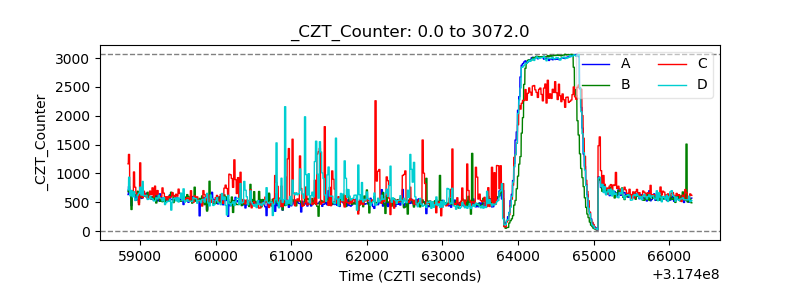 |
| +2.5 Volts monitor |  |
| +5 Volts monitor |  |
| _ROLL_ROT | 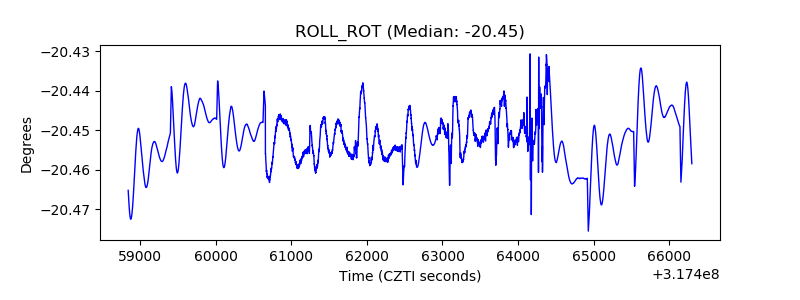 |
| _Roll_DEC | 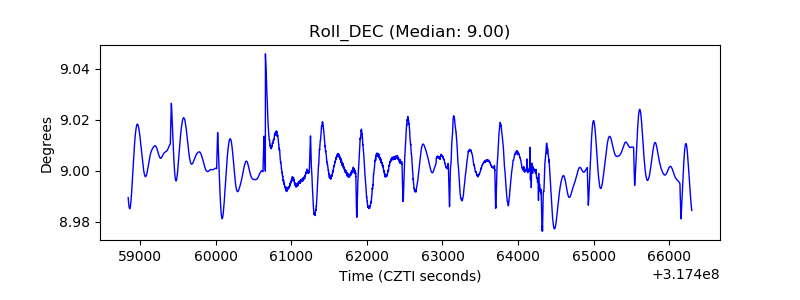 |
| _Roll_RA | 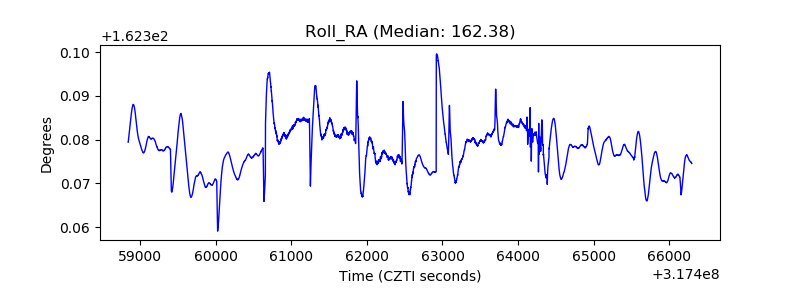 |
| Veto Counter | 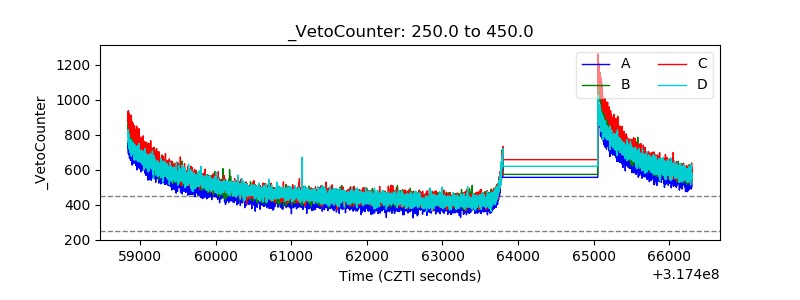 |