| Param | Original file | Final file |
|---|---|---|
| Filename | modeM0/AS1A07_135T01_9000003452_23361cztM0_level2.evt | modeM0/AS1A07_135T01_9000003452_23361cztM0_level2_quad_clean.evt |
| Size (bytes) | 863,297,280 | 115,289,280 |
| Size | 823.3 MB | 109.9 MB |
| Events in quadrant A | 5,721,006 | 700,350 |
| Events in quadrant B | 5,987,739 | 705,385 |
| Events in quadrant C | 7,085,267 | 675,341 |
| Events in quadrant D | 6,627,349 | 668,647 |
| Mode SS | |||
|---|---|---|---|
| Quadrant | BADHDUFLAG | Total packets | Discarded packets |
| A | 0 | 220 | 0 |
| B | 0 | 220 | 0 |
| C | 0 | 220 | 0 |
| D | 0 | 220 | 0 |
| Mode M0 | |||
|---|---|---|---|
| Quadrant | BADHDUFLAG | Total packets | Discarded packets |
| A | 0 | 23473 | 2 |
| B | 0 | 24204 | 2 |
| C | 0 | 28424 | 2 |
| D | 0 | 26475 | 2 |
| Mode M9 | |||
|---|---|---|---|
| Quadrant | BADHDUFLAG | Total packets | Discarded packets |
| A | 0 | 25 | 0 |
| B | 0 | 25 | 0 |
| C | 0 | 25 | 0 |
| D | 0 | 25 | 0 |
| Quadrant | Total seconds | Saturated seconds | Saturation percentage |
|---|---|---|---|
| A | 10702 | 109 | 1.018501% |
| B | 10703 | 142 | 1.326731% |
| C | 10703 | 293 | 2.737550% |
| D | 10703 | 189 | 1.765860% |
Noise dominated data is calculated using 1-second bins in cleaned event files. If a bin has >2000 counts, and if more than 50% of those come from <1% of pixels, then it is considered to be noise-dominated and hence unusable.
| Quadrant | # 1 sec bins | Bins with >0 counts | Bins with >2000 counts | High rate bins dominated by noise | Noise dominated (total time) | Noise dominated (detector-on time) | Marked lightcurve |
|---|---|---|---|---|---|---|---|
| A | 13257 | 10702 | 0 | 0 | 0.00% | 0.00% | 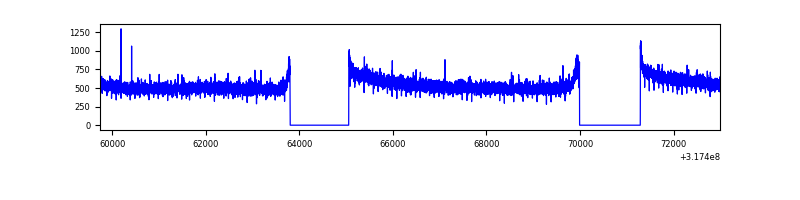 |
| B | 13258 | 10703 | 22 | 22 | 0.17% | 0.21% | 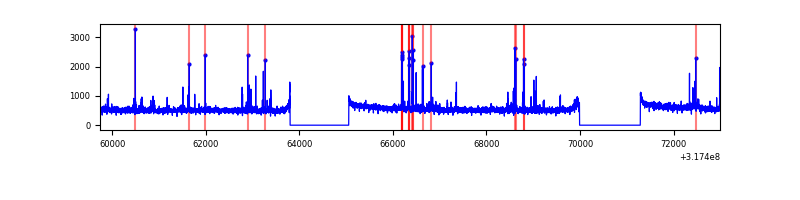 |
| C | 13258 | 10704 | 51 | 51 | 0.38% | 0.48% | 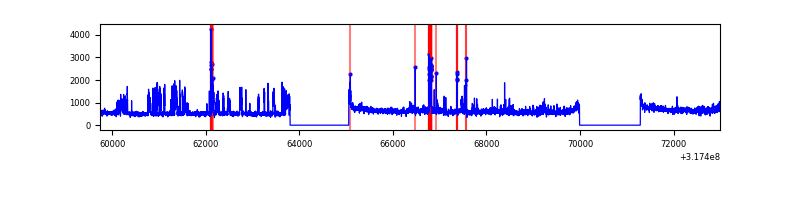 |
| D | 13258 | 10703 | 96 | 96 | 0.72% | 0.90% |  |
Top three noisy pixels from each quadrant. If the there are fewer than three noisy pixels in the level2.evt file, extra rows are filled as -1
| Pixel properties | Quadrant properties | ||||||
|---|---|---|---|---|---|---|---|
| Quadrant | DetID | PixID | Counts | Sigma | Mean | Median | Sigma |
| A | 13 | 254 | 15564 | 48.26 | 1482 | 1457 | 292.3 |
| A | 0 | 226 | 12956 | 39.34 | 1482 | 1457 | 292.3 |
| A | 3 | 137 | 12041 | 36.21 | 1482 | 1457 | 292.3 |
| B | 0 | 189 | 163936 | 596.87 | 1459 | 1428 | 272.3 |
| B | 0 | 190 | 45075 | 160.31 | 1459 | 1428 | 272.3 |
| B | 12 | 111 | 32129 | 112.76 | 1459 | 1428 | 272.3 |
| C | 0 | 239 | 984447 | 3016.14 | 1424 | 1439 | 325.9 |
| C | 14 | 238 | 229747 | 700.51 | 1424 | 1439 | 325.9 |
| C | 10 | 9 | 198678 | 605.18 | 1424 | 1439 | 325.9 |
| D | 1 | 52 | 372617 | 1068.66 | 1453 | 1417 | 347.4 |
| D | 9 | 85 | 217413 | 621.84 | 1453 | 1417 | 347.4 |
| D | 13 | 104 | 187608 | 536.03 | 1453 | 1417 | 347.4 |
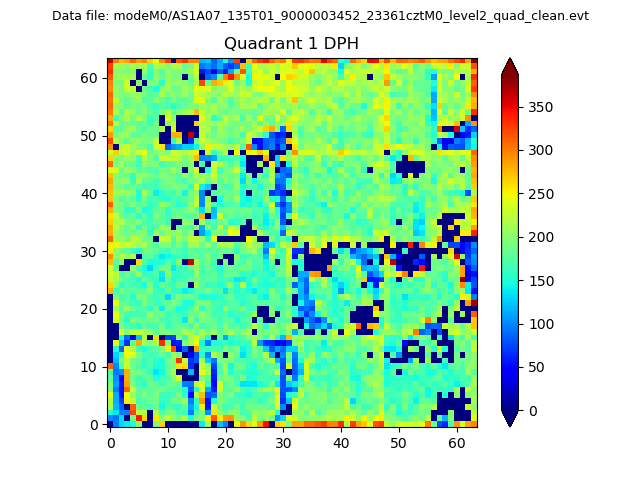
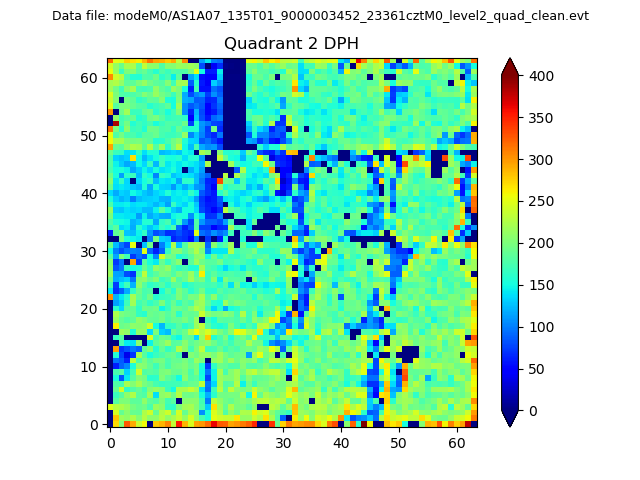
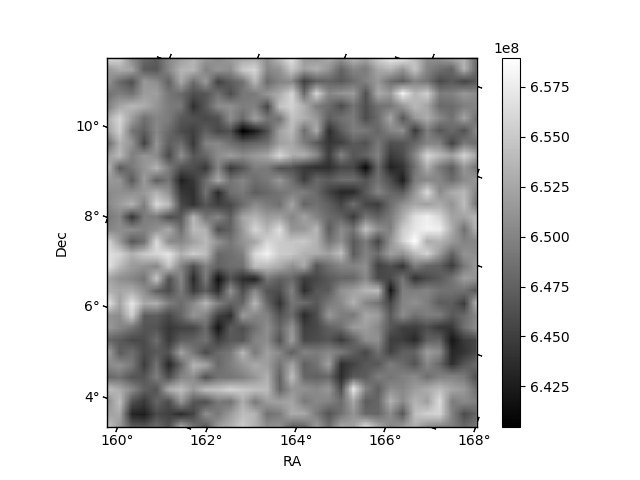
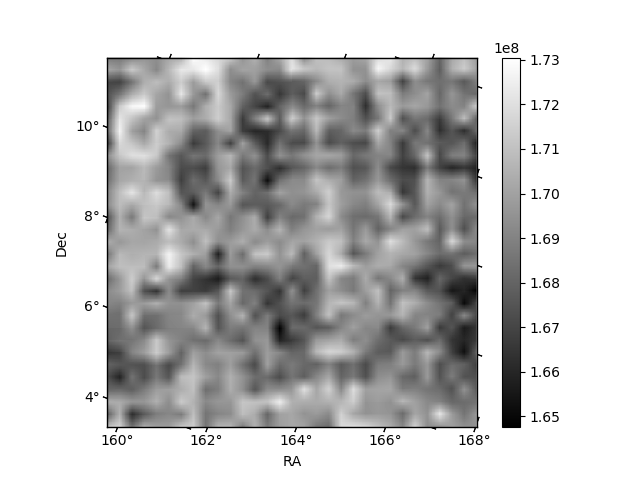
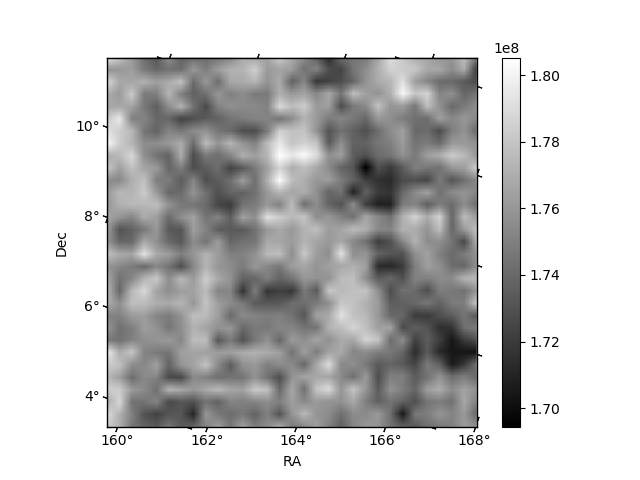
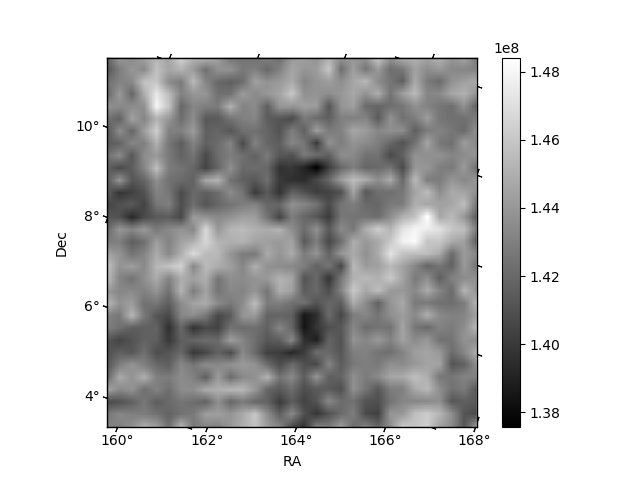
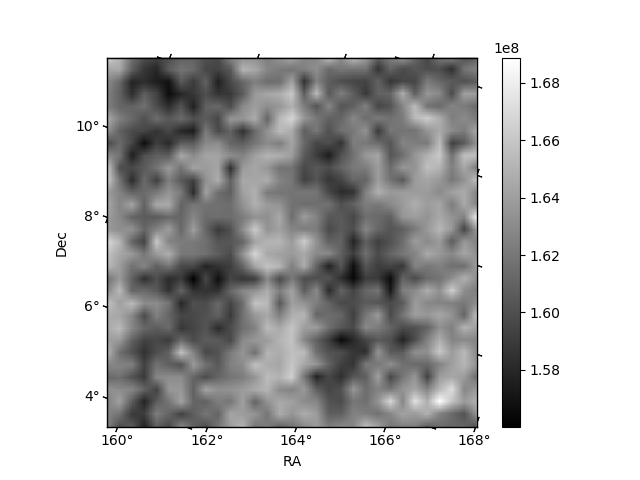
Histogram calculated using DETX and DETY for each event in the final _common_clean file
| Quadrant A | 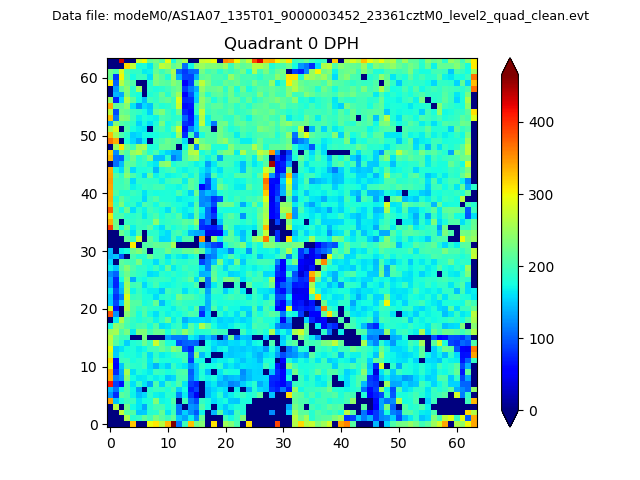 |
 |
Quadrant B |
|---|---|---|---|
| Quadrant D | 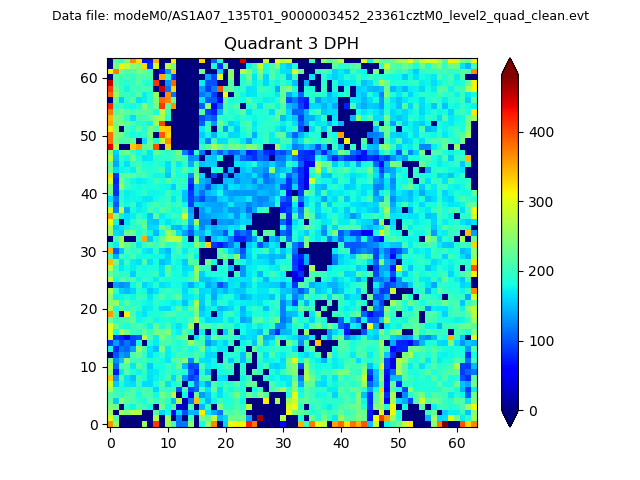 |
 |
Quadrant C |
| Plot type | Count rate plots | Images |
|---|---|---|
| Comparison with Poisson distribution Blue bars denote a histogram of data divided into 1 sec bins. Red curve is a Poisson curve with rate = median count rate of data. |
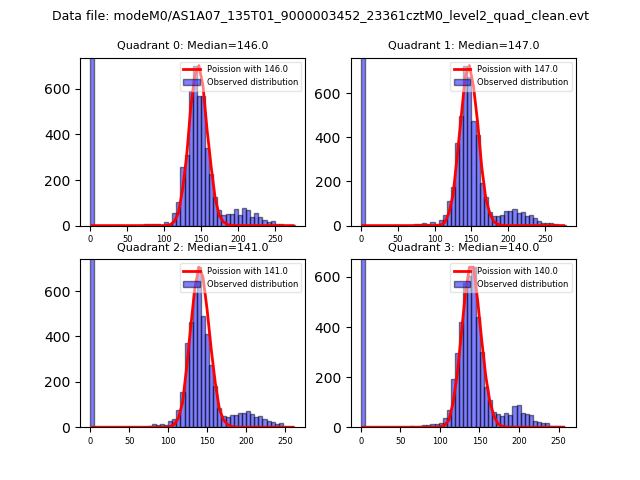 |
 |
| Quadrant-wise count rates Data is divided into 100 sec bins |
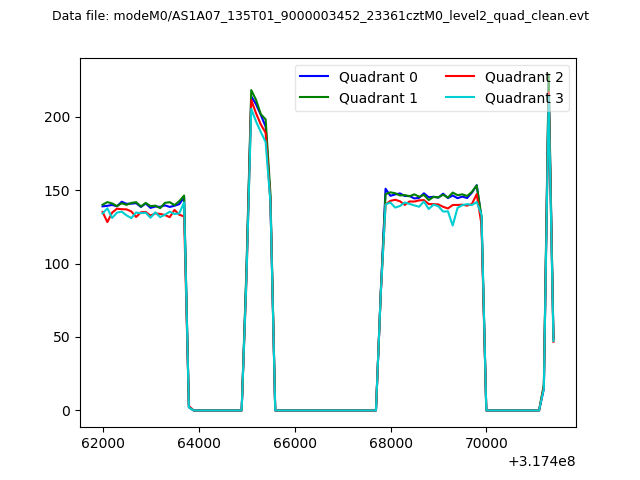 |
|
| Module-wise count rates for Quadrant A Data is divided into 100 sec bins |
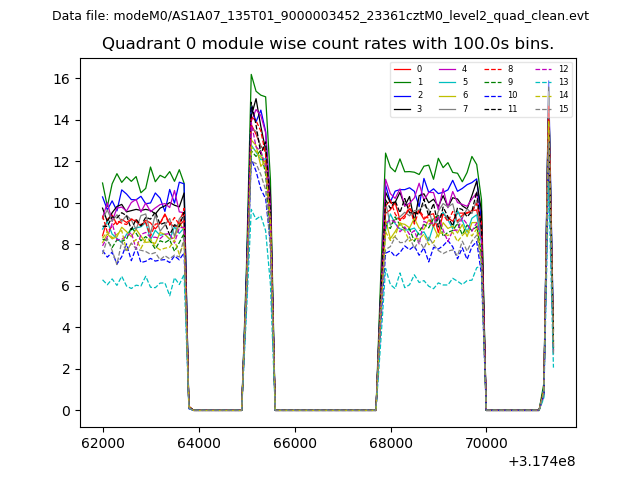 |
 |
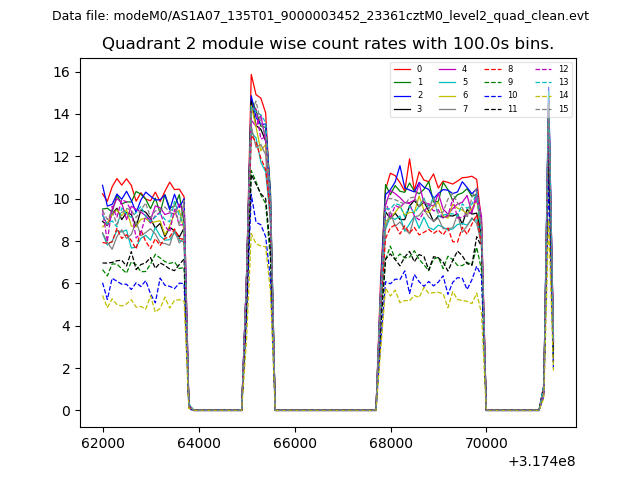
| Module-wise count rates for Quadrant B Data is divided into 100 sec bins |
 |
 |
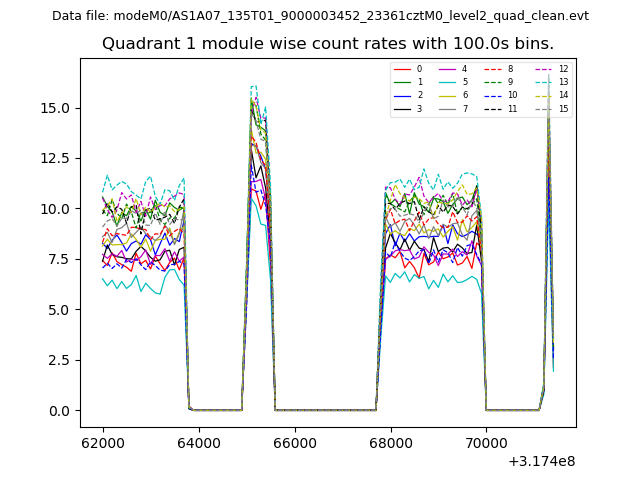
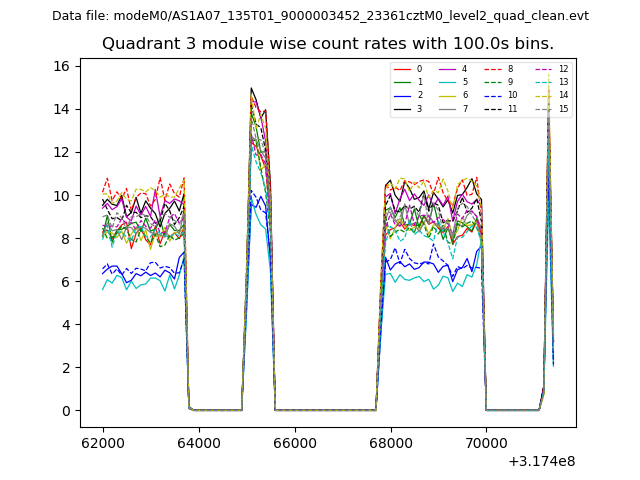
| Module-wise count rates for Quadrant C Data is divided into 100 sec bins |
 |
 |
| Module-wise count rates for Quadrant D Data is divided into 100 sec bins |
 |
 |
| Parameter | Plot |
|---|---|
| CZT HV Monitor | 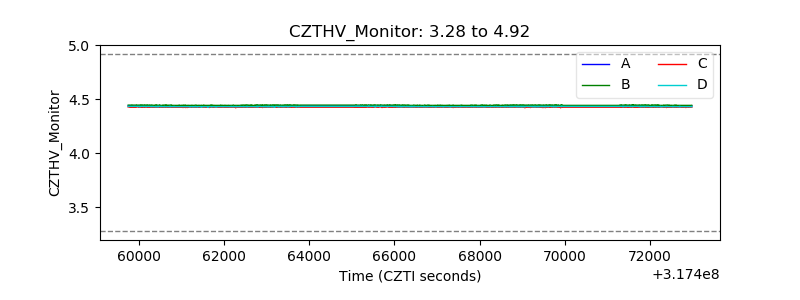 |
| D_VDD | 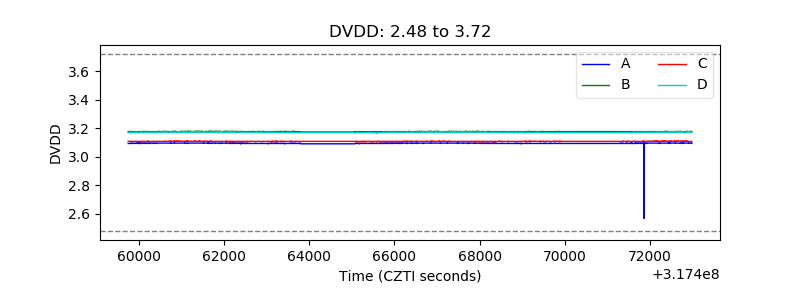 |
| Temperature 1 | 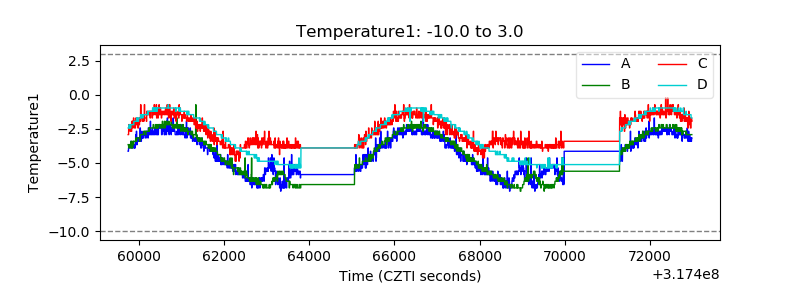 |
| Veto HV Monitor | 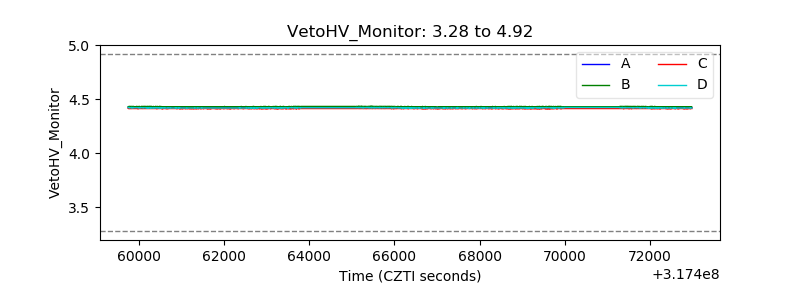 |
| Veto LLD | 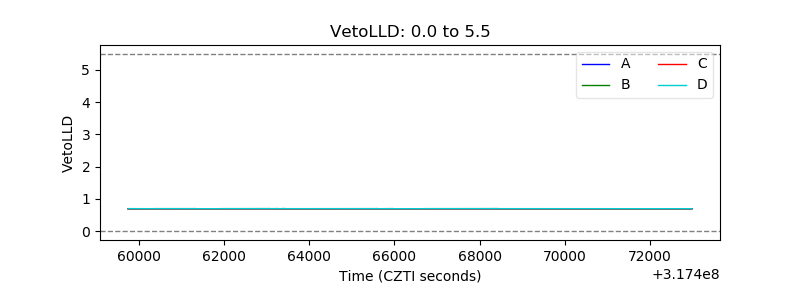 |
| Alpha Counter | 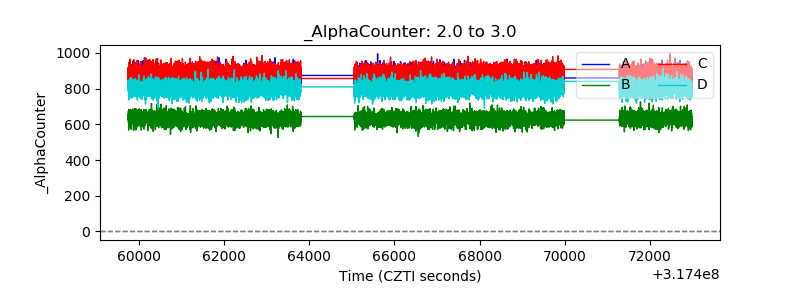 |
| _CPM_Rate | 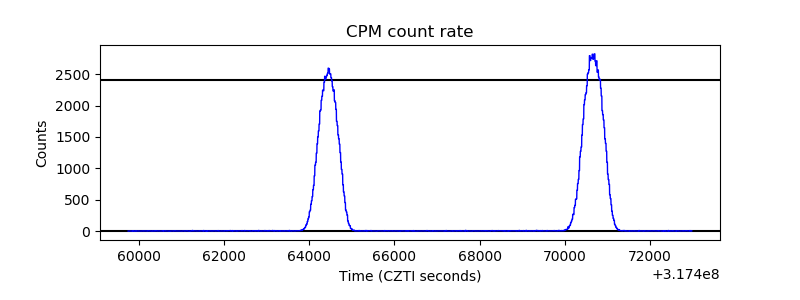 |
| CZT Counter | 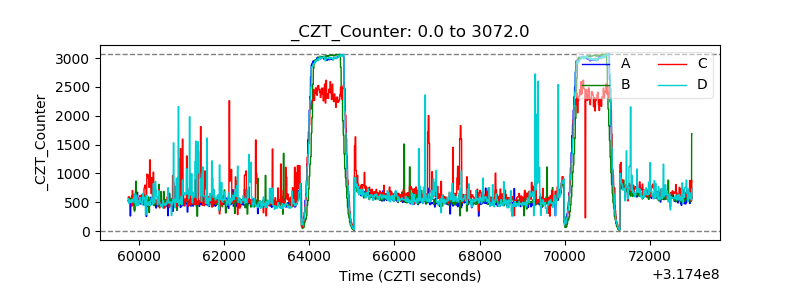 |
| +2.5 Volts monitor | 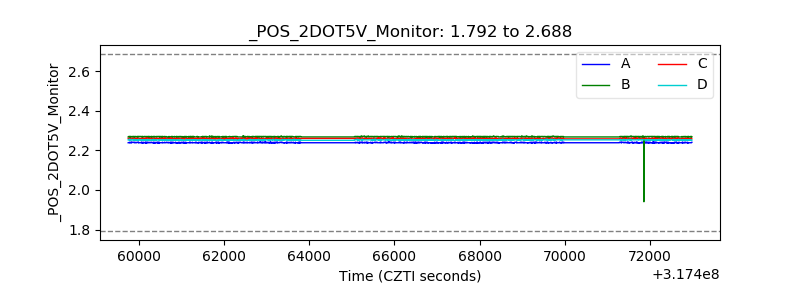 |
| +5 Volts monitor |  |
| _ROLL_ROT | 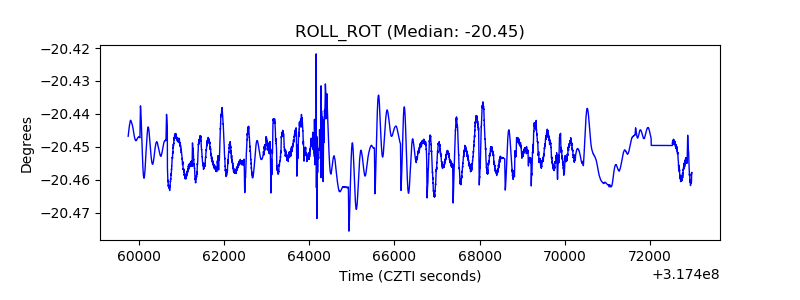 |
| _Roll_DEC | 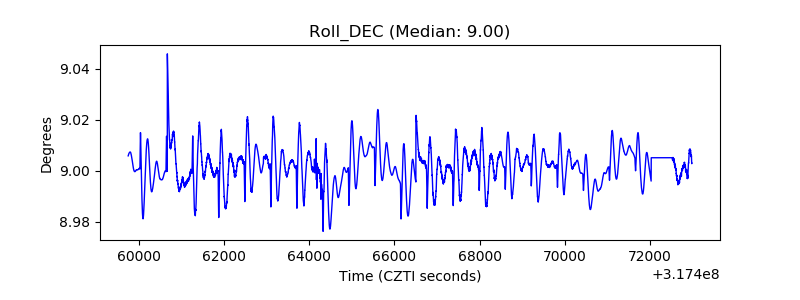 |
| _Roll_RA | 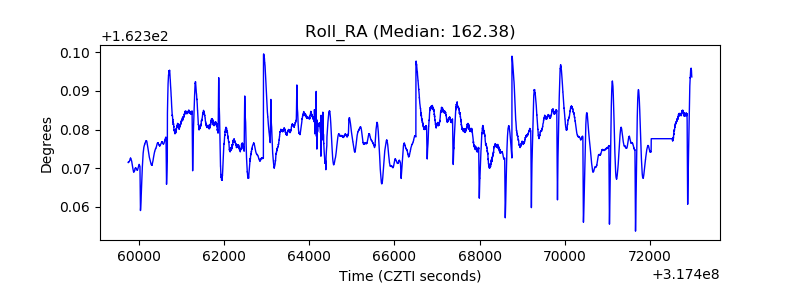 |
| Veto Counter | 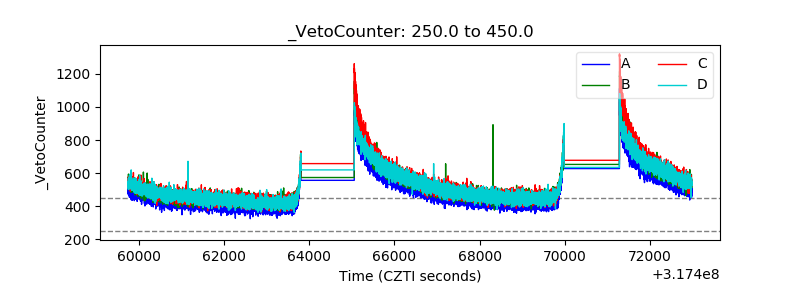 |