| Param | Original file | Final file |
|---|---|---|
| Filename | modeM0/AS1A07_135T01_9000003452_23362cztM0_level2.evt | modeM0/AS1A07_135T01_9000003452_23362cztM0_level2_quad_clean.evt |
| Size (bytes) | 295,407,360 | 35,550,720 |
| Size | 281.7 MB | 33.9 MB |
| Events in quadrant A | 1,888,704 | 209,762 |
| Events in quadrant B | 1,958,657 | 211,648 |
| Events in quadrant C | 2,276,277 | 203,458 |
| Events in quadrant D | 2,581,548 | 200,393 |
| Mode SS | |||
|---|---|---|---|
| Quadrant | BADHDUFLAG | Total packets | Discarded packets |
| A | 0 | 72 | 0 |
| B | 0 | 72 | 0 |
| C | 0 | 72 | 0 |
| D | 0 | 72 | 0 |
| Mode M0 | |||
|---|---|---|---|
| Quadrant | BADHDUFLAG | Total packets | Discarded packets |
| A | 0 | 7797 | 0 |
| B | 0 | 7979 | 0 |
| C | 0 | 9413 | 0 |
| D | 0 | 10085 | 0 |
| Quadrant | Total seconds | Saturated seconds | Saturation percentage |
|---|---|---|---|
| A | 3532 | 6 | 0.169875% |
| B | 3533 | 9 | 0.254741% |
| C | 3533 | 39 | 1.103878% |
| D | 3533 | 41 | 1.160487% |
Noise dominated data is calculated using 1-second bins in cleaned event files. If a bin has >2000 counts, and if more than 50% of those come from <1% of pixels, then it is considered to be noise-dominated and hence unusable.
| Quadrant | # 1 sec bins | Bins with >0 counts | Bins with >2000 counts | High rate bins dominated by noise | Noise dominated (total time) | Noise dominated (detector-on time) | Marked lightcurve |
|---|---|---|---|---|---|---|---|
| A | 3532 | 3532 | 0 | 0 | 0.00% | 0.00% | 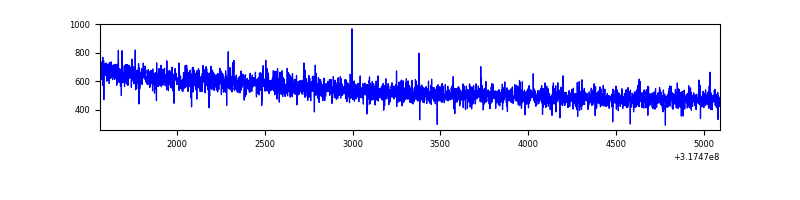 |
| B | 3533 | 3533 | 3 | 3 | 0.08% | 0.08% | 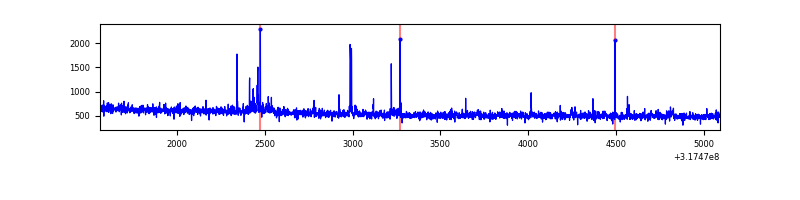 |
| C | 3533 | 3533 | 0 | 0 | 0.00% | 0.00% | 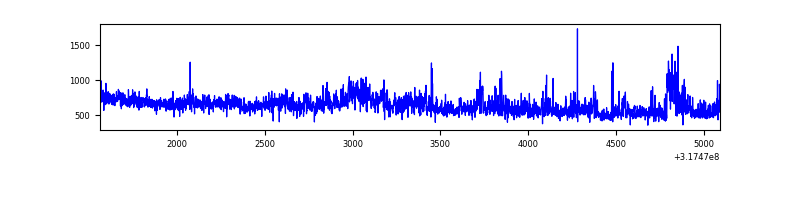 |
| D | 3533 | 3533 | 37 | 37 | 1.05% | 1.05% | 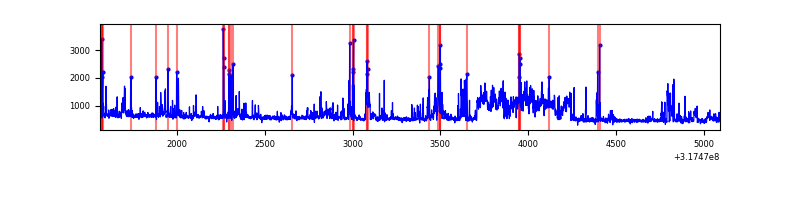 |
Top three noisy pixels from each quadrant. If the there are fewer than three noisy pixels in the level2.evt file, extra rows are filled as -1
| Pixel properties | Quadrant properties | ||||||
|---|---|---|---|---|---|---|---|
| Quadrant | DetID | PixID | Counts | Sigma | Mean | Median | Sigma |
| A | 13 | 254 | 5186 | 48.13 | 490 | 482 | 97.7 |
| A | 0 | 226 | 4331 | 39.38 | 490 | 482 | 97.7 |
| A | 3 | 137 | 3887 | 34.84 | 490 | 482 | 97.7 |
| B | 0 | 189 | 18931 | 203.77 | 484 | 475 | 90.6 |
| B | 0 | 190 | 16146 | 173.02 | 484 | 475 | 90.6 |
| B | 0 | 228 | 14329 | 152.96 | 484 | 475 | 90.6 |
| C | 0 | 239 | 314249 | 2865.36 | 474 | 480 | 109.5 |
| C | 14 | 238 | 77420 | 702.62 | 474 | 480 | 109.5 |
| C | 7 | 247 | 32761 | 294.79 | 474 | 480 | 109.5 |
| D | 1 | 52 | 360837 | 3069.17 | 481 | 468 | 117.4 |
| D | 9 | 85 | 335122 | 2850.16 | 481 | 468 | 117.4 |
| D | 6 | 112 | 30231 | 253.48 | 481 | 468 | 117.4 |
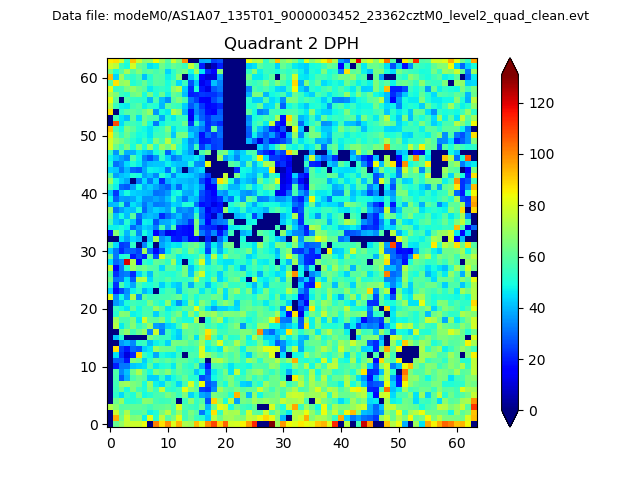
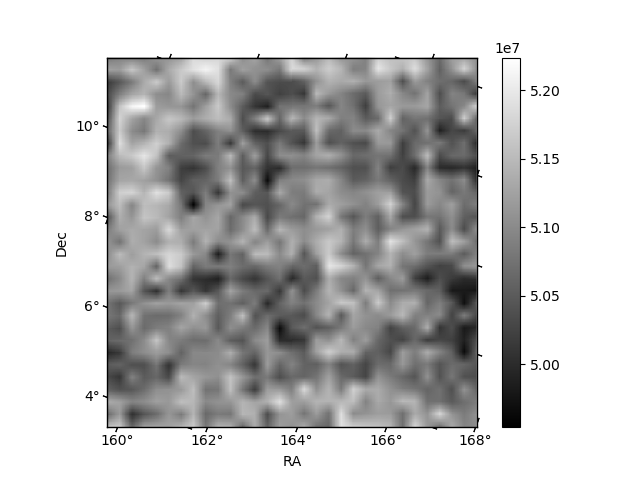
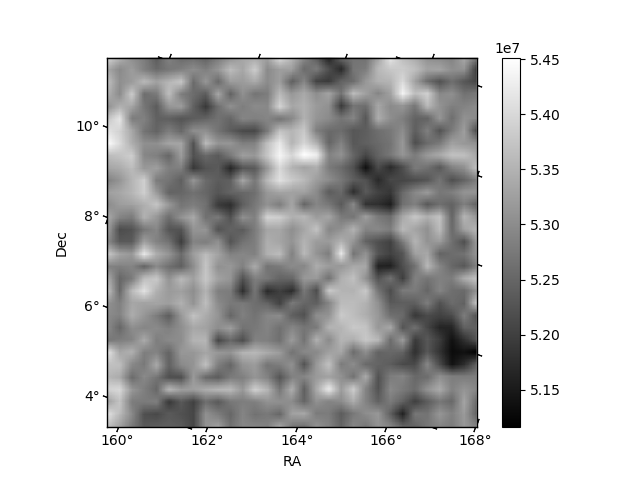
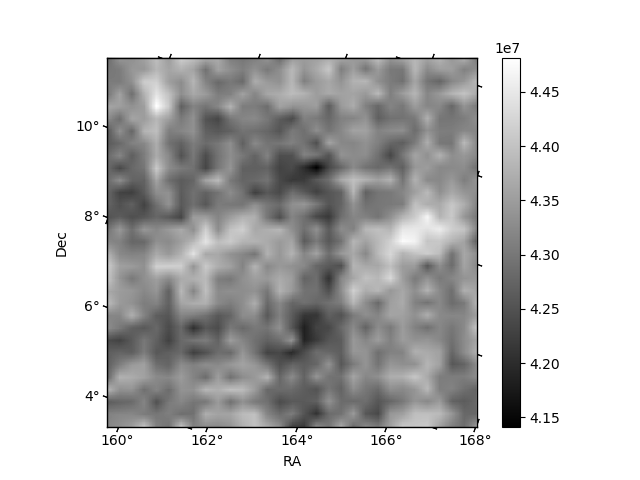
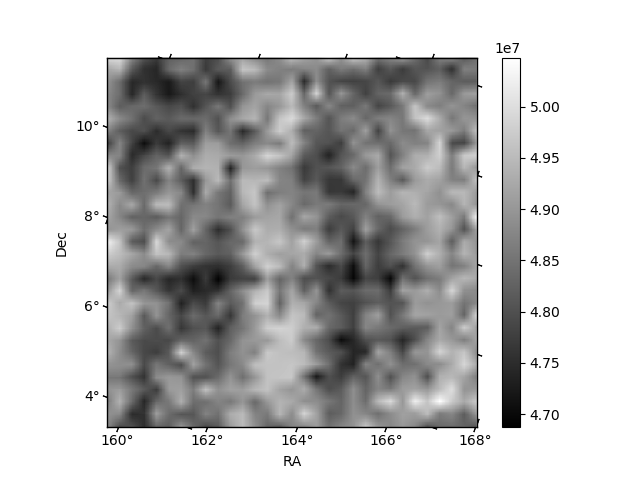
Histogram calculated using DETX and DETY for each event in the final _common_clean file
| Quadrant A | 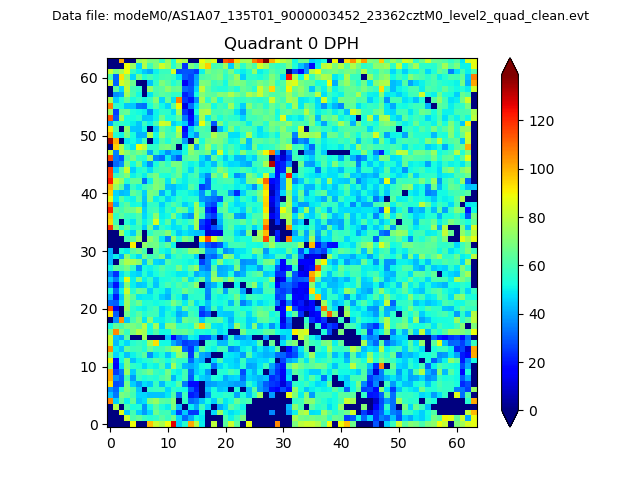 |
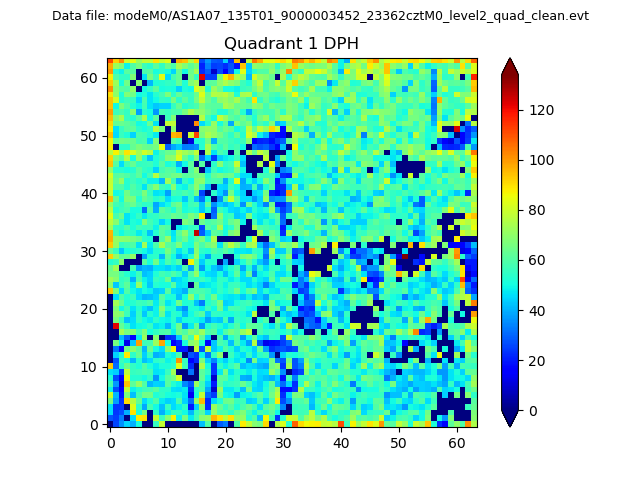 |
Quadrant B |
|---|---|---|---|
| Quadrant D | 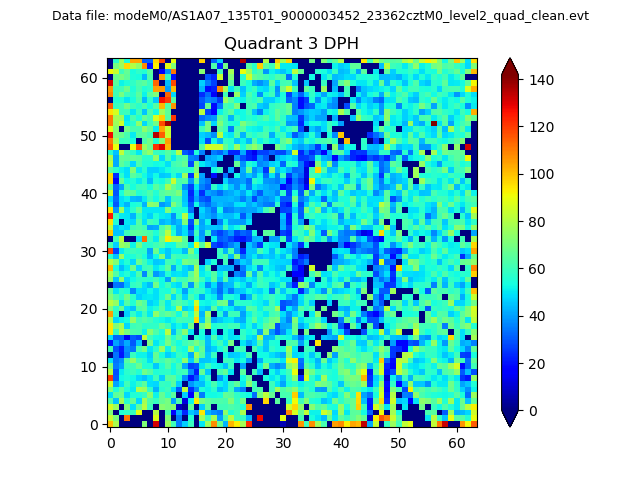 |
 |
Quadrant C |
| Plot type | Count rate plots | Images |
|---|---|---|
| Comparison with Poisson distribution Blue bars denote a histogram of data divided into 1 sec bins. Red curve is a Poisson curve with rate = median count rate of data. |
 |
 |
| Quadrant-wise count rates Data is divided into 100 sec bins |
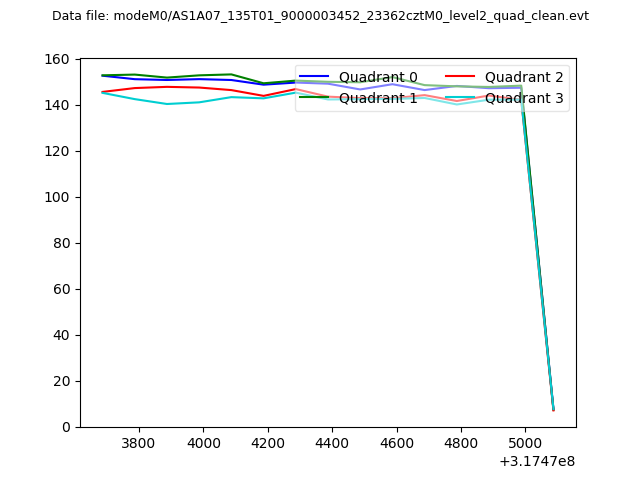 |
|
| Module-wise count rates for Quadrant A Data is divided into 100 sec bins |
 |
 |
| Module-wise count rates for Quadrant B Data is divided into 100 sec bins |
 |
 |
| Module-wise count rates for Quadrant C Data is divided into 100 sec bins |
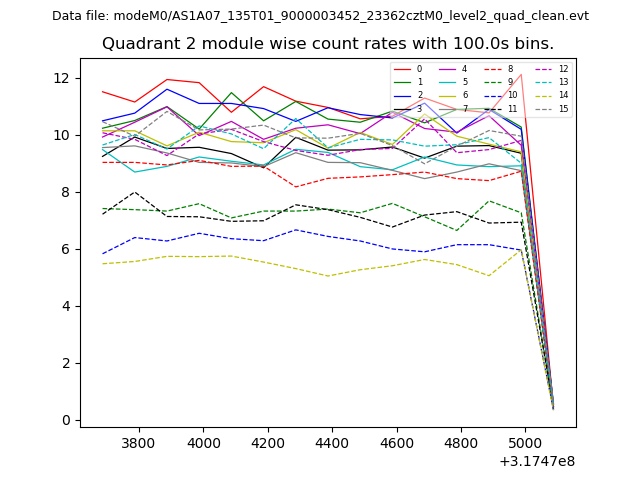 |
 |
| Module-wise count rates for Quadrant D Data is divided into 100 sec bins |
 |
 |
| Parameter | Plot |
|---|---|
| CZT HV Monitor | 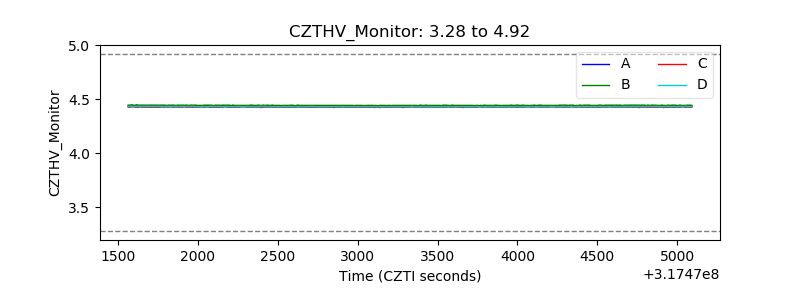 |
| D_VDD | 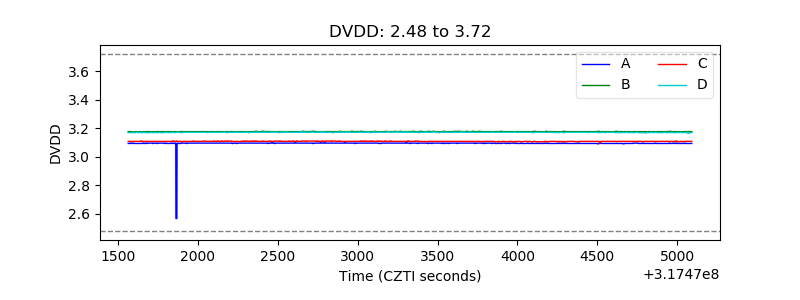 |
| Temperature 1 | 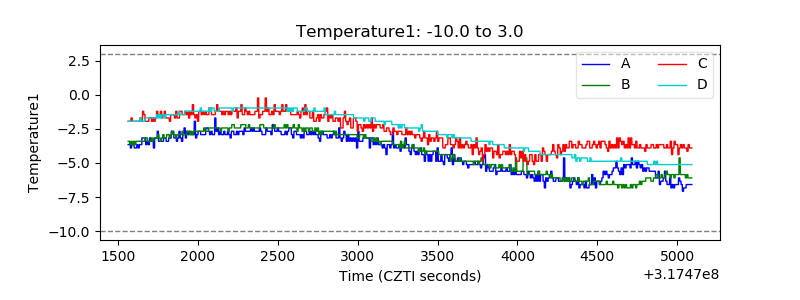 |
| Veto HV Monitor |  |
| Veto LLD | 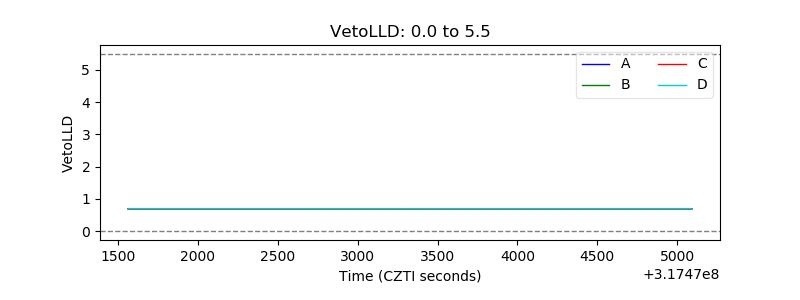 |
| Alpha Counter | 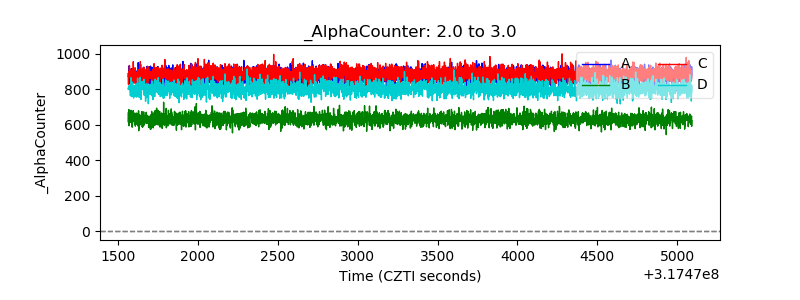 |
| _CPM_Rate | 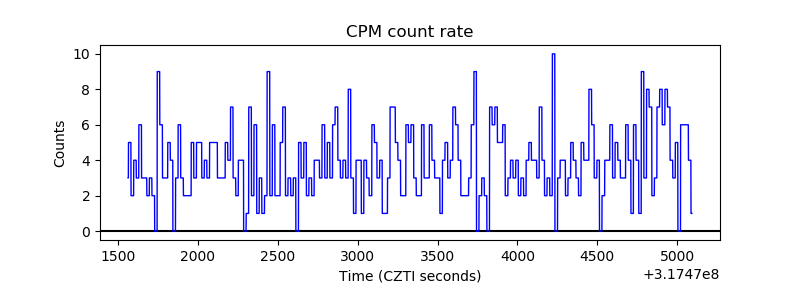 |
| CZT Counter |  |
| +2.5 Volts monitor | 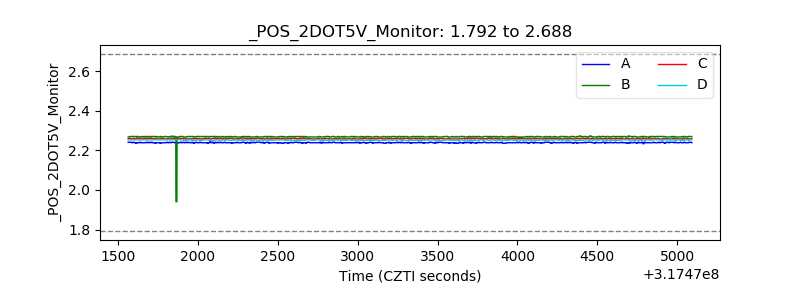 |
| +5 Volts monitor |  |
| _ROLL_ROT | 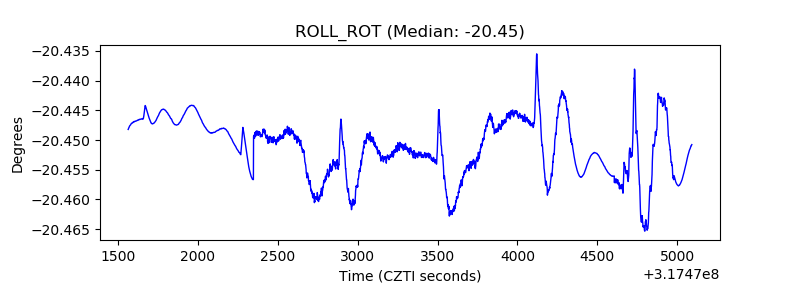 |
| _Roll_DEC |  |
| _Roll_RA |  |
| Veto Counter |  |