| Param | Original file | Final file |
|---|---|---|
| Filename | modeM0/AS1A07_138T06_9000003456cztM0_level2.fits | modeM0/AS1A07_138T06_9000003456cztM0_level2_quad_clean.evt |
| Size (bytes) | 186,727,680 | 177,943,680 |
| Size | 178.1 MB | 169.7 MB |
| Events in quadrant A | 1,163,874 | 1,075,715 |
| Events in quadrant B | 1,105,292 | 1,074,653 |
| Events in quadrant C | 1,093,566 | 986,572 |
| Events in quadrant D | 1,001,306 | 960,887 |
| Mode M0 | |||
|---|---|---|---|
| Quadrant | BADHDUFLAG | Total packets | Discarded packets |
| A | 0 | 38869 | 0 |
| B | 0 | 39966 | 0 |
| C | 0 | 64562 | 0 |
| D | 0 | 41955 | 0 |
| Mode M9 | |||
|---|---|---|---|
| Quadrant | BADHDUFLAG | Total packets | Discarded packets |
| A | 0 | 32 | 0 |
| B | 0 | 32 | 0 |
| C | 0 | 32 | 0 |
| D | 0 | 32 | 0 |
| Mode SS | |||
|---|---|---|---|
| Quadrant | BADHDUFLAG | Total packets | Discarded packets |
| A | 0 | 386 | 0 |
| B | 0 | 386 | 0 |
| C | 0 | 386 | 0 |
| D | 0 | 386 | 0 |
| Quadrant | Total seconds | Saturated seconds | Saturation percentage |
|---|---|---|---|
| A | 18716 | 299 | 1.597564% |
| B | 18716 | 394 | 2.105151% |
| C | 18716 | 1532 | 8.185510% |
| D | 18716 | 383 | 2.046377% |
Noise dominated data is calculated using 1-second bins in cleaned event files. If a bin has >2000 counts, and if more than 50% of those come from <1% of pixels, then it is considered to be noise-dominated and hence unusable.
| Quadrant | # 1 sec bins | Bins with >0 counts | Bins with >2000 counts | High rate bins dominated by noise | Noise dominated (total time) | Noise dominated (detector-on time) | Marked lightcurve |
|---|---|---|---|---|---|---|---|
| A | 22071 | 18714 | 0 | 0 | 0.00% | 0.00% |  |
| B | 22071 | 18712 | 0 | 0 | 0.00% | 0.00% |  |
| C | 22071 | 18712 | 0 | 0 | 0.00% | 0.00% |  |
| D | 22071 | 18712 | 0 | 0 | 0.00% | 0.00% |  |
Top three noisy pixels from each quadrant. If the there are fewer than three noisy pixels in the level2.evt file, extra rows are filled as -1
| Pixel properties | Quadrant properties | ||||||
|---|---|---|---|---|---|---|---|
| Quadrant | DetID | PixID | Counts | Sigma | Mean | Median | Sigma |
| A | 0 | 29 | 1122 | 11.15 | 302 | 285 | 75.0 |
| A | 7 | 110 | 951 | 8.88 | 302 | 285 | 75.0 |
| A | 0 | 30 | 868 | 7.77 | 302 | 285 | 75.0 |
| B | 2 | 9 | 931 | 10.98 | 292 | 279 | 59.4 |
| B | 5 | 128 | 759 | 8.09 | 292 | 279 | 59.4 |
| B | 2 | 8 | 750 | 7.93 | 292 | 279 | 59.4 |
| C | 1 | 80 | 854 | 7.92 | 288 | 272 | 73.5 |
| C | 1 | 81 | 838 | 7.7 | 288 | 272 | 73.5 |
| C | 12 | 241 | 761 | 6.65 | 288 | 272 | 73.5 |
| D | 15 | 46 | 738 | 6.19 | 286 | 261 | 77.0 |
| D | 7 | 3 | 724 | 6.01 | 286 | 261 | 77.0 |
| D | 3 | 14 | 719 | 5.95 | 286 | 261 | 77.0 |
Histogram calculated using DETX and DETY for each event in the final _common_clean file
| Quadrant A |  |
 |
Quadrant B |
|---|---|---|---|
| Quadrant D |  |
 |
Quadrant C |
| Plot type | Count rate plots | Images |
|---|---|---|
| Comparison with Poisson distribution Blue bars denote a histogram of data divided into 1 sec bins. Red curve is a Poisson curve with rate = median count rate of data. |
 |
 |
| Quadrant-wise count rates Data is divided into 100 sec bins |
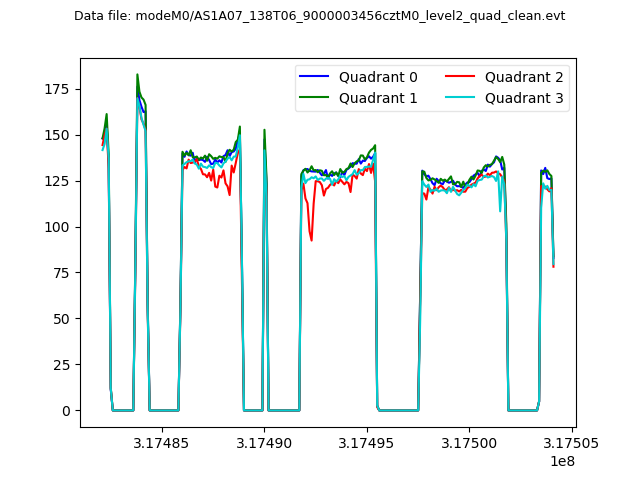 |
|
| Module-wise count rates for Quadrant A Data is divided into 100 sec bins |
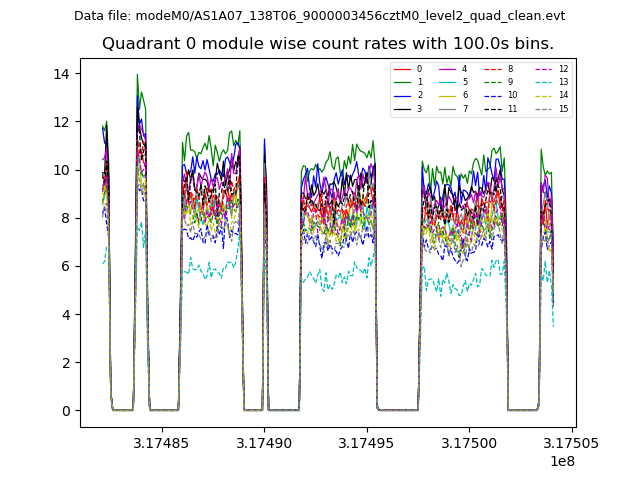 |
 |
| Module-wise count rates for Quadrant B Data is divided into 100 sec bins |
 |
 |
| Module-wise count rates for Quadrant C Data is divided into 100 sec bins |
 |
 |
| Module-wise count rates for Quadrant D Data is divided into 100 sec bins |
 |
 |
| Parameter | Plot |
|---|---|
| CZT HV Monitor |  |
| D_VDD | 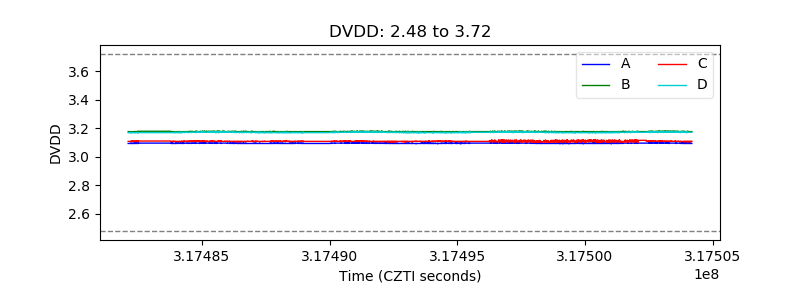 |
| Temperature 1 |  |
| Veto HV Monitor | 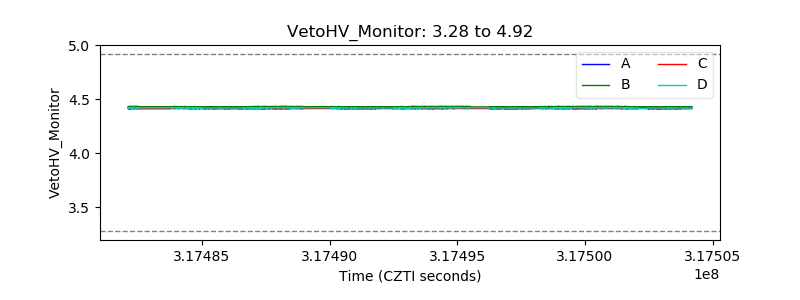 |
| Veto LLD |  |
| Alpha Counter | 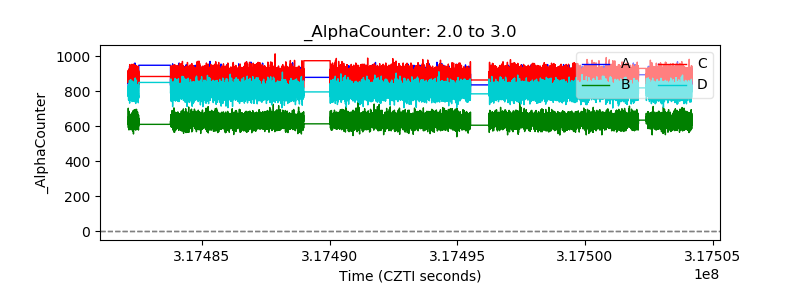 |
| _CPM_Rate |  |
| CZT Counter |  |
| +2.5 Volts monitor | 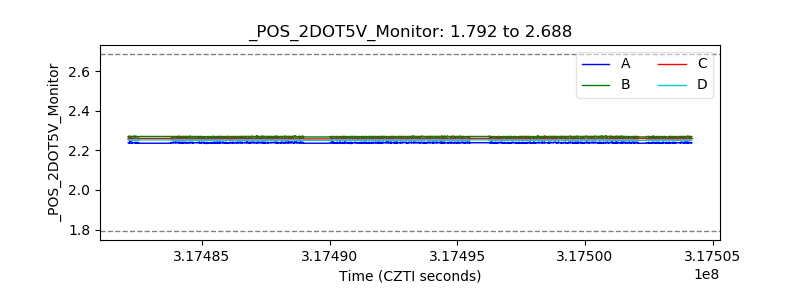 |
| +5 Volts monitor |  |
| _ROLL_ROT | 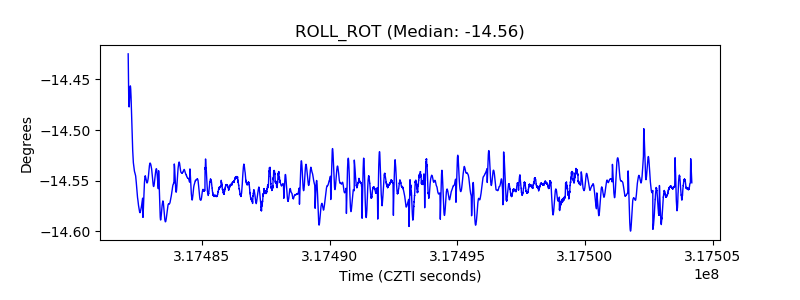 |
| _Roll_DEC |  |
| _Roll_RA |  |
| Veto Counter | 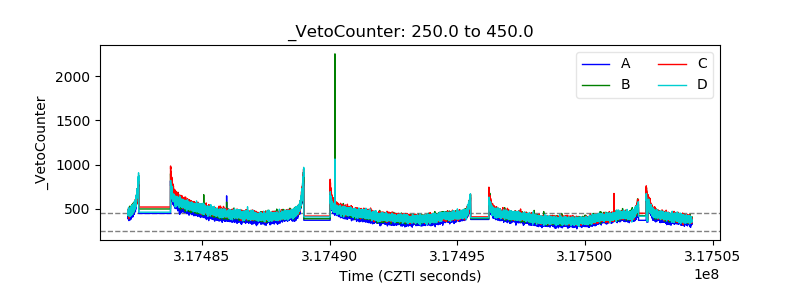 |