| Param | Original file | Final file |
|---|---|---|
| Filename | modeM0/AS1A07_138T06_9000003456_23363cztM0_level2.evt | modeM0/AS1A07_138T06_9000003456_23363cztM0_level2_quad_clean.evt |
| Size (bytes) | 176,636,160 | 25,395,840 |
| Size | 168.5 MB | 24.2 MB |
| Events in quadrant A | 1,108,213 | 157,320 |
| Events in quadrant B | 1,149,738 | 162,336 |
| Events in quadrant C | 1,793,695 | 152,439 |
| Events in quadrant D | 1,161,971 | 153,281 |
| Mode M0 | |||
|---|---|---|---|
| Quadrant | BADHDUFLAG | Total packets | Discarded packets |
| A | 0 | 4424 | 1 |
| B | 0 | 4619 | 1 |
| C | 0 | 6753 | 1 |
| D | 0 | 4613 | 1 |
| Mode M9 | |||
|---|---|---|---|
| Quadrant | BADHDUFLAG | Total packets | Discarded packets |
| A | 0 | 12 | 0 |
| B | 0 | 12 | 0 |
| C | 0 | 12 | 0 |
| D | 0 | 12 | 0 |
| Mode SS | |||
|---|---|---|---|
| Quadrant | BADHDUFLAG | Total packets | Discarded packets |
| A | 0 | 42 | 0 |
| B | 0 | 42 | 0 |
| C | 0 | 42 | 0 |
| D | 0 | 42 | 0 |
| Quadrant | Total seconds | Saturated seconds | Saturation percentage |
|---|---|---|---|
| A | 1964 | 110 | 5.600815% |
| B | 1964 | 127 | 6.466395% |
| C | 1964 | 203 | 10.336049% |
| D | 1964 | 98 | 4.989817% |
Noise dominated data is calculated using 1-second bins in cleaned event files. If a bin has >2000 counts, and if more than 50% of those come from <1% of pixels, then it is considered to be noise-dominated and hence unusable.
| Quadrant | # 1 sec bins | Bins with >0 counts | Bins with >2000 counts | High rate bins dominated by noise | Noise dominated (total time) | Noise dominated (detector-on time) | Marked lightcurve |
|---|---|---|---|---|---|---|---|
| A | 3209 | 1964 | 0 | 0 | 0.00% | 0.00% | 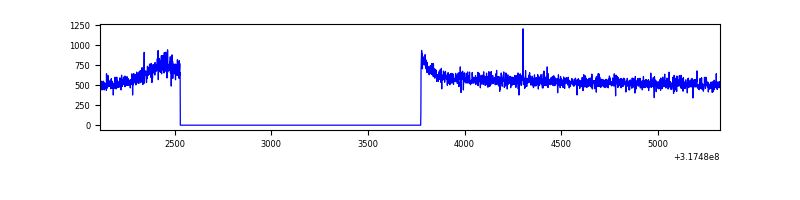 |
| B | 3209 | 1964 | 0 | 0 | 0.00% | 0.00% | 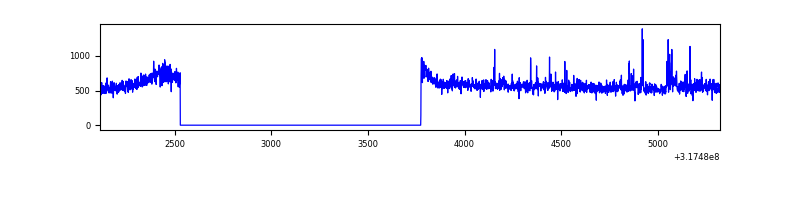 |
| C | 3209 | 1964 | 32 | 32 | 1.00% | 1.63% | 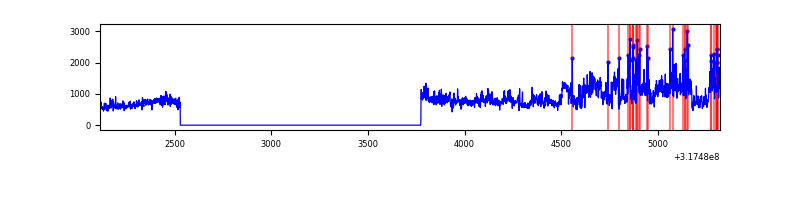 |
| D | 3209 | 1964 | 1 | 1 | 0.03% | 0.05% | 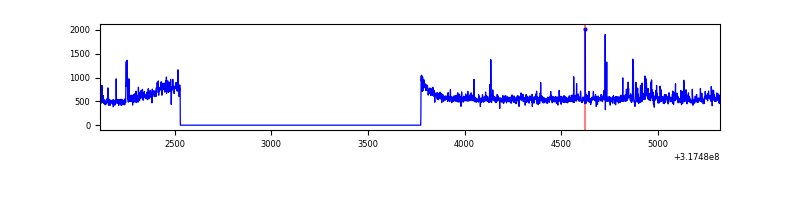 |
Top three noisy pixels from each quadrant. If the there are fewer than three noisy pixels in the level2.evt file, extra rows are filled as -1
| Pixel properties | Quadrant properties | ||||||
|---|---|---|---|---|---|---|---|
| Quadrant | DetID | PixID | Counts | Sigma | Mean | Median | Sigma |
| A | 13 | 254 | 3361 | 52.18 | 287 | 281 | 59.0 |
| A | 0 | 226 | 2484 | 37.32 | 287 | 281 | 59.0 |
| A | 3 | 137 | 2358 | 35.19 | 287 | 281 | 59.0 |
| B | 0 | 190 | 28564 | 518.36 | 281 | 273 | 54.6 |
| B | 0 | 229 | 8369 | 148.34 | 281 | 273 | 54.6 |
| B | 0 | 245 | 6297 | 110.37 | 281 | 273 | 54.6 |
| C | 0 | 239 | 684304 | 10936.21 | 269 | 270 | 62.5 |
| C | 14 | 238 | 43119 | 685.06 | 269 | 270 | 62.5 |
| C | 7 | 247 | 8008 | 123.71 | 269 | 270 | 62.5 |
| D | 1 | 52 | 60664 | 867.47 | 282 | 272 | 69.6 |
| D | 9 | 85 | 13772 | 193.91 | 282 | 272 | 69.6 |
| D | 12 | 233 | 12365 | 173.7 | 282 | 272 | 69.6 |
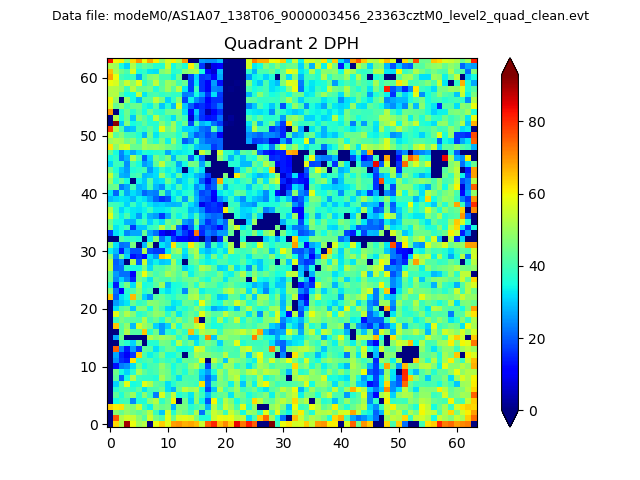
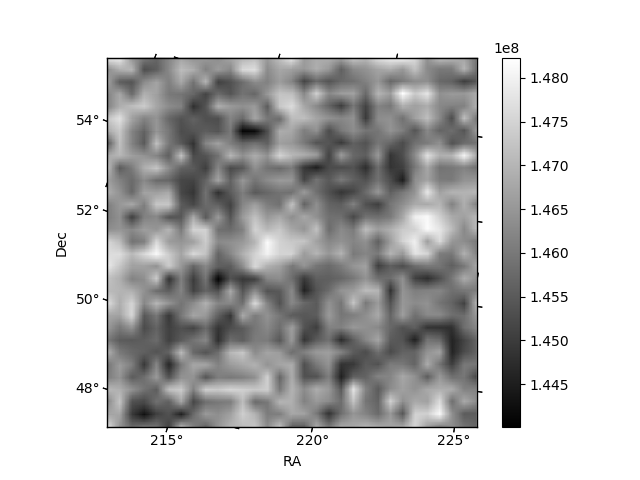
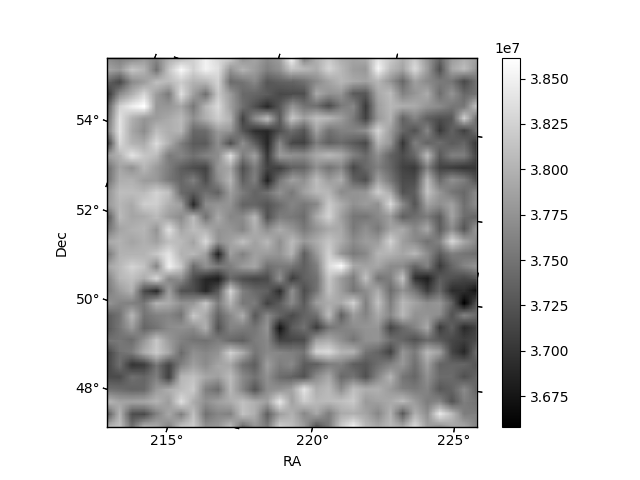
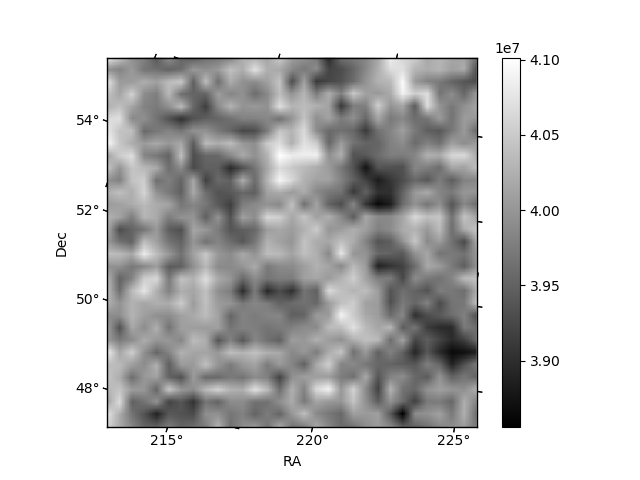
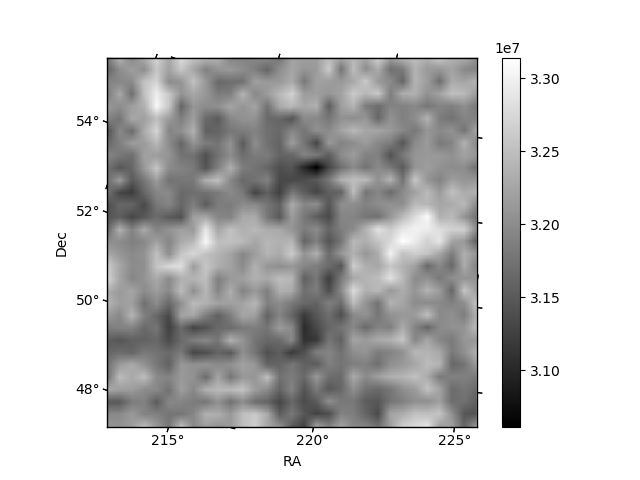
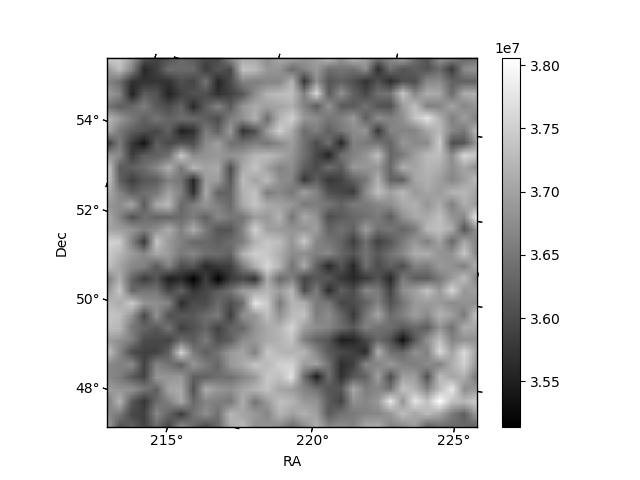
Histogram calculated using DETX and DETY for each event in the final _common_clean file
| Quadrant A | 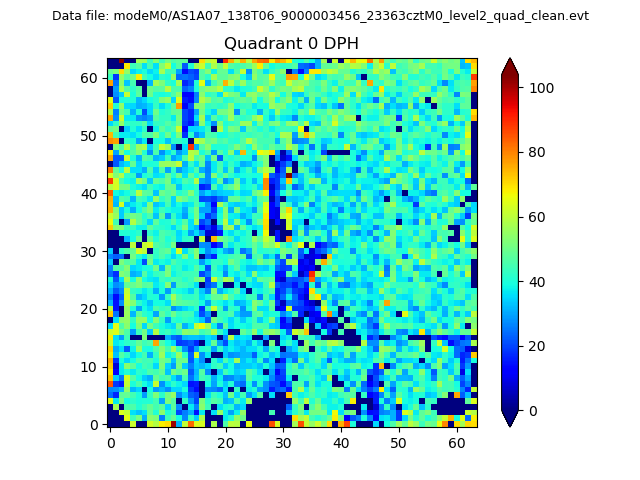 |
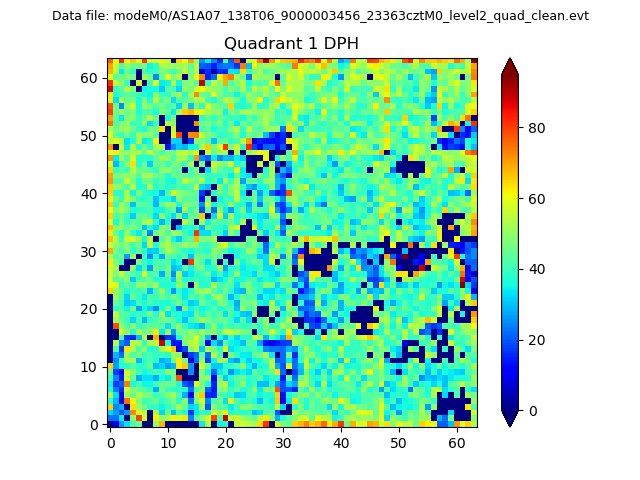 |
Quadrant B |
|---|---|---|---|
| Quadrant D | 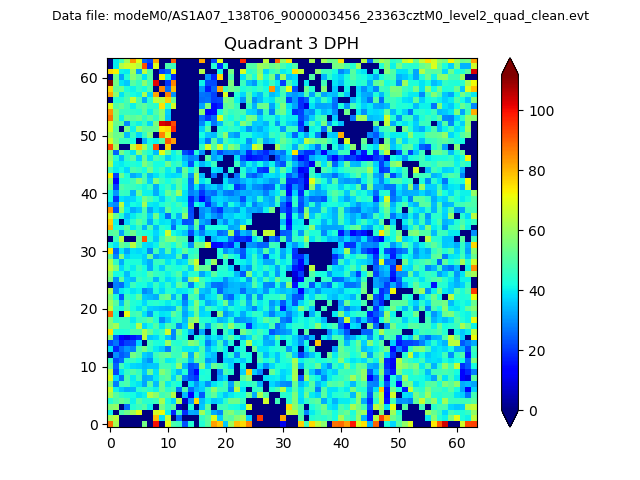 |
 |
Quadrant C |
| Plot type | Count rate plots | Images |
|---|---|---|
| Comparison with Poisson distribution Blue bars denote a histogram of data divided into 1 sec bins. Red curve is a Poisson curve with rate = median count rate of data. |
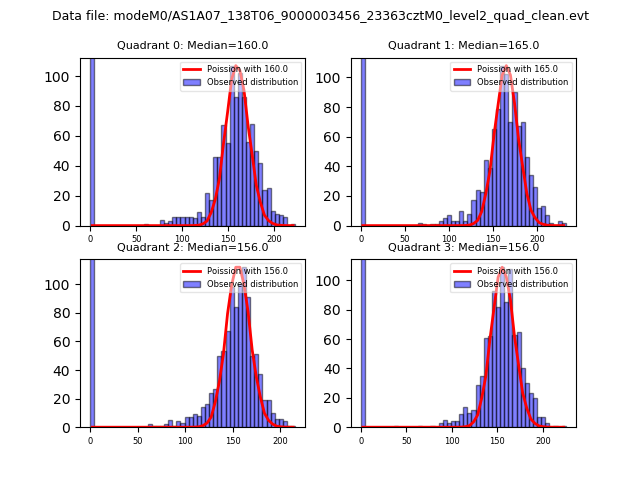 |
 |
| Quadrant-wise count rates Data is divided into 100 sec bins |
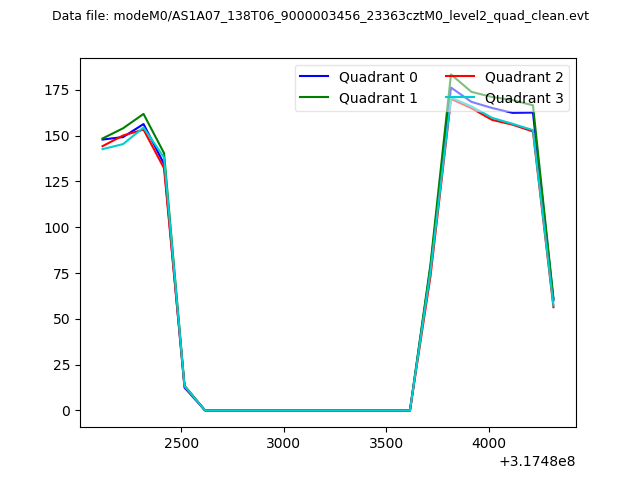 |
|
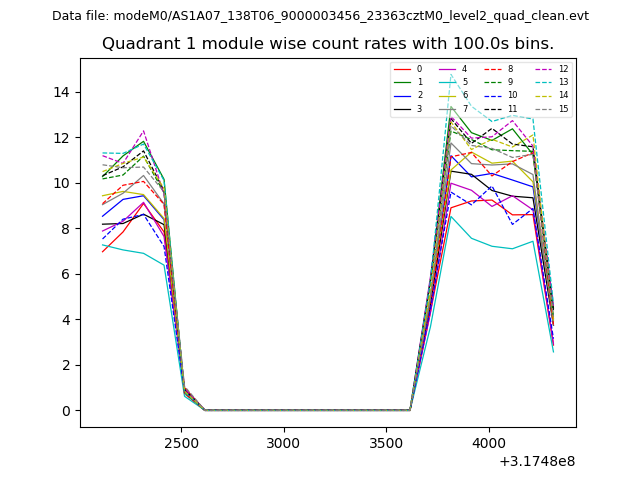
| Module-wise count rates for Quadrant A Data is divided into 100 sec bins |
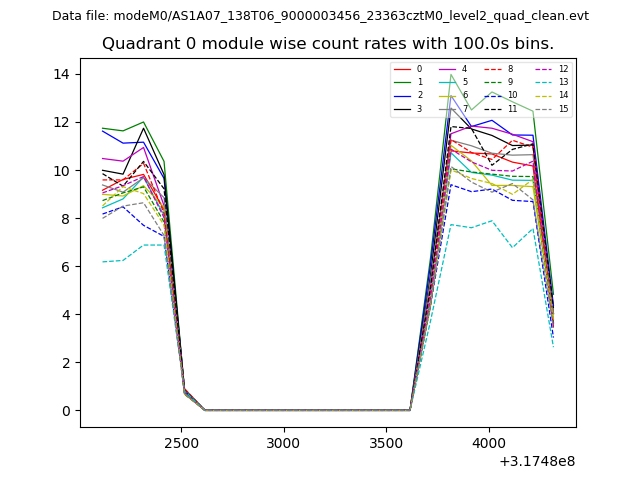 |
 |
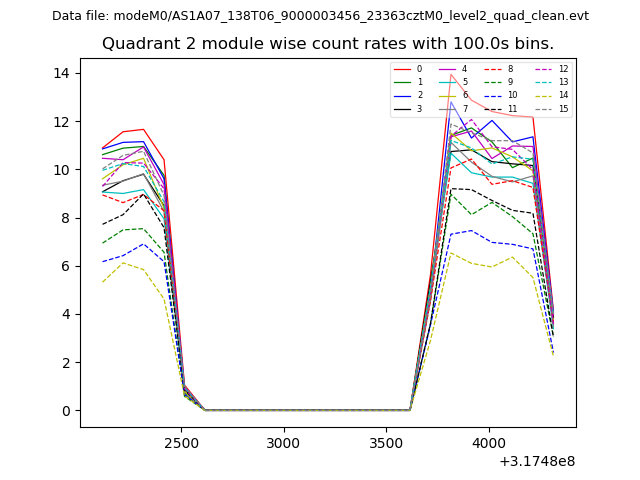
| Module-wise count rates for Quadrant B Data is divided into 100 sec bins |
 |
 |
| Module-wise count rates for Quadrant C Data is divided into 100 sec bins |
 |
 |
| Module-wise count rates for Quadrant D Data is divided into 100 sec bins |
 |
 |
| Parameter | Plot |
|---|---|
| CZT HV Monitor | 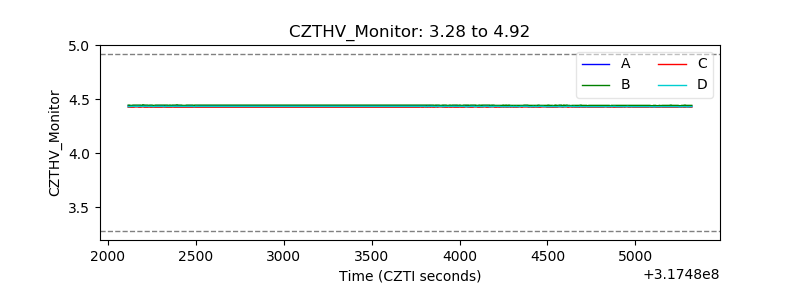 |
| D_VDD |  |
| Temperature 1 | 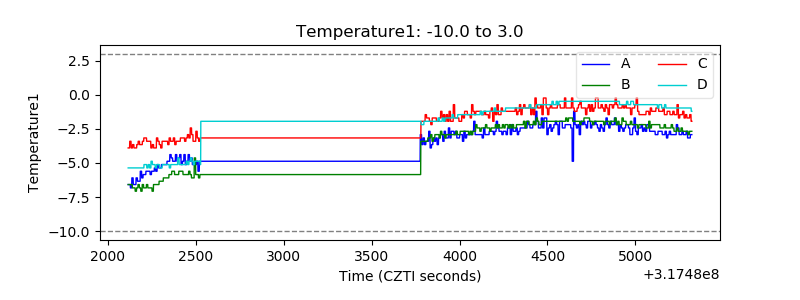 |
| Veto HV Monitor | 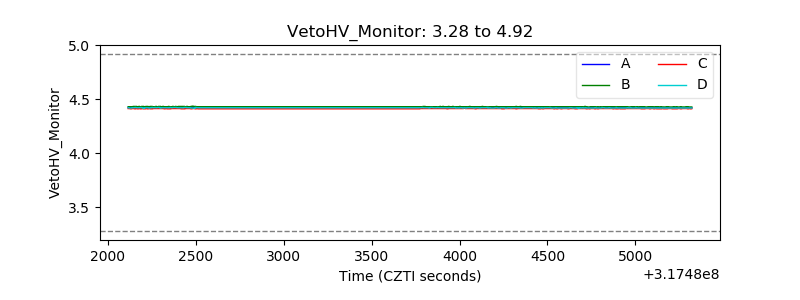 |
| Veto LLD |  |
| Alpha Counter | 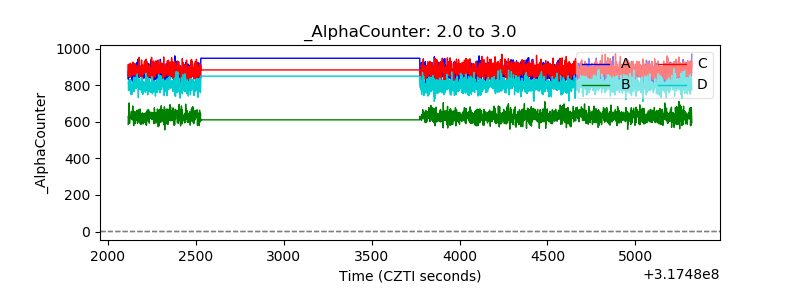 |
| _CPM_Rate | 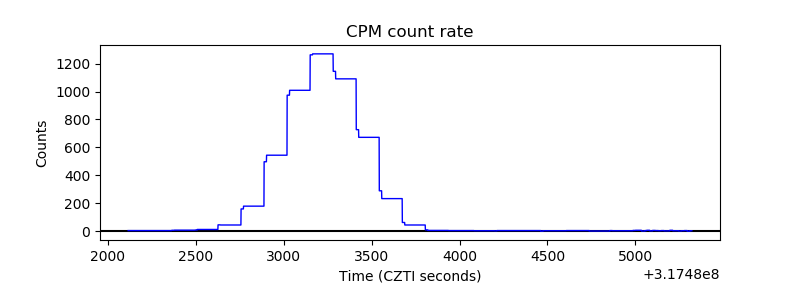 |
| CZT Counter | 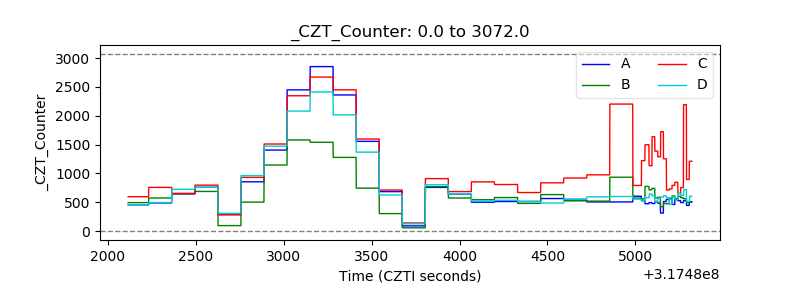 |
| +2.5 Volts monitor |  |
| +5 Volts monitor |  |
| _ROLL_ROT | 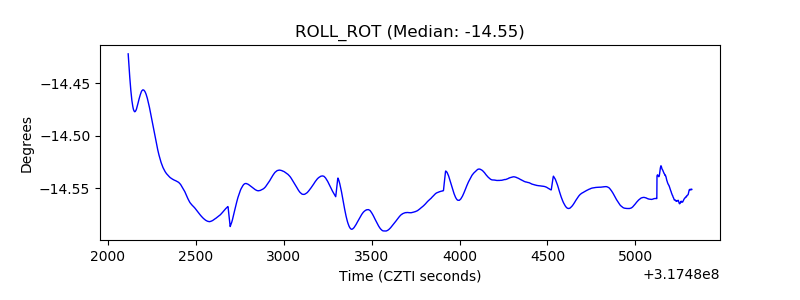 |
| _Roll_DEC | 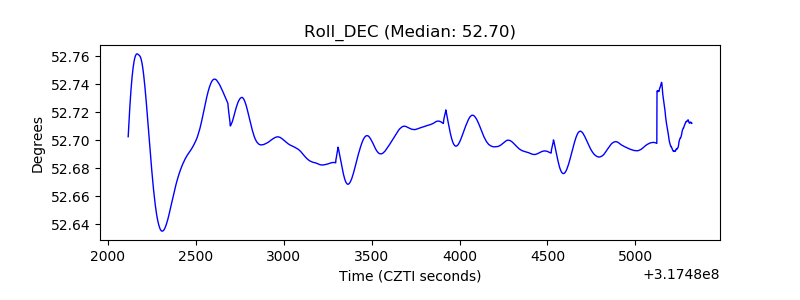 |
| _Roll_RA | 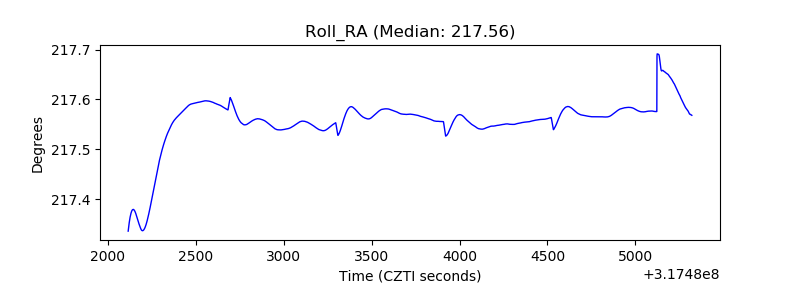 |
| Veto Counter | 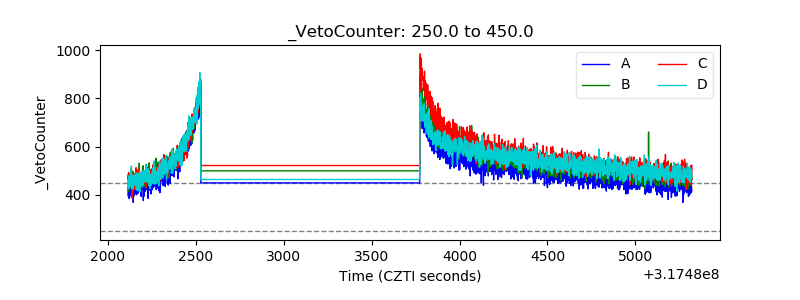 |