| Param | Original file | Final file |
|---|---|---|
| Filename | modeM0/AS1A07_138T06_9000003456_23364cztM0_level2.evt | modeM0/AS1A07_138T06_9000003456_23364cztM0_level2_quad_clean.evt |
| Size (bytes) | 542,174,400 | 72,253,440 |
| Size | 517.1 MB | 68.9 MB |
| Events in quadrant A | 3,083,354 | 445,869 |
| Events in quadrant B | 3,246,298 | 450,681 |
| Events in quadrant C | 6,379,346 | 419,415 |
| Events in quadrant D | 3,288,384 | 436,521 |
| Mode M0 | |||
|---|---|---|---|
| Quadrant | BADHDUFLAG | Total packets | Discarded packets |
| A | 0 | 12895 | 1 |
| B | 0 | 13390 | 1 |
| C | 0 | 23371 | 1 |
| D | 0 | 13680 | 1 |
| Mode M9 | |||
|---|---|---|---|
| Quadrant | BADHDUFLAG | Total packets | Discarded packets |
| A | 0 | 10 | 0 |
| B | 0 | 10 | 0 |
| C | 0 | 10 | 0 |
| D | 0 | 10 | 0 |
| Mode SS | |||
|---|---|---|---|
| Quadrant | BADHDUFLAG | Total packets | Discarded packets |
| A | 0 | 128 | 0 |
| B | 0 | 128 | 0 |
| C | 0 | 128 | 0 |
| D | 0 | 128 | 0 |
| Quadrant | Total seconds | Saturated seconds | Saturation percentage |
|---|---|---|---|
| A | 6228 | 111 | 1.782274% |
| B | 6229 | 119 | 1.910419% |
| C | 6229 | 600 | 9.632365% |
| D | 6229 | 105 | 1.685664% |
Noise dominated data is calculated using 1-second bins in cleaned event files. If a bin has >2000 counts, and if more than 50% of those come from <1% of pixels, then it is considered to be noise-dominated and hence unusable.
| Quadrant | # 1 sec bins | Bins with >0 counts | Bins with >2000 counts | High rate bins dominated by noise | Noise dominated (total time) | Noise dominated (detector-on time) | Marked lightcurve |
|---|---|---|---|---|---|---|---|
| A | 7263 | 6228 | 0 | 0 | 0.00% | 0.00% | 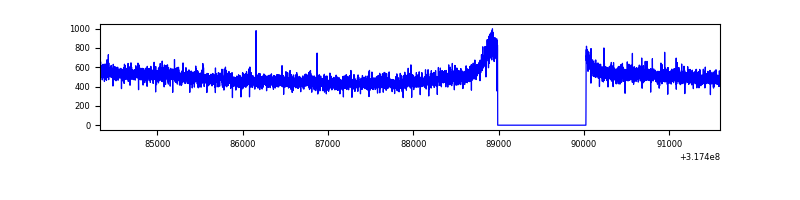 |
| B | 7264 | 6229 | 2 | 2 | 0.03% | 0.03% | 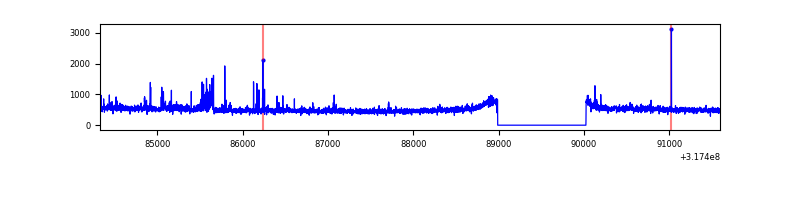 |
| C | 7264 | 6229 | 230 | 230 | 3.17% | 3.69% | 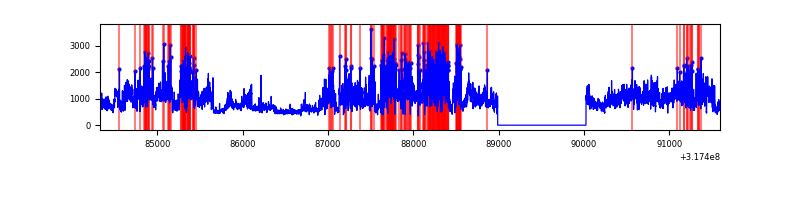 |
| D | 7264 | 6229 | 6 | 6 | 0.08% | 0.10% | 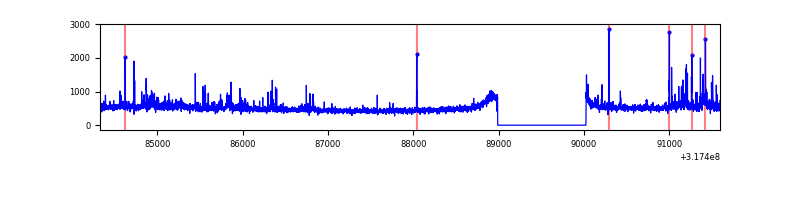 |
Top three noisy pixels from each quadrant. If the there are fewer than three noisy pixels in the level2.evt file, extra rows are filled as -1
| Pixel properties | Quadrant properties | ||||||
|---|---|---|---|---|---|---|---|
| Quadrant | DetID | PixID | Counts | Sigma | Mean | Median | Sigma |
| A | 13 | 254 | 10282 | 59.9 | 799 | 783 | 158.6 |
| A | 0 | 226 | 6938 | 38.81 | 799 | 783 | 158.6 |
| A | 3 | 137 | 6723 | 37.46 | 799 | 783 | 158.6 |
| B | 0 | 190 | 85276 | 568.92 | 789 | 769 | 148.5 |
| B | 0 | 189 | 18015 | 116.1 | 789 | 769 | 148.5 |
| B | 12 | 111 | 17348 | 111.61 | 789 | 769 | 148.5 |
| C | 0 | 239 | 3283567 | 18844.46 | 755 | 759 | 174.2 |
| C | 14 | 238 | 120835 | 689.28 | 755 | 759 | 174.2 |
| C | 7 | 247 | 21627 | 119.79 | 755 | 759 | 174.2 |
| D | 1 | 52 | 182201 | 954.55 | 785 | 762 | 190.1 |
| D | 2 | 152 | 52476 | 272.07 | 785 | 762 | 190.1 |
| D | 12 | 233 | 31486 | 161.64 | 785 | 762 | 190.1 |
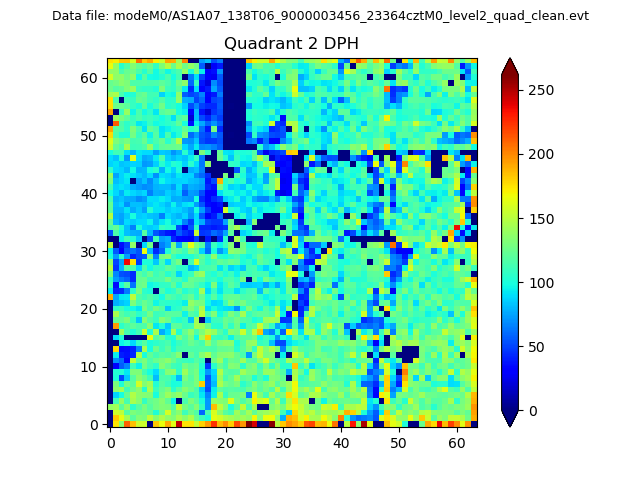
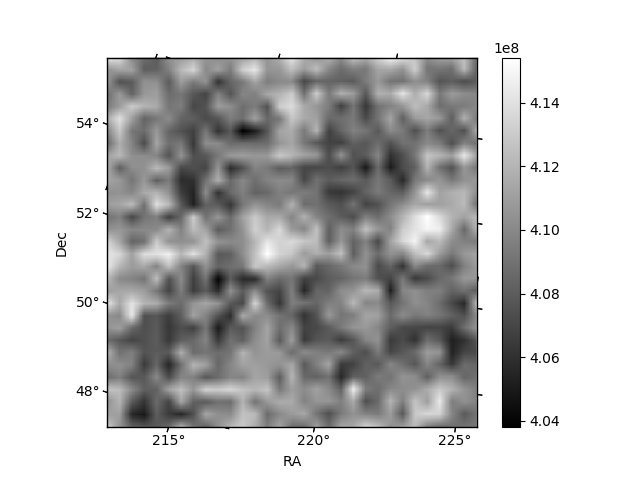
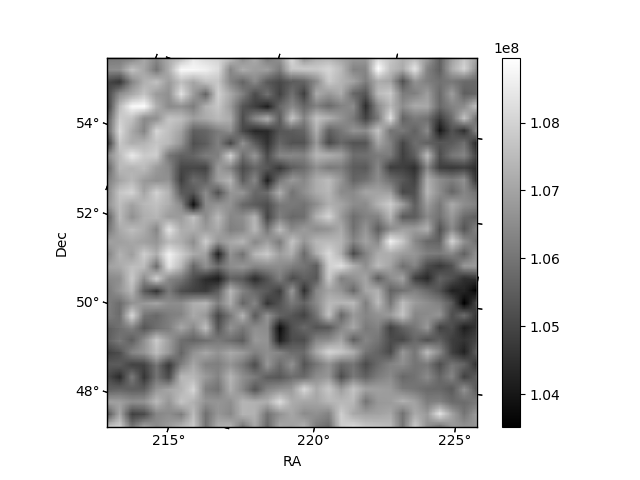
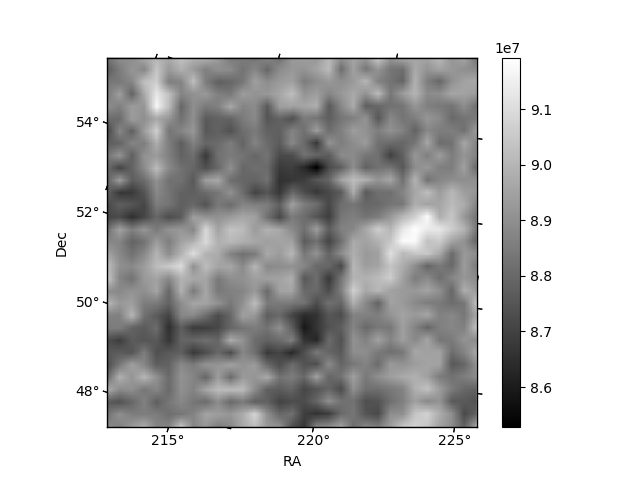
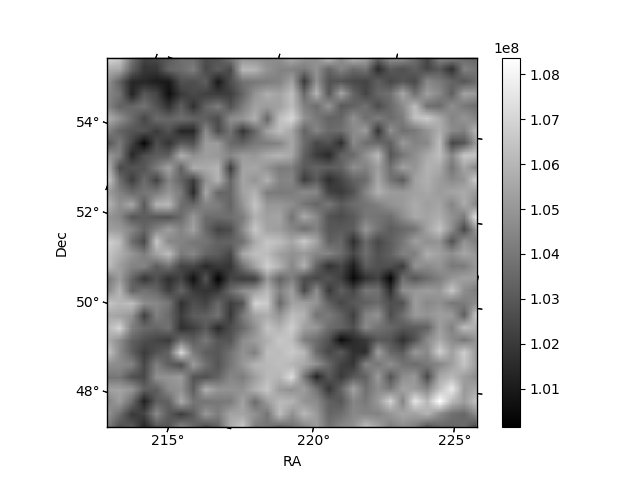
Histogram calculated using DETX and DETY for each event in the final _common_clean file
| Quadrant A | 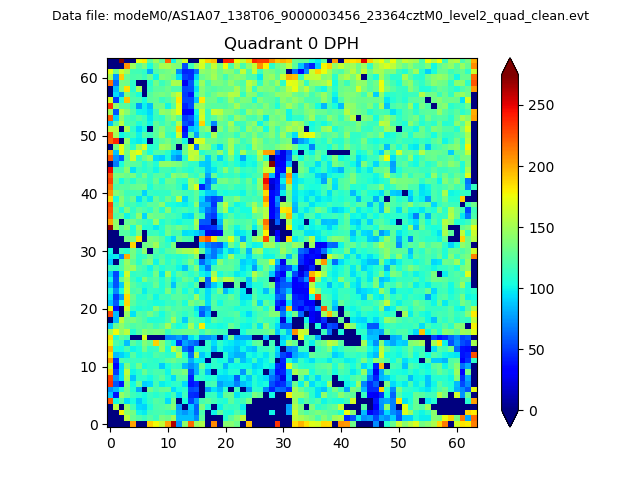 |
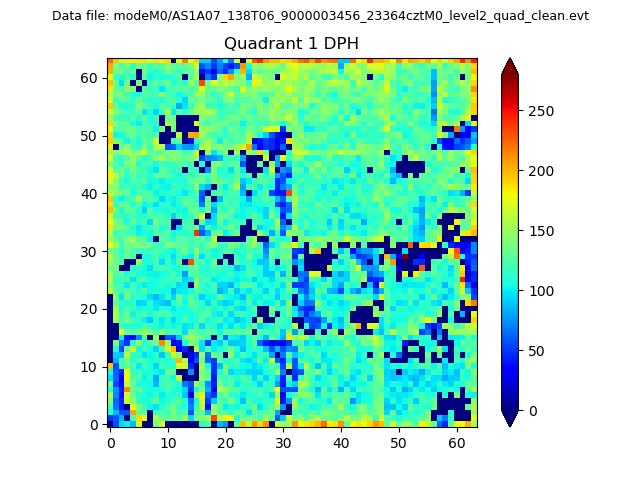 |
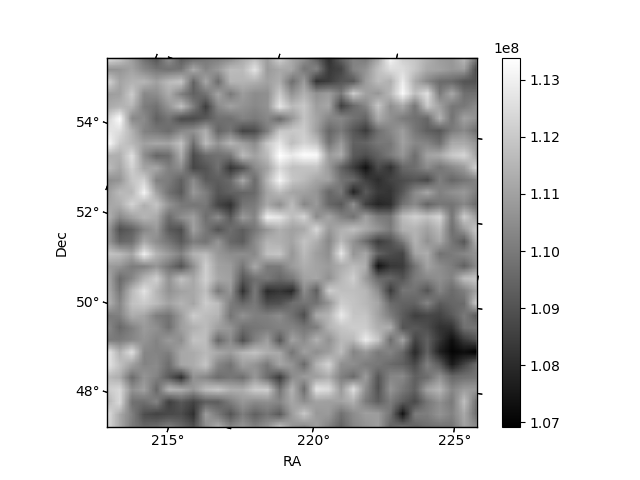
Quadrant B |
|---|---|---|---|
| Quadrant D | 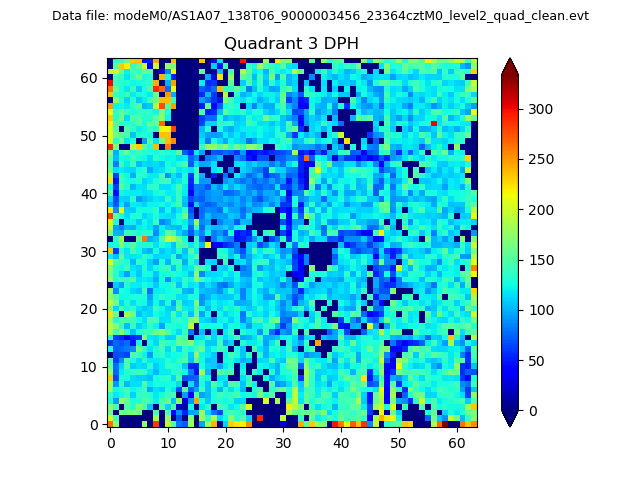 |
 |
Quadrant C |
| Plot type | Count rate plots | Images |
|---|---|---|
| Comparison with Poisson distribution Blue bars denote a histogram of data divided into 1 sec bins. Red curve is a Poisson curve with rate = median count rate of data. |
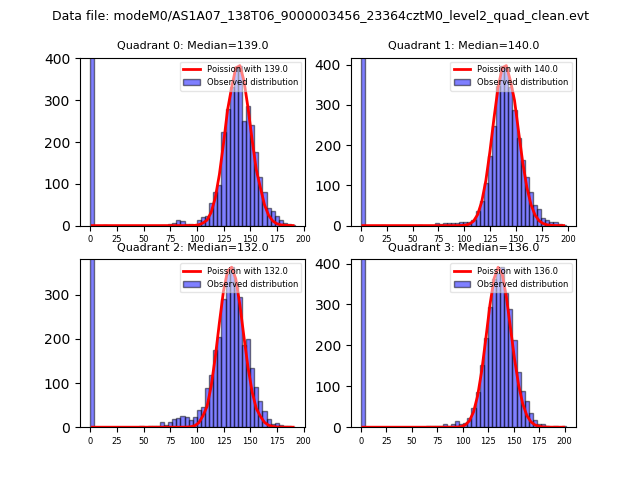 |
 |
| Quadrant-wise count rates Data is divided into 100 sec bins |
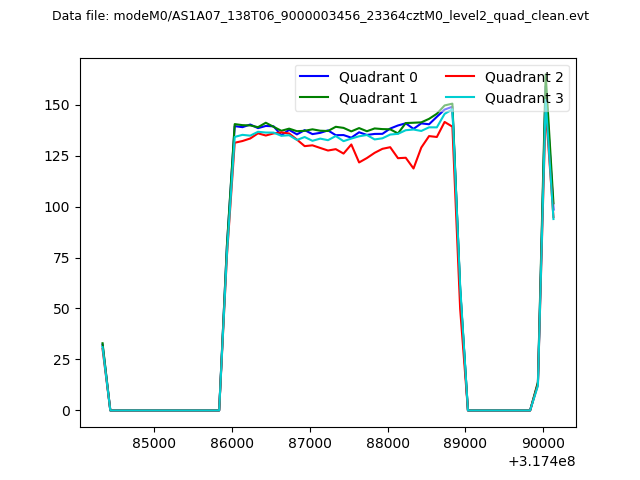 |
|
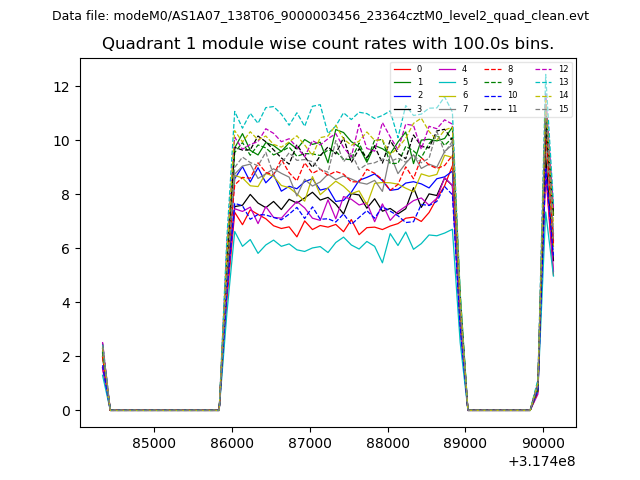
| Module-wise count rates for Quadrant A Data is divided into 100 sec bins |
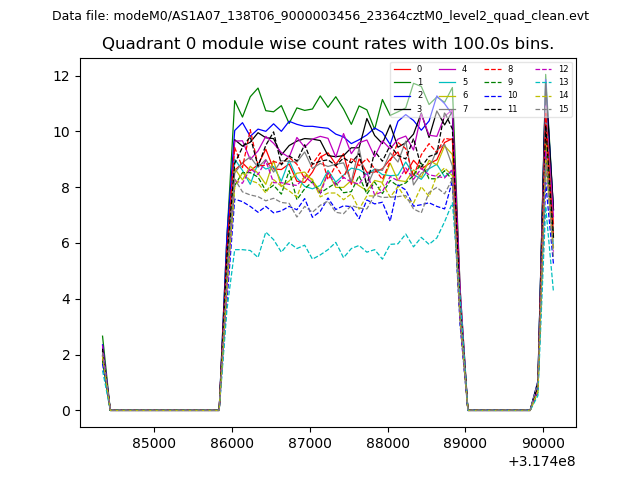 |
 |
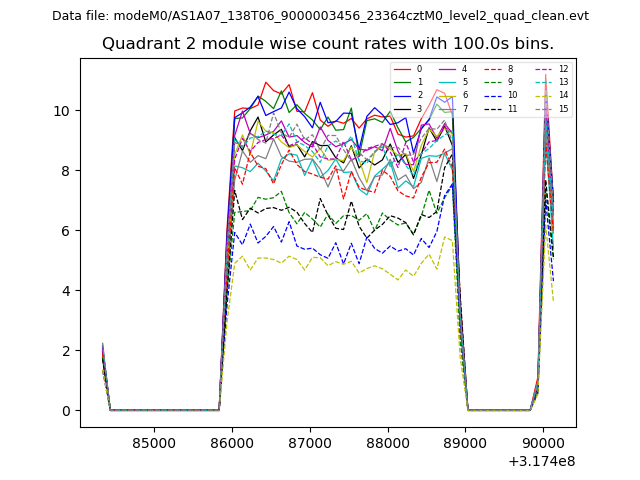
| Module-wise count rates for Quadrant B Data is divided into 100 sec bins |
 |
 |
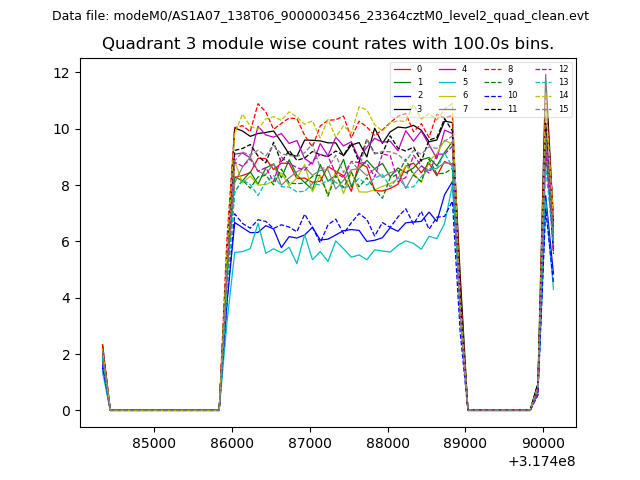
| Module-wise count rates for Quadrant C Data is divided into 100 sec bins |
 |
 |
| Module-wise count rates for Quadrant D Data is divided into 100 sec bins |
 |
 |
| Parameter | Plot |
|---|---|
| CZT HV Monitor | 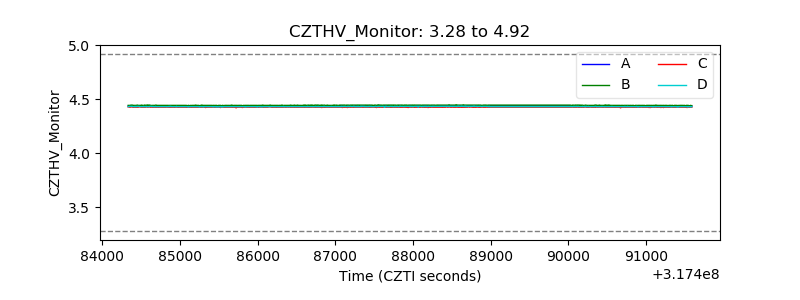 |
| D_VDD | 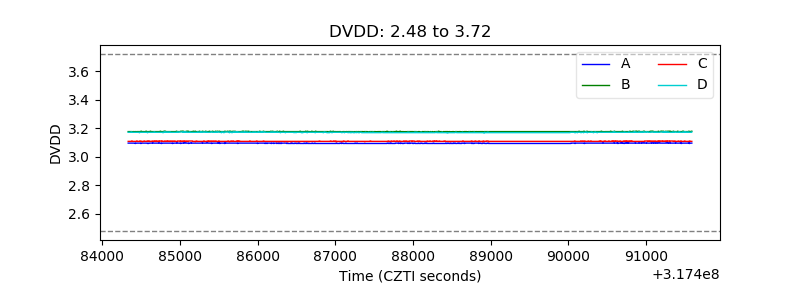 |
| Temperature 1 | 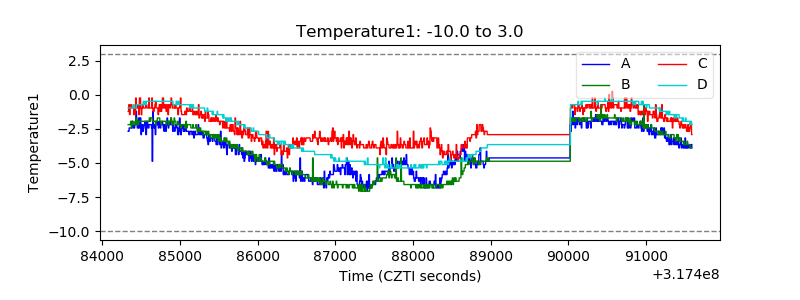 |
| Veto HV Monitor | 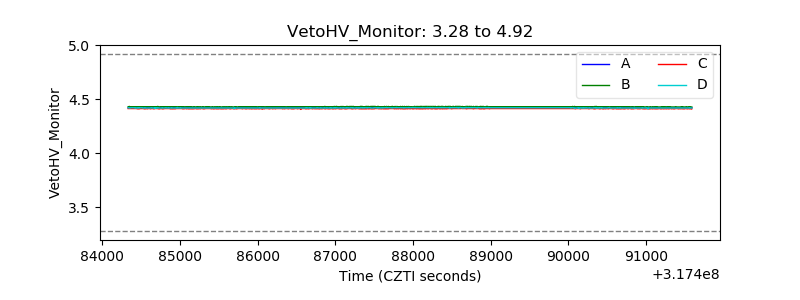 |
| Veto LLD | 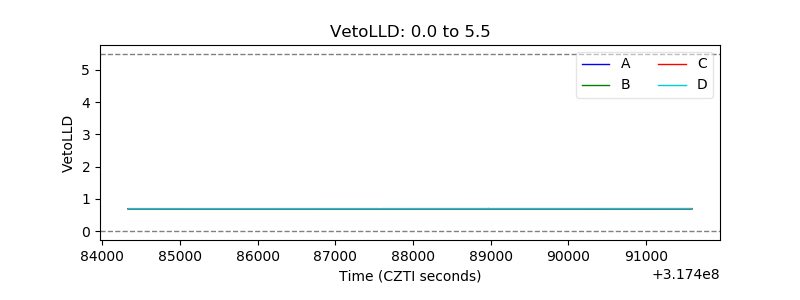 |
| Alpha Counter | 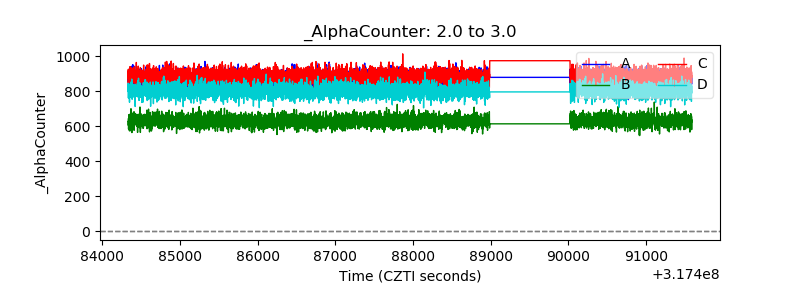 |
| _CPM_Rate | 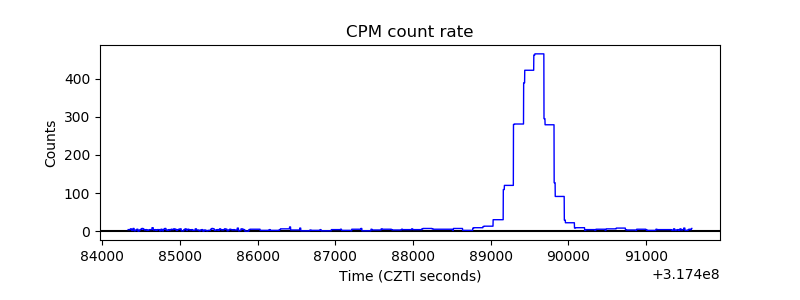 |
| CZT Counter | 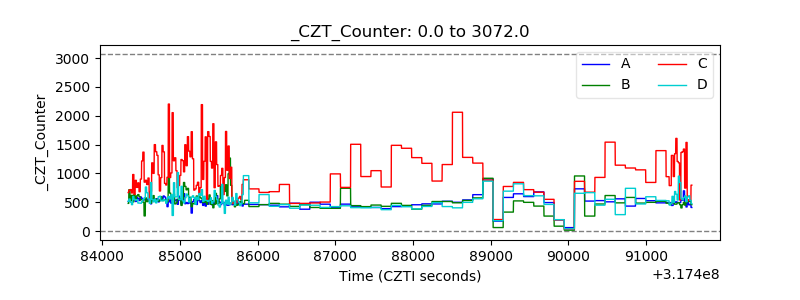 |
| +2.5 Volts monitor |  |
| +5 Volts monitor | 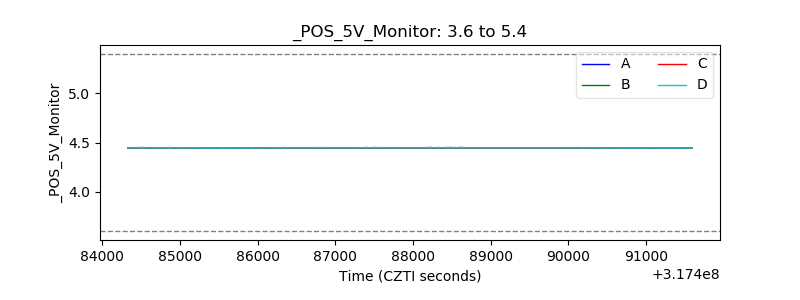 |
| _ROLL_ROT | 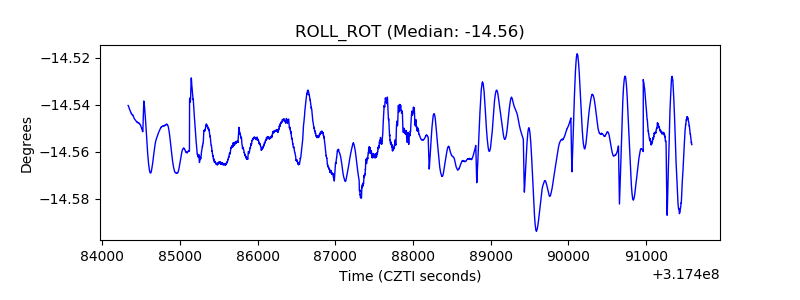 |
| _Roll_DEC | 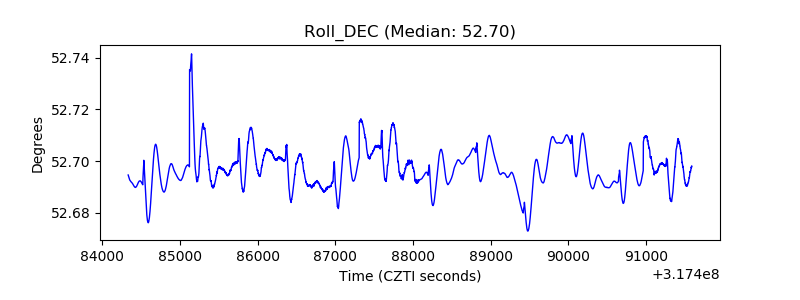 |
| _Roll_RA | 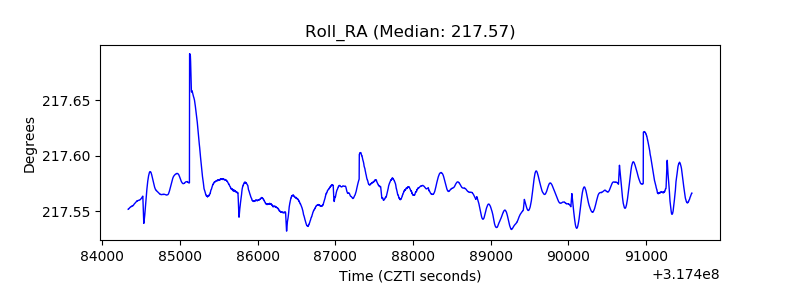 |
| Veto Counter | 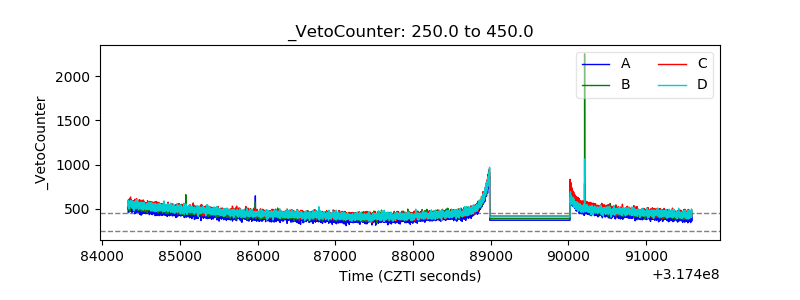 |