| Param | Original file | Final file |
|---|---|---|
| Filename | modeM0/AS1A07_138T06_9000003456_23365cztM0_level2.evt | modeM0/AS1A07_138T06_9000003456_23365cztM0_level2_quad_clean.evt |
| Size (bytes) | 594,820,800 | 81,423,360 |
| Size | 567.3 MB | 77.7 MB |
| Events in quadrant A | 3,299,877 | 506,859 |
| Events in quadrant B | 3,410,889 | 512,296 |
| Events in quadrant C | 7,216,930 | 473,631 |
| Events in quadrant D | 3,619,730 | 492,286 |
| Mode M0 | |||
|---|---|---|---|
| Quadrant | BADHDUFLAG | Total packets | Discarded packets |
| A | 0 | 14123 | 1 |
| B | 0 | 14402 | 1 |
| C | 0 | 26383 | 1 |
| D | 0 | 15225 | 1 |
| Mode M9 | |||
|---|---|---|---|
| Quadrant | BADHDUFLAG | Total packets | Discarded packets |
| A | 0 | 7 | 0 |
| B | 0 | 7 | 0 |
| C | 0 | 7 | 0 |
| D | 0 | 7 | 0 |
| Mode SS | |||
|---|---|---|---|
| Quadrant | BADHDUFLAG | Total packets | Discarded packets |
| A | 0 | 140 | 0 |
| B | 0 | 140 | 0 |
| C | 0 | 140 | 0 |
| D | 0 | 140 | 0 |
| Quadrant | Total seconds | Saturated seconds | Saturation percentage |
|---|---|---|---|
| A | 6893 | 51 | 0.739881% |
| B | 6894 | 79 | 1.145924% |
| C | 6894 | 704 | 10.211778% |
| D | 6894 | 81 | 1.174935% |
Noise dominated data is calculated using 1-second bins in cleaned event files. If a bin has >2000 counts, and if more than 50% of those come from <1% of pixels, then it is considered to be noise-dominated and hence unusable.
| Quadrant | # 1 sec bins | Bins with >0 counts | Bins with >2000 counts | High rate bins dominated by noise | Noise dominated (total time) | Noise dominated (detector-on time) | Marked lightcurve |
|---|---|---|---|---|---|---|---|
| A | 7613 | 6894 | 0 | 0 | 0.00% | 0.00% | 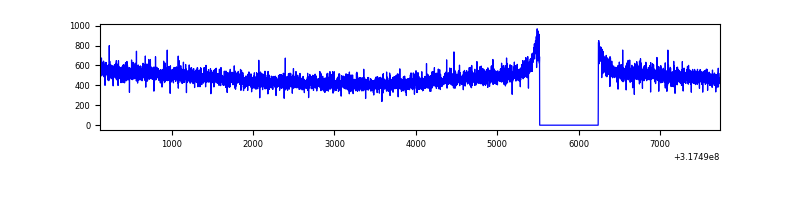 |
| B | 7614 | 6895 | 8 | 8 | 0.11% | 0.12% | 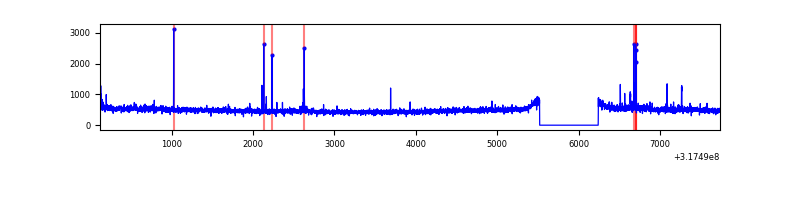 |
| C | 7614 | 6894 | 263 | 263 | 3.45% | 3.81% |  |
| D | 7614 | 6894 | 38 | 38 | 0.50% | 0.55% | 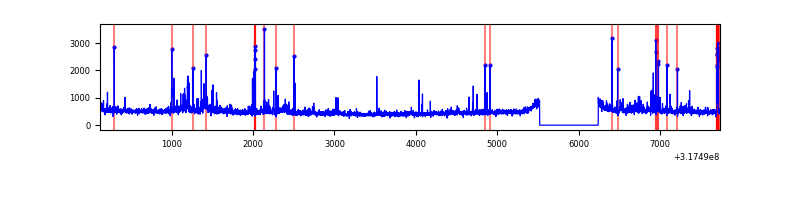 |
Top three noisy pixels from each quadrant. If the there are fewer than three noisy pixels in the level2.evt file, extra rows are filled as -1
| Pixel properties | Quadrant properties | ||||||
|---|---|---|---|---|---|---|---|
| Quadrant | DetID | PixID | Counts | Sigma | Mean | Median | Sigma |
| A | 13 | 254 | 11740 | 63.49 | 855 | 835 | 171.8 |
| A | 0 | 226 | 7503 | 38.82 | 855 | 835 | 171.8 |
| A | 3 | 137 | 7458 | 38.56 | 855 | 835 | 171.8 |
| B | 5 | 172 | 25026 | 152.45 | 846 | 826 | 158.7 |
| B | 0 | 190 | 21343 | 129.25 | 846 | 826 | 158.7 |
| B | 12 | 111 | 18938 | 114.1 | 846 | 826 | 158.7 |
| C | 0 | 239 | 3936951 | 21207.04 | 799 | 803 | 185.6 |
| C | 14 | 238 | 126848 | 679.1 | 799 | 803 | 185.6 |
| C | 7 | 247 | 26940 | 140.82 | 799 | 803 | 185.6 |
| D | 1 | 52 | 198011 | 974.82 | 835 | 811 | 202.3 |
| D | 2 | 152 | 75378 | 368.61 | 835 | 811 | 202.3 |
| D | 13 | 249 | 72639 | 355.07 | 835 | 811 | 202.3 |
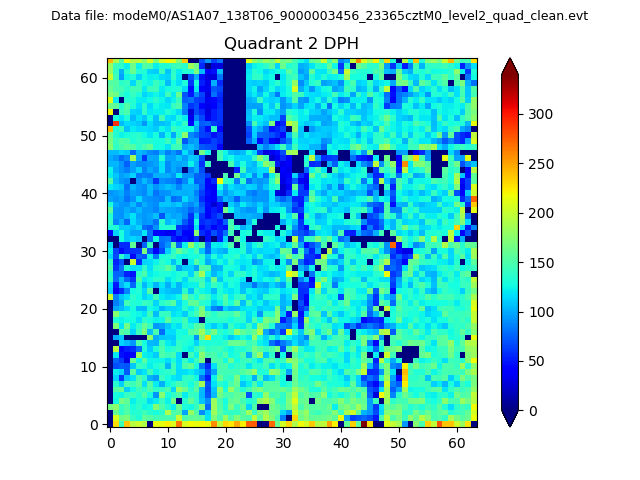
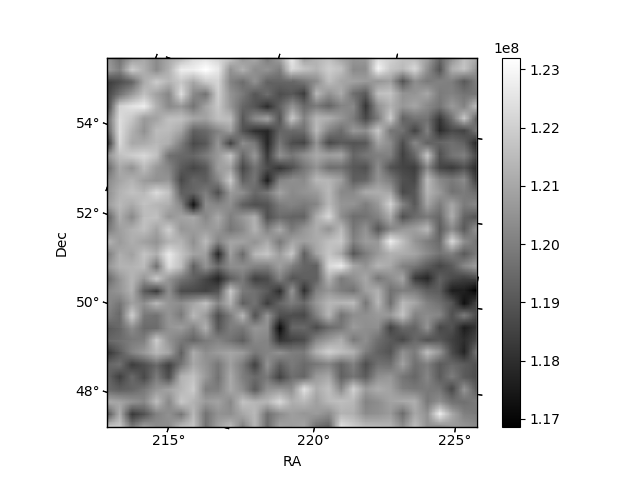
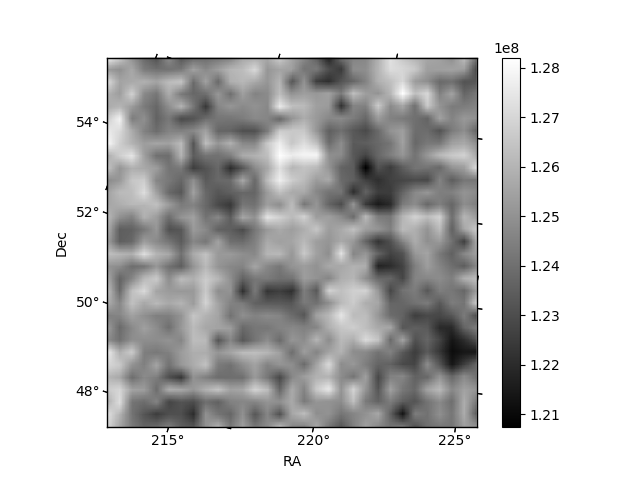
Histogram calculated using DETX and DETY for each event in the final _common_clean file
| Quadrant A |  |
 |
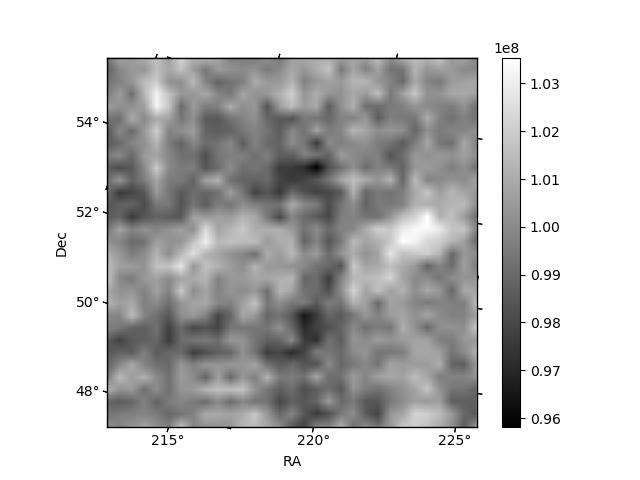
Quadrant B |
|---|---|---|---|
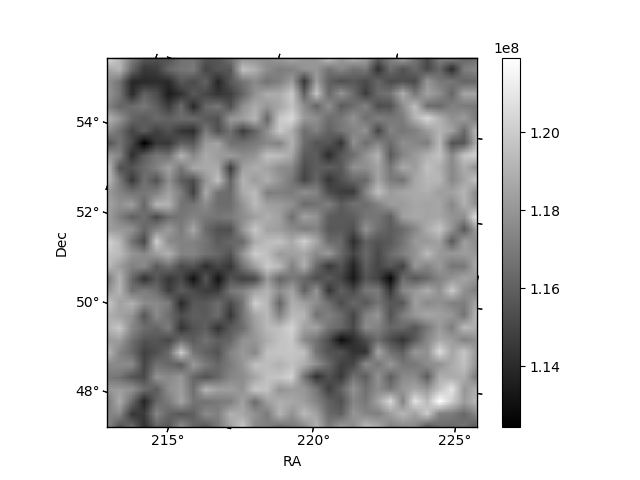
| Quadrant D |  |
 |
Quadrant C |
| Plot type | Count rate plots | Images |
|---|---|---|
| Comparison with Poisson distribution Blue bars denote a histogram of data divided into 1 sec bins. Red curve is a Poisson curve with rate = median count rate of data. |
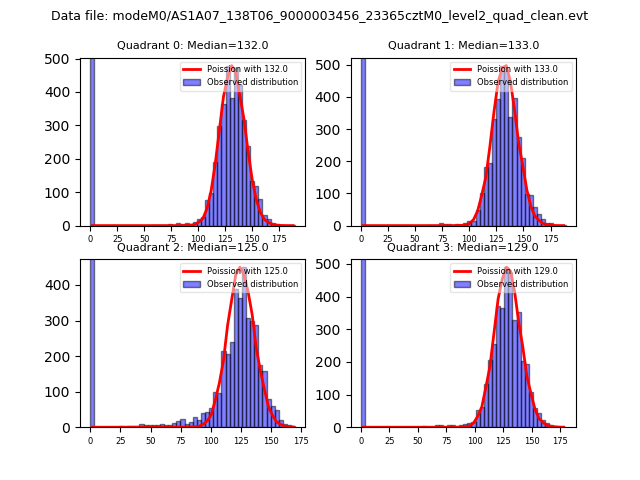 |
 |
| Quadrant-wise count rates Data is divided into 100 sec bins |
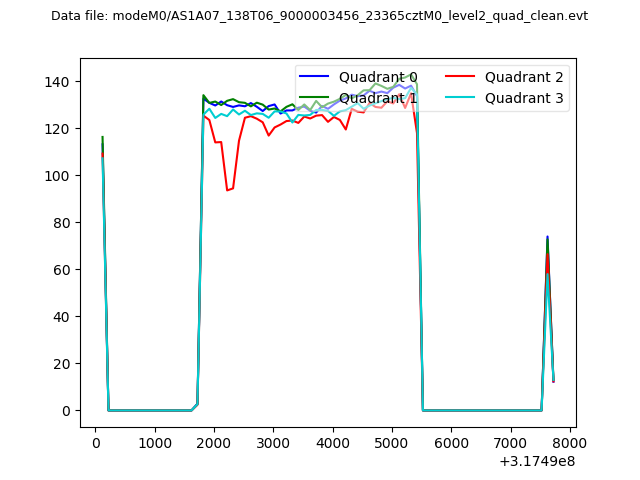 |
|
| Module-wise count rates for Quadrant A Data is divided into 100 sec bins |
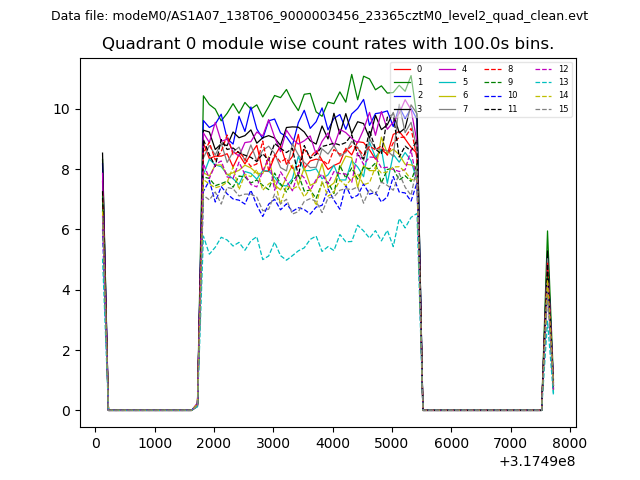 |
 |
| Module-wise count rates for Quadrant B Data is divided into 100 sec bins |
 |
 |
| Module-wise count rates for Quadrant C Data is divided into 100 sec bins |
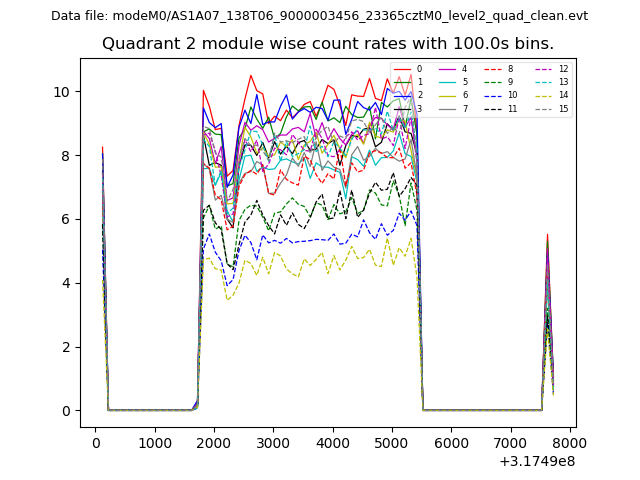 |
 |
| Module-wise count rates for Quadrant D Data is divided into 100 sec bins |
 |
 |
| Parameter | Plot |
|---|---|
| CZT HV Monitor |  |
| D_VDD | 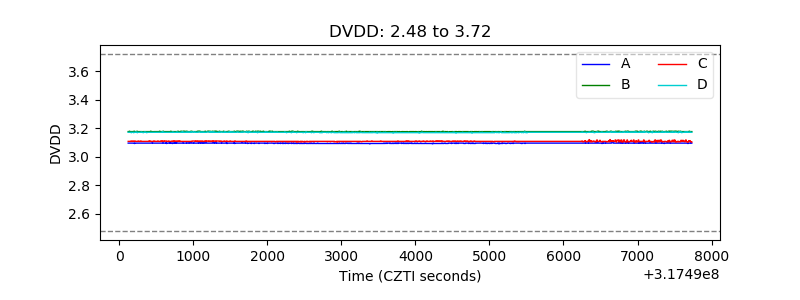 |
| Temperature 1 | 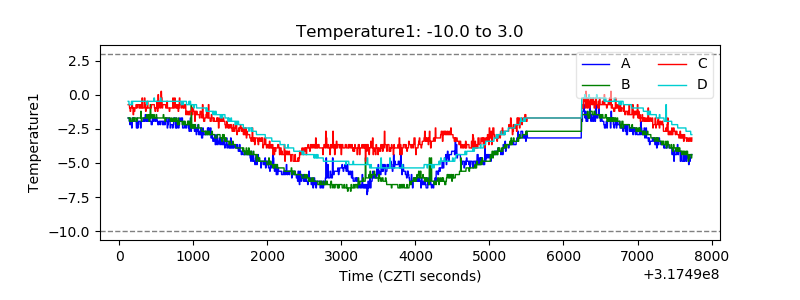 |
| Veto HV Monitor | 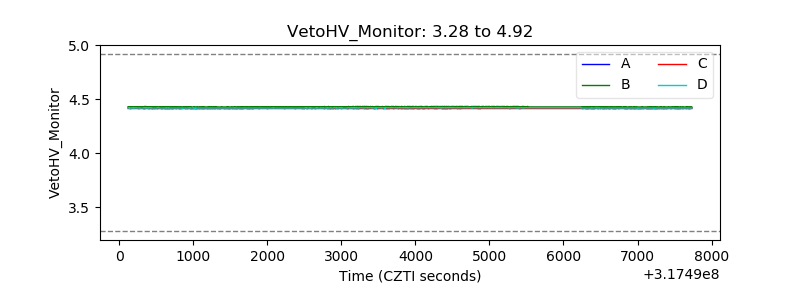 |
| Veto LLD | 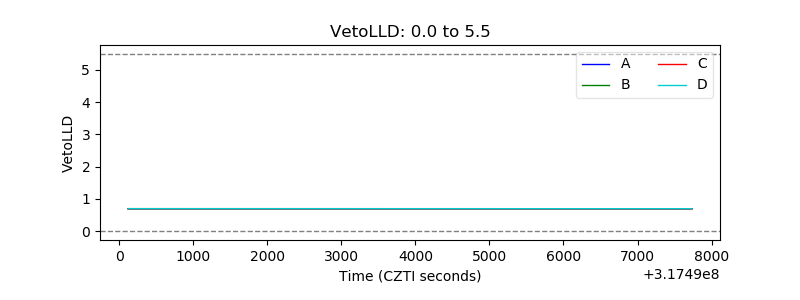 |
| Alpha Counter | 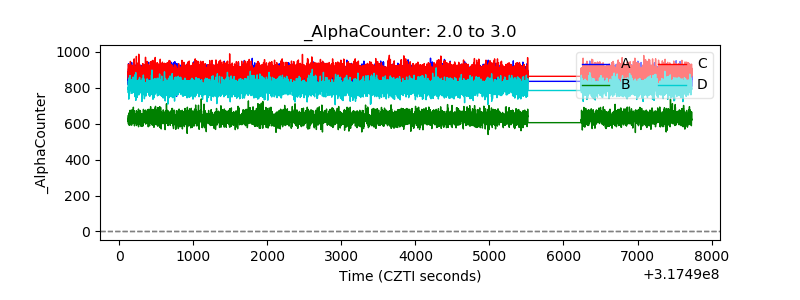 |
| _CPM_Rate | 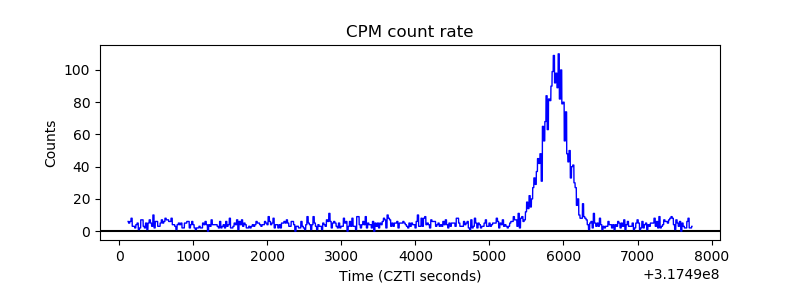 |
| CZT Counter | 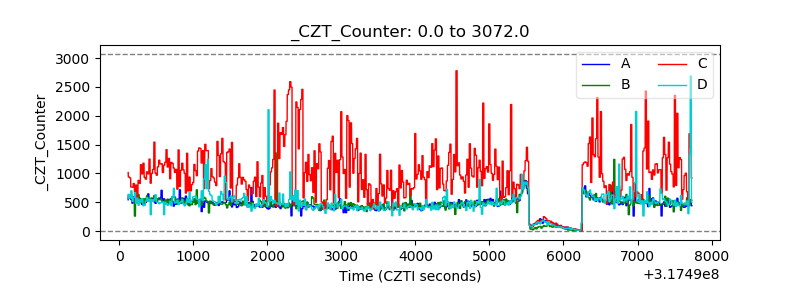 |
| +2.5 Volts monitor |  |
| +5 Volts monitor |  |
| _ROLL_ROT | 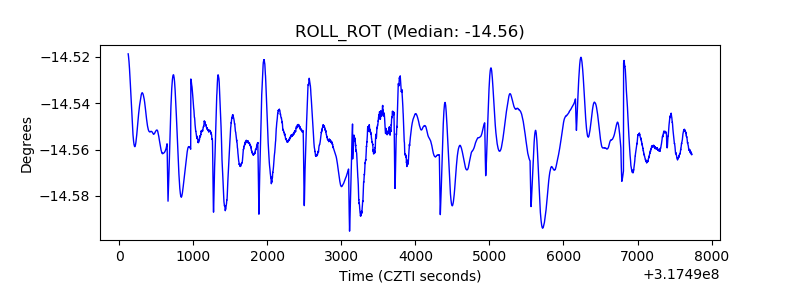 |
| _Roll_DEC | 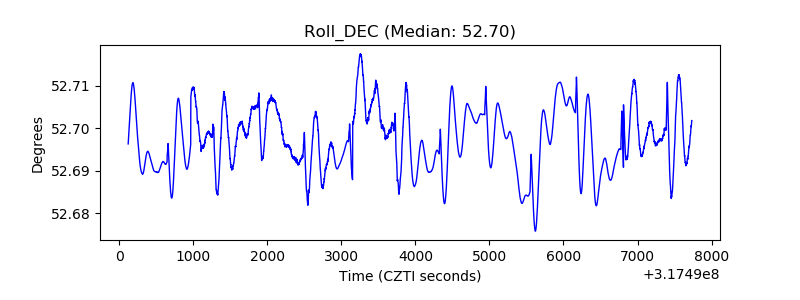 |
| _Roll_RA | 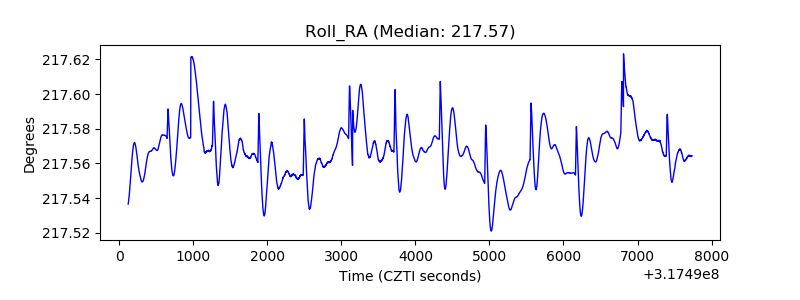 |
| Veto Counter | 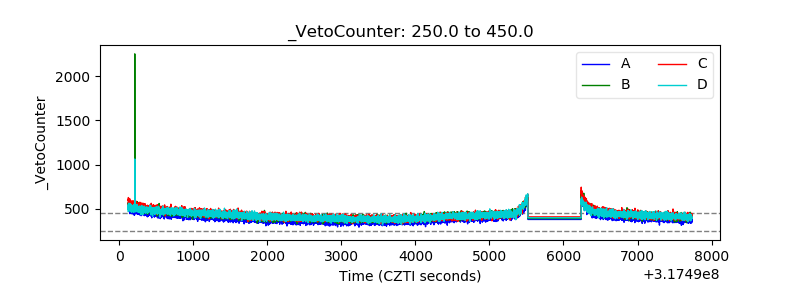 |