| Param | Original file | Final file |
|---|---|---|
| Filename | modeM0/AS1A07_138T06_9000003456_23367cztM0_level2.evt | modeM0/AS1A07_138T06_9000003456_23367cztM0_level2_quad_clean.evt |
| Size (bytes) | 550,324,800 | 97,240,320 |
| Size | 524.8 MB | 92.7 MB |
| Events in quadrant A | 3,309,209 | 623,802 |
| Events in quadrant B | 3,470,669 | 628,867 |
| Events in quadrant C | 5,497,763 | 598,884 |
| Events in quadrant D | 3,906,411 | 597,781 |
| Mode M0 | |||
|---|---|---|---|
| Quadrant | BADHDUFLAG | Total packets | Discarded packets |
| A | 0 | 14523 | 1 |
| B | 0 | 14942 | 1 |
| C | 0 | 21509 | 1 |
| D | 0 | 16464 | 1 |
| Mode M9 | |||
|---|---|---|---|
| Quadrant | BADHDUFLAG | Total packets | Discarded packets |
| A | 0 | 3 | 0 |
| B | 0 | 3 | 0 |
| C | 0 | 3 | 0 |
| D | 0 | 3 | 0 |
| Mode SS | |||
|---|---|---|---|
| Quadrant | BADHDUFLAG | Total packets | Discarded packets |
| A | 0 | 146 | 0 |
| B | 0 | 146 | 0 |
| C | 0 | 146 | 0 |
| D | 0 | 146 | 0 |
| Quadrant | Total seconds | Saturated seconds | Saturation percentage |
|---|---|---|---|
| A | 7109 | 29 | 0.407934% |
| B | 7110 | 74 | 1.040788% |
| C | 7110 | 310 | 4.360056% |
| D | 7110 | 132 | 1.856540% |
Noise dominated data is calculated using 1-second bins in cleaned event files. If a bin has >2000 counts, and if more than 50% of those come from <1% of pixels, then it is considered to be noise-dominated and hence unusable.
| Quadrant | # 1 sec bins | Bins with >0 counts | Bins with >2000 counts | High rate bins dominated by noise | Noise dominated (total time) | Noise dominated (detector-on time) | Marked lightcurve |
|---|---|---|---|---|---|---|---|
| A | 7464 | 7111 | 0 | 0 | 0.00% | 0.00% | 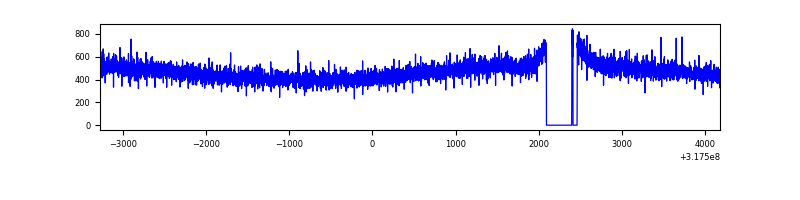 |
| B | 7465 | 7111 | 7 | 7 | 0.09% | 0.10% | 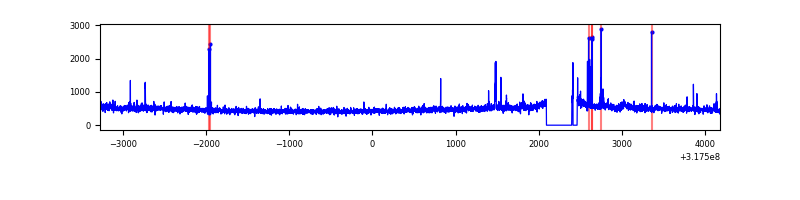 |
| C | 7465 | 7111 | 54 | 54 | 0.72% | 0.76% | 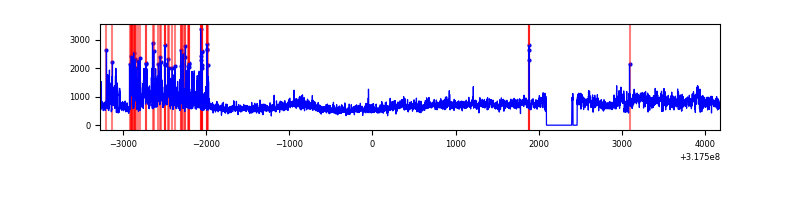 |
| D | 7465 | 7112 | 91 | 91 | 1.22% | 1.28% | 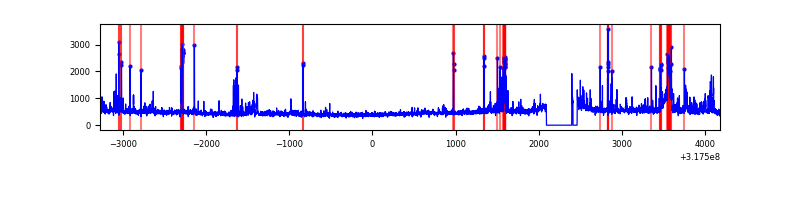 |
Top three noisy pixels from each quadrant. If the there are fewer than three noisy pixels in the level2.evt file, extra rows are filled as -1
| Pixel properties | Quadrant properties | ||||||
|---|---|---|---|---|---|---|---|
| Quadrant | DetID | PixID | Counts | Sigma | Mean | Median | Sigma |
| A | 13 | 254 | 11428 | 60.72 | 858 | 837 | 174.4 |
| A | 3 | 137 | 7631 | 38.95 | 858 | 837 | 174.4 |
| A | 0 | 226 | 7346 | 37.32 | 858 | 837 | 174.4 |
| B | 0 | 189 | 87652 | 539.2 | 849 | 831 | 161.0 |
| B | 12 | 111 | 19430 | 115.51 | 849 | 831 | 161.0 |
| B | 11 | 111 | 17134 | 101.25 | 849 | 831 | 161.0 |
| C | 0 | 239 | 2091719 | 11077.07 | 817 | 821 | 188.8 |
| C | 14 | 238 | 131600 | 692.83 | 817 | 821 | 188.8 |
| C | 7 | 247 | 45262 | 235.44 | 817 | 821 | 188.8 |
| D | 1 | 52 | 208696 | 1032.12 | 834 | 811 | 201.4 |
| D | 7 | 38 | 126195 | 622.52 | 834 | 811 | 201.4 |
| D | 2 | 152 | 124166 | 612.44 | 834 | 811 | 201.4 |
Histogram calculated using DETX and DETY for each event in the final _common_clean file
| Quadrant A | 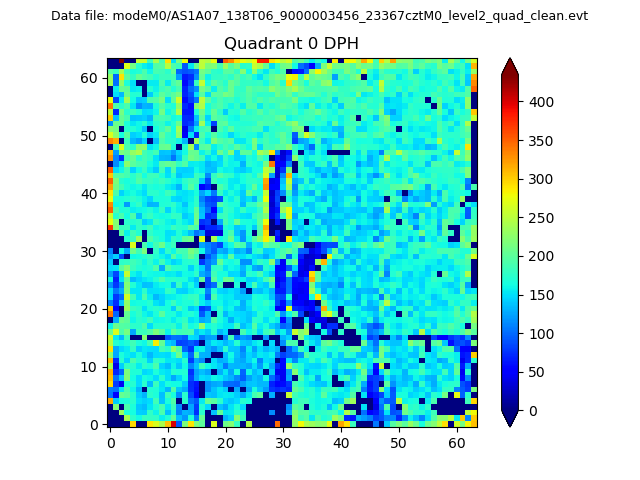 |
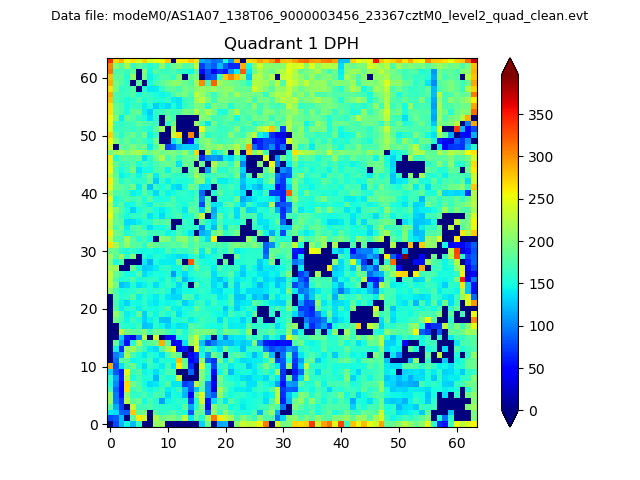 |
Quadrant B |
|---|---|---|---|
| Quadrant D |  |
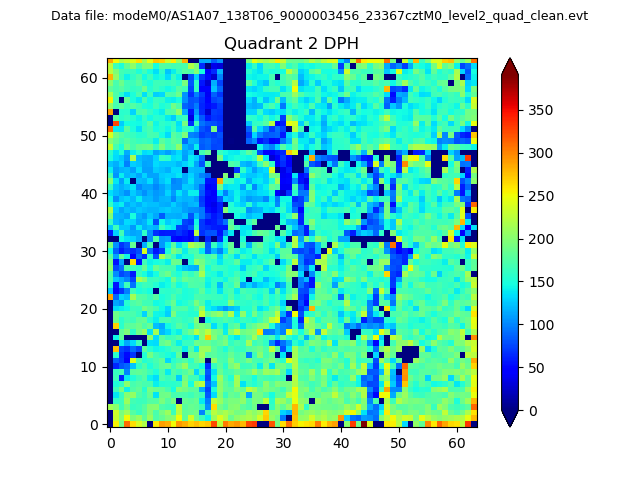 |
Quadrant C |
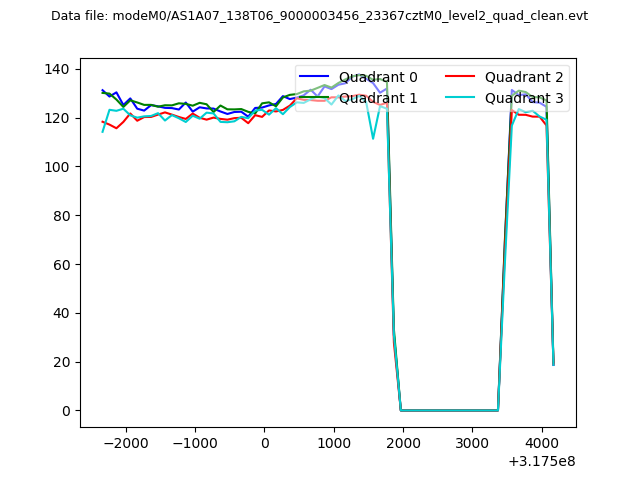
| Plot type | Count rate plots | Images |
|---|---|---|
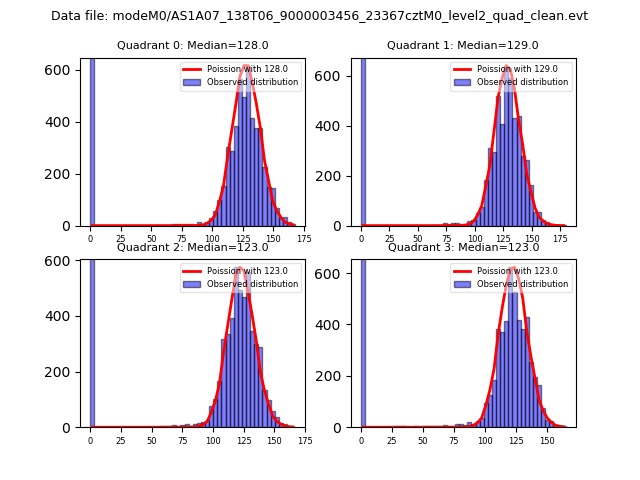
| Comparison with Poisson distribution Blue bars denote a histogram of data divided into 1 sec bins. Red curve is a Poisson curve with rate = median count rate of data. |
 |
 |
| Quadrant-wise count rates Data is divided into 100 sec bins |
 |
|
| Module-wise count rates for Quadrant A Data is divided into 100 sec bins |
 |
 |
| Module-wise count rates for Quadrant B Data is divided into 100 sec bins |
 |
 |
| Module-wise count rates for Quadrant C Data is divided into 100 sec bins |
 |
 |
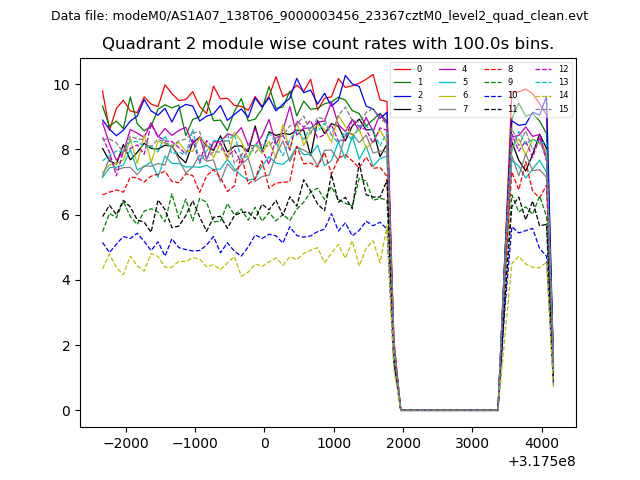
| Module-wise count rates for Quadrant D Data is divided into 100 sec bins |
 |
 |
| Parameter | Plot |
|---|---|
| CZT HV Monitor |  |
| D_VDD | 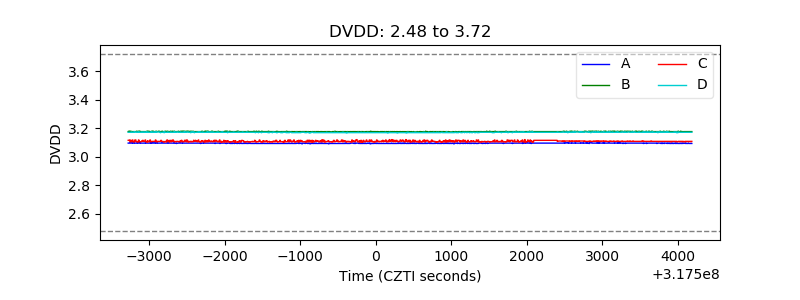 |
| Temperature 1 | 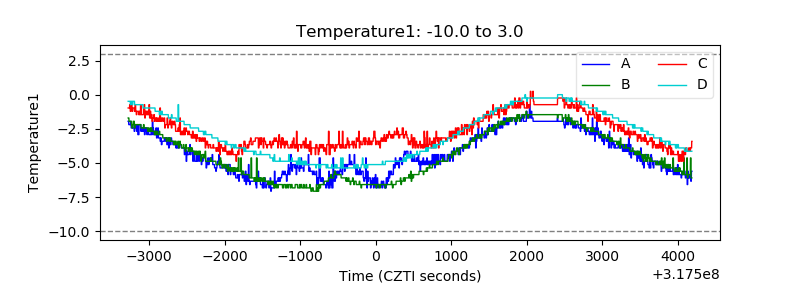 |
| Veto HV Monitor | 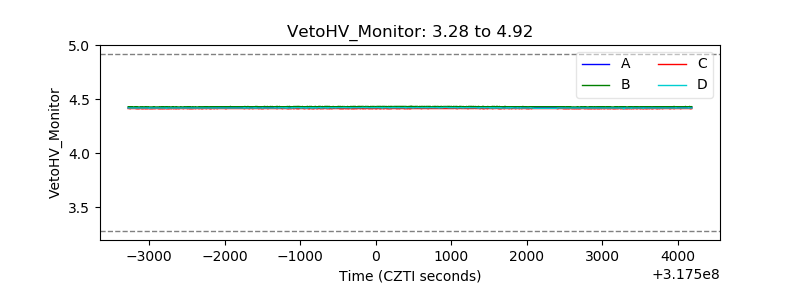 |
| Veto LLD | 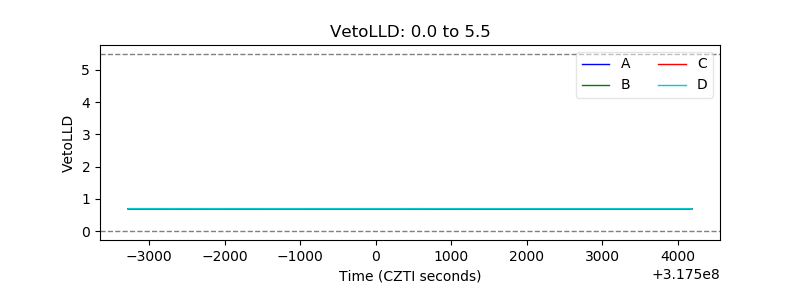 |
| Alpha Counter | 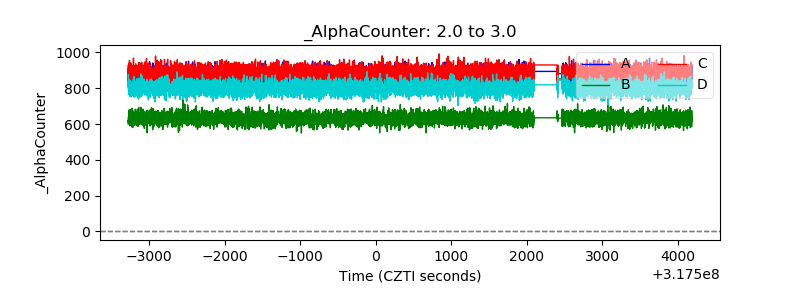 |
| _CPM_Rate | 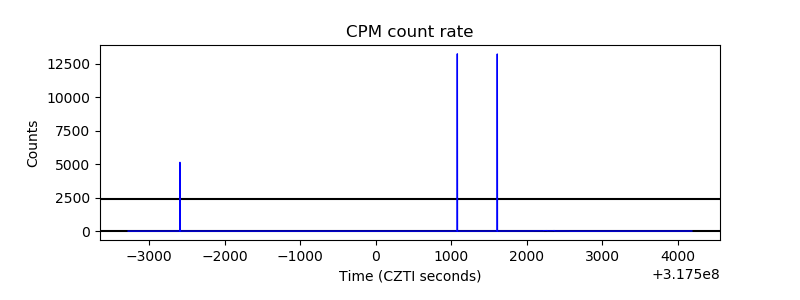 |
| CZT Counter | 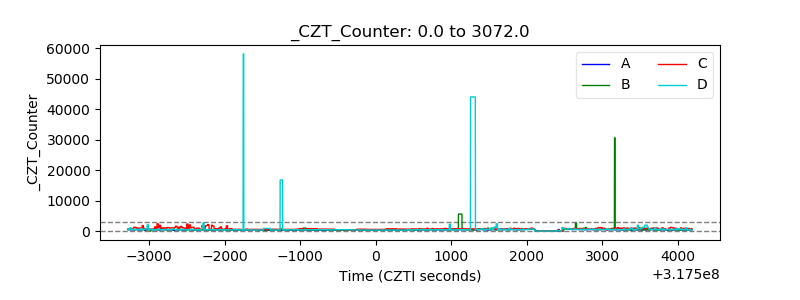 |
| +2.5 Volts monitor |  |
| +5 Volts monitor | 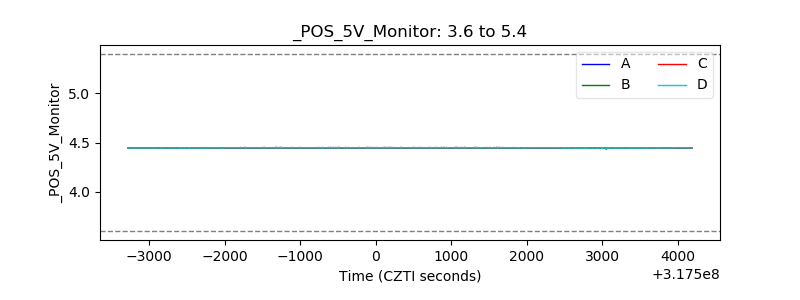 |
| _ROLL_ROT |  |
| _Roll_DEC | 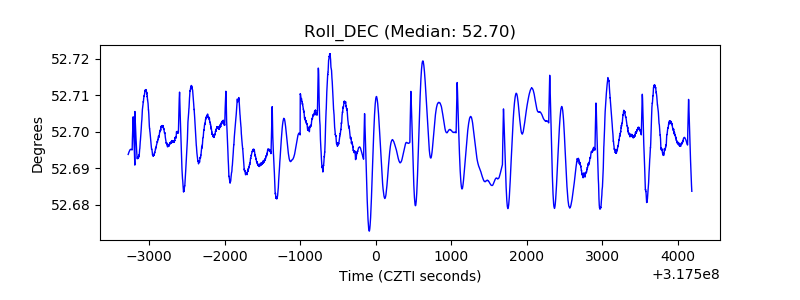 |
| _Roll_RA | 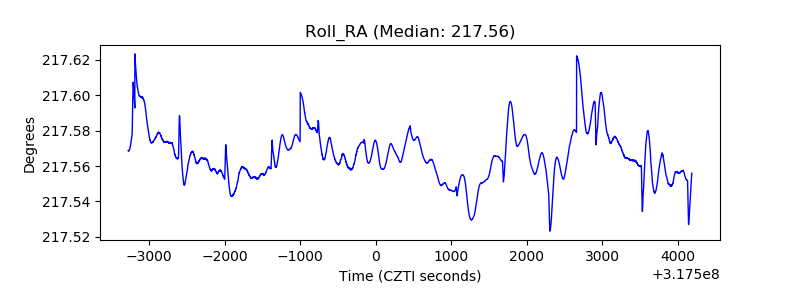 |
| Veto Counter | 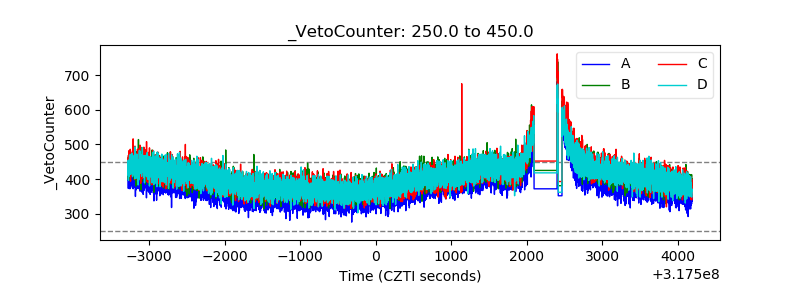 |