| Param | Original file | Final file |
|---|---|---|
| Filename | modeM0/AS1A07_138T09_9000003458cztM0_level2.fits | modeM0/AS1A07_138T09_9000003458cztM0_level2_quad_clean.evt |
| Size (bytes) | 333,195,840 | 358,050,240 |
| Size | 317.8 MB | 341.5 MB |
| Events in quadrant A | 2,037,190 | 2,198,651 |
| Events in quadrant B | 1,953,080 | 2,206,848 |
| Events in quadrant C | 1,955,992 | 2,084,205 |
| Events in quadrant D | 1,737,679 | 1,947,343 |
| Mode SS | |||
|---|---|---|---|
| Quadrant | BADHDUFLAG | Total packets | Discarded packets |
| A | 0 | 710 | 0 |
| B | 0 | 712 | 0 |
| C | 0 | 708 | 0 |
| D | 0 | 712 | 0 |
| Mode M9 | |||
|---|---|---|---|
| Quadrant | BADHDUFLAG | Total packets | Discarded packets |
| A | 0 | 55 | 0 |
| B | 0 | 55 | 0 |
| C | 0 | 55 | 0 |
| D | 0 | 55 | 0 |
| Mode M0 | |||
|---|---|---|---|
| Quadrant | BADHDUFLAG | Total packets | Discarded packets |
| A | 0 | 71702 | 0 |
| B | 0 | 74143 | 0 |
| C | 0 | 88830 | 0 |
| D | 0 | 82733 | 0 |
| Quadrant | Total seconds | Saturated seconds | Saturation percentage |
|---|---|---|---|
| A | 35041 | 185 | 0.527953% |
| B | 35049 | 311 | 0.887329% |
| C | 35055 | 1134 | 3.234917% |
| D | 35056 | 660 | 1.882702% |
Noise dominated data is calculated using 1-second bins in cleaned event files. If a bin has >2000 counts, and if more than 50% of those come from <1% of pixels, then it is considered to be noise-dominated and hence unusable.
| Quadrant | # 1 sec bins | Bins with >0 counts | Bins with >2000 counts | High rate bins dominated by noise | Noise dominated (total time) | Noise dominated (detector-on time) | Marked lightcurve |
|---|---|---|---|---|---|---|---|
| A | 37072 | 33642 | 0 | 0 | 0.00% | 0.00% |  |
| B | 37071 | 33647 | 0 | 0 | 0.00% | 0.00% |  |
| C | 37071 | 33650 | 0 | 0 | 0.00% | 0.00% |  |
| D | 37071 | 33646 | 0 | 0 | 0.00% | 0.00% |  |
Top three noisy pixels from each quadrant. If the there are fewer than three noisy pixels in the level2.evt file, extra rows are filled as -1
| Pixel properties | Quadrant properties | ||||||
|---|---|---|---|---|---|---|---|
| Quadrant | DetID | PixID | Counts | Sigma | Mean | Median | Sigma |
| A | 0 | 29 | 1954 | 10.95 | 530 | 497 | 133.0 |
| A | 7 | 110 | 1666 | 8.79 | 530 | 497 | 133.0 |
| A | 0 | 30 | 1519 | 7.68 | 530 | 497 | 133.0 |
| B | 2 | 9 | 1553 | 10.28 | 515 | 491 | 103.3 |
| B | 2 | 8 | 1338 | 8.2 | 515 | 491 | 103.3 |
| B | 3 | 17 | 1320 | 8.02 | 515 | 491 | 103.3 |
| C | 3 | 126 | 1378 | 6.77 | 517 | 483 | 132.1 |
| C | 12 | 241 | 1358 | 6.62 | 517 | 483 | 132.1 |
| C | 9 | 209 | 1288 | 6.09 | 517 | 483 | 132.1 |
| D | 3 | 14 | 1222 | 5.72 | 496 | 452 | 134.7 |
| D | 15 | 46 | 1217 | 5.68 | 496 | 452 | 134.7 |
| D | 10 | 189 | 1216 | 5.67 | 496 | 452 | 134.7 |
Histogram calculated using DETX and DETY for each event in the final _common_clean file
| Quadrant A | 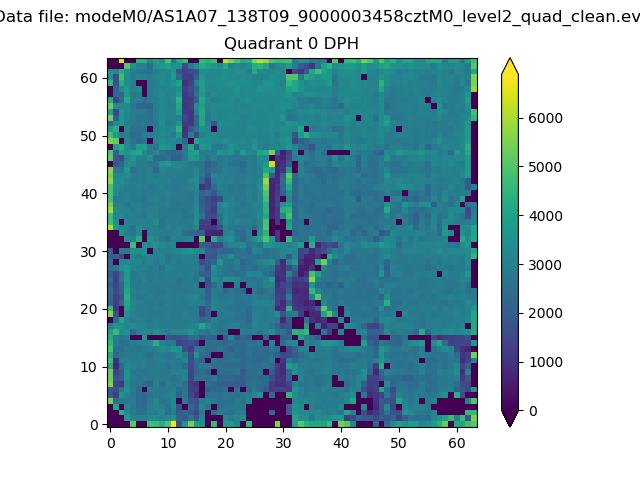 |
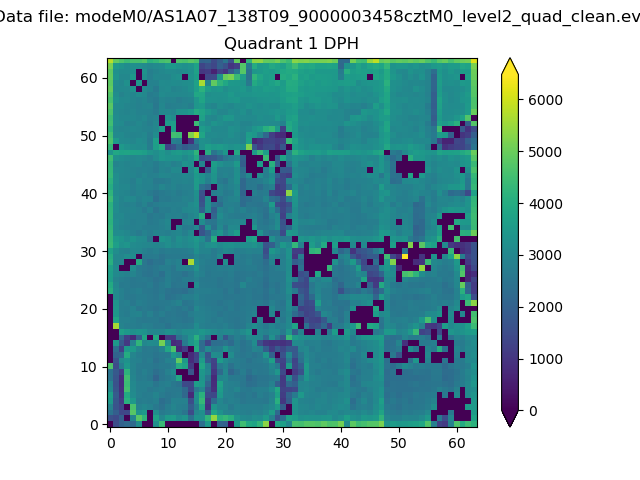 |
Quadrant B |
|---|---|---|---|
| Quadrant D | 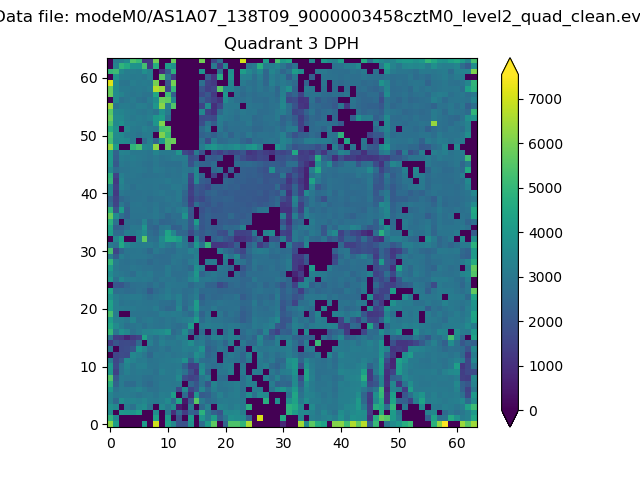 |
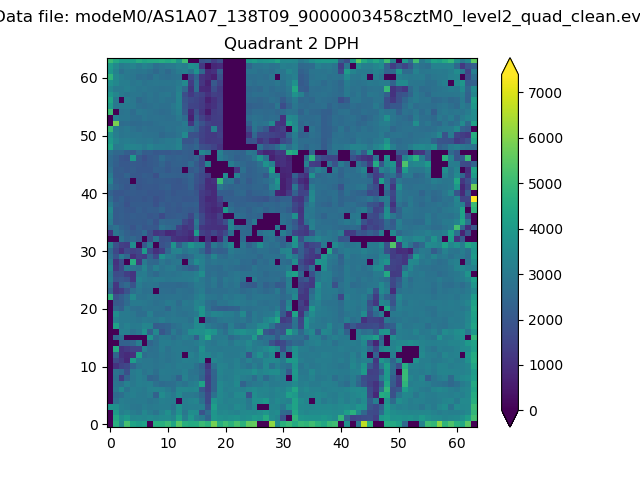 |
Quadrant C |
| Plot type | Count rate plots | Images |
|---|---|---|
| Comparison with Poisson distribution Blue bars denote a histogram of data divided into 1 sec bins. Red curve is a Poisson curve with rate = median count rate of data. |
 |
 |
| Quadrant-wise count rates Data is divided into 100 sec bins |
 |
|
| Module-wise count rates for Quadrant A Data is divided into 100 sec bins |
 |
 |
| Module-wise count rates for Quadrant B Data is divided into 100 sec bins |
 |
 |
| Module-wise count rates for Quadrant C Data is divided into 100 sec bins |
 |
 |
| Module-wise count rates for Quadrant D Data is divided into 100 sec bins |
 |
 |
| Parameter | Plot |
|---|---|
| CZT HV Monitor |  |
| D_VDD |  |
| Temperature 1 |  |
| Veto HV Monitor |  |
| Veto LLD |  |
| Alpha Counter |  |
| _CPM_Rate |  |
| CZT Counter |  |
| +2.5 Volts monitor |  |
| +5 Volts monitor |  |
| _ROLL_ROT |  |
| _Roll_DEC |  |
| _Roll_RA |  |
| Veto Counter |  |