| Param | Original file | Final file |
|---|---|---|
| Filename | modeM0/AS1A07_138T09_9000003458_23368cztM0_level2.evt | modeM0/AS1A07_138T09_9000003458_23368cztM0_level2_quad_clean.evt |
| Size (bytes) | 639,866,880 | 92,390,400 |
| Size | 610.2 MB | 88.1 MB |
| Events in quadrant A | 3,446,589 | 582,066 |
| Events in quadrant B | 3,681,776 | 586,459 |
| Events in quadrant C | 6,728,516 | 552,295 |
| Events in quadrant D | 5,020,615 | 561,927 |
| Mode SS | |||
|---|---|---|---|
| Quadrant | BADHDUFLAG | Total packets | Discarded packets |
| A | 0 | 148 | 0 |
| B | 0 | 148 | 0 |
| C | 0 | 148 | 0 |
| D | 0 | 148 | 0 |
| Mode M9 | |||
|---|---|---|---|
| Quadrant | BADHDUFLAG | Total packets | Discarded packets |
| A | 0 | 5 | 0 |
| B | 0 | 5 | 0 |
| C | 0 | 5 | 0 |
| D | 0 | 5 | 0 |
| Mode M0 | |||
|---|---|---|---|
| Quadrant | BADHDUFLAG | Total packets | Discarded packets |
| A | 0 | 15155 | 1 |
| B | 0 | 15827 | 1 |
| C | 0 | 24967 | 1 |
| D | 0 | 20091 | 1 |
| Quadrant | Total seconds | Saturated seconds | Saturation percentage |
|---|---|---|---|
| A | 7407 | 36 | 0.486027% |
| B | 7407 | 72 | 0.972053% |
| C | 7408 | 684 | 9.233261% |
| D | 7408 | 247 | 3.334233% |
Noise dominated data is calculated using 1-second bins in cleaned event files. If a bin has >2000 counts, and if more than 50% of those come from <1% of pixels, then it is considered to be noise-dominated and hence unusable.
| Quadrant | # 1 sec bins | Bins with >0 counts | Bins with >2000 counts | High rate bins dominated by noise | Noise dominated (total time) | Noise dominated (detector-on time) | Marked lightcurve |
|---|---|---|---|---|---|---|---|
| A | 7822 | 7408 | 0 | 0 | 0.00% | 0.00% | 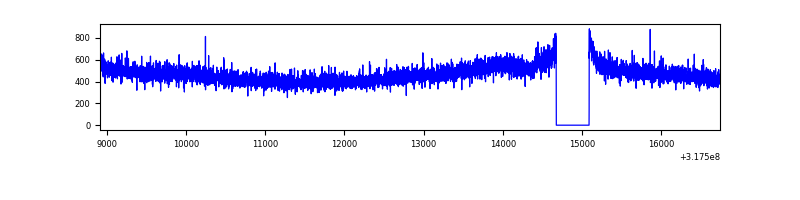 |
| B | 7822 | 7408 | 8 | 8 | 0.10% | 0.11% | 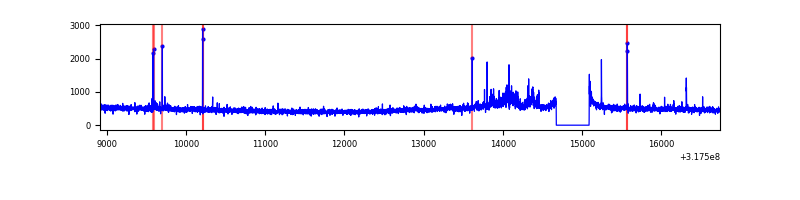 |
| C | 7823 | 7409 | 276 | 276 | 3.53% | 3.73% | 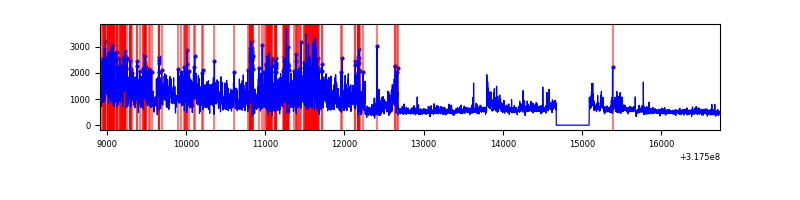 |
| D | 7823 | 7409 | 153 | 153 | 1.96% | 2.07% | 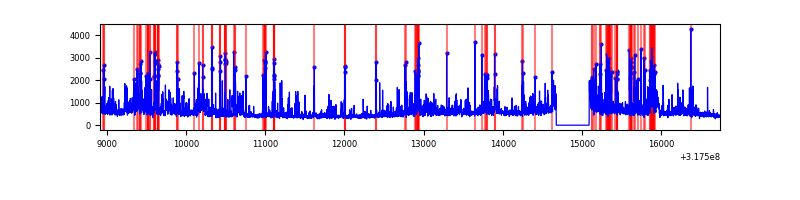 |
Top three noisy pixels from each quadrant. If the there are fewer than three noisy pixels in the level2.evt file, extra rows are filled as -1
| Pixel properties | Quadrant properties | ||||||
|---|---|---|---|---|---|---|---|
| Quadrant | DetID | PixID | Counts | Sigma | Mean | Median | Sigma |
| A | 8 | 205 | 14579 | 76.2 | 890 | 871 | 179.9 |
| A | 13 | 254 | 10871 | 55.59 | 890 | 871 | 179.9 |
| A | 3 | 137 | 8202 | 40.75 | 890 | 871 | 179.9 |
| B | 0 | 189 | 131977 | 774.16 | 884 | 862 | 169.4 |
| B | 0 | 190 | 38750 | 223.71 | 884 | 862 | 169.4 |
| B | 6 | 36 | 21201 | 120.09 | 884 | 862 | 169.4 |
| C | 0 | 239 | 3232976 | 16326.24 | 842 | 845 | 198.0 |
| C | 14 | 238 | 133429 | 669.71 | 842 | 845 | 198.0 |
| C | 7 | 247 | 45251 | 224.3 | 842 | 845 | 198.0 |
| D | 1 | 52 | 755631 | 3604.05 | 863 | 838 | 209.4 |
| D | 7 | 238 | 710344 | 3387.81 | 863 | 838 | 209.4 |
| D | 13 | 104 | 199956 | 950.77 | 863 | 838 | 209.4 |
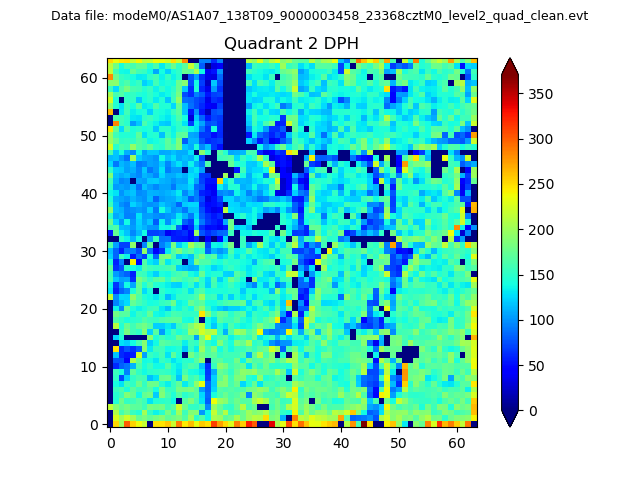
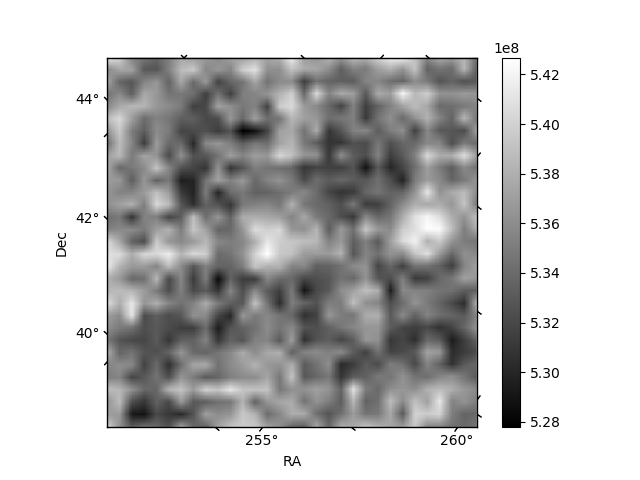
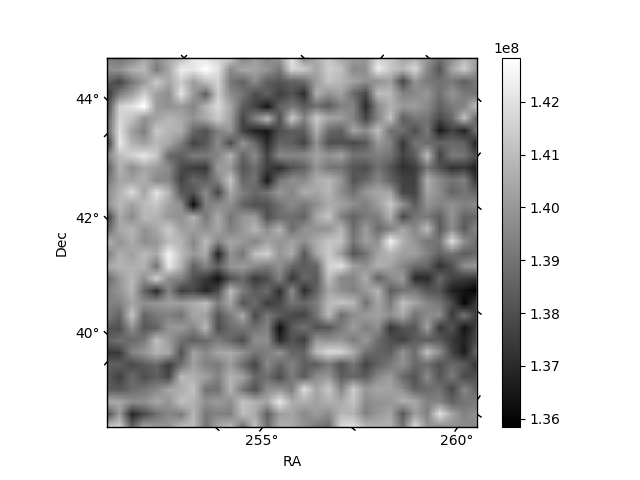
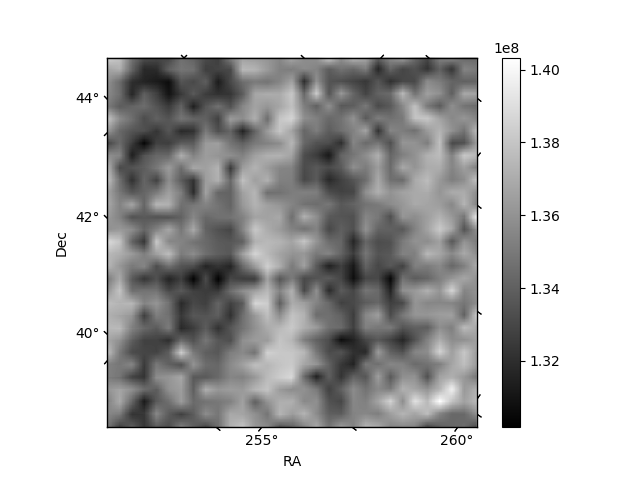
Histogram calculated using DETX and DETY for each event in the final _common_clean file
| Quadrant A | 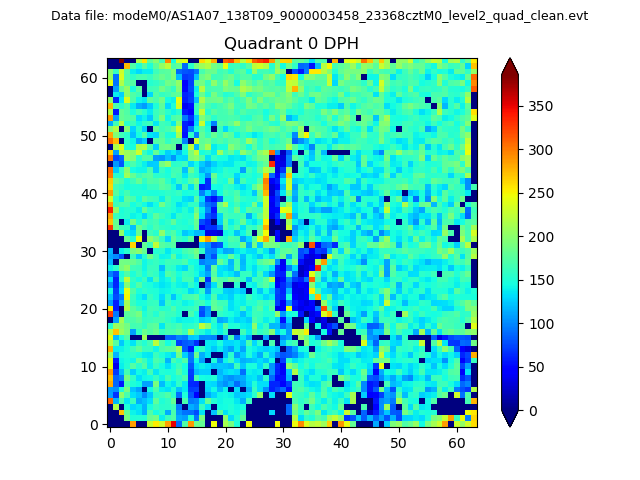 |
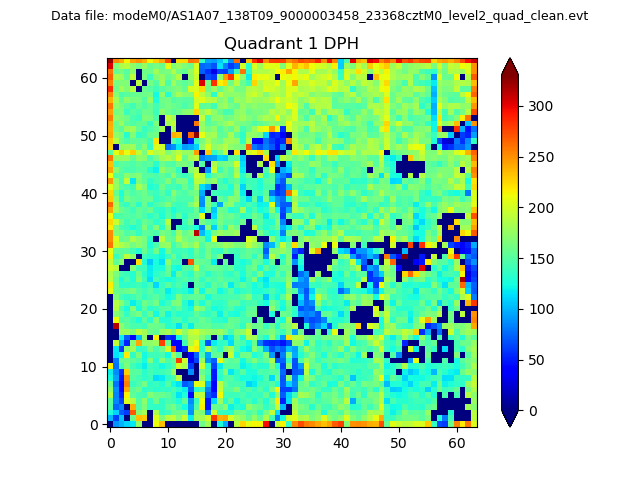 |
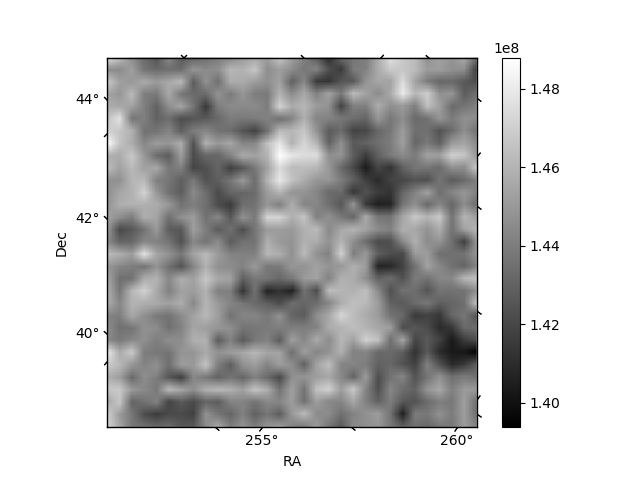
Quadrant B |
|---|---|---|---|
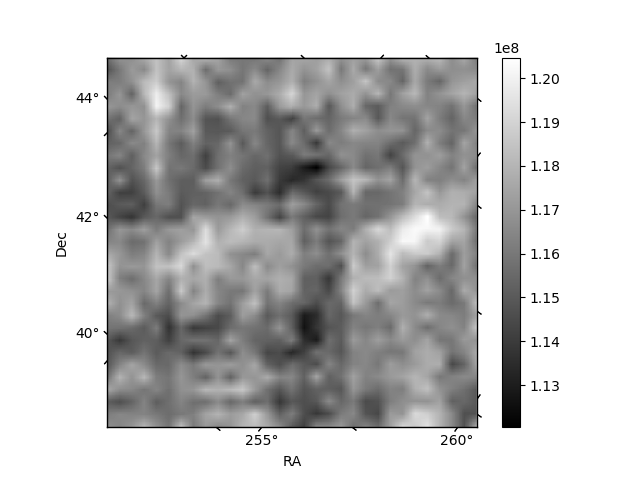
| Quadrant D | 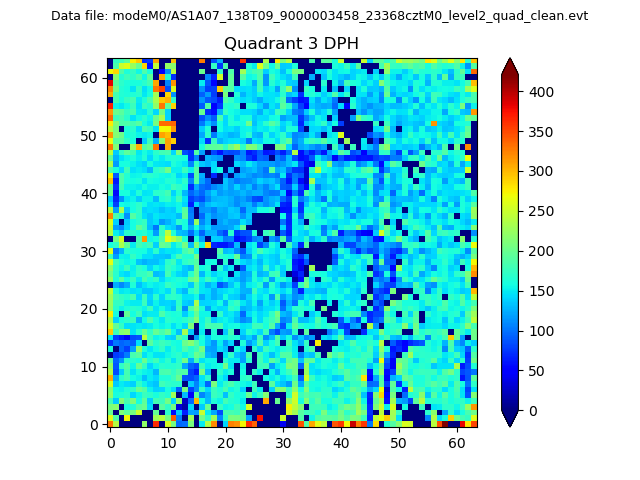 |
 |
Quadrant C |
| Plot type | Count rate plots | Images |
|---|---|---|
| Comparison with Poisson distribution Blue bars denote a histogram of data divided into 1 sec bins. Red curve is a Poisson curve with rate = median count rate of data. |
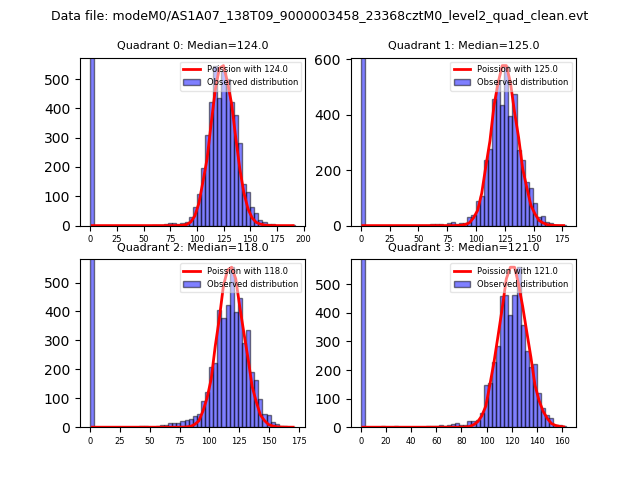 |
 |
| Quadrant-wise count rates Data is divided into 100 sec bins |
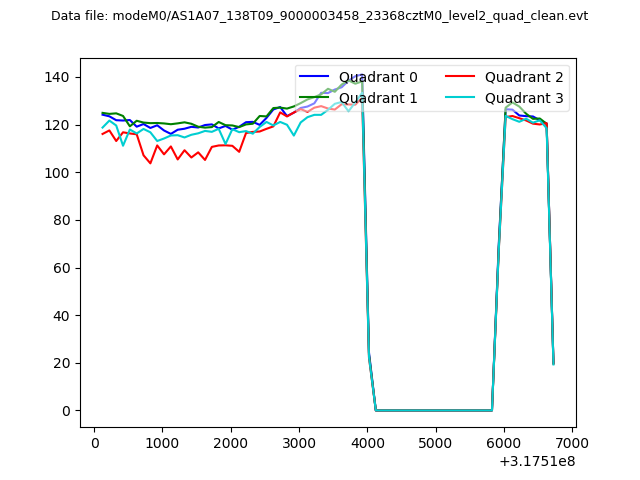 |
|
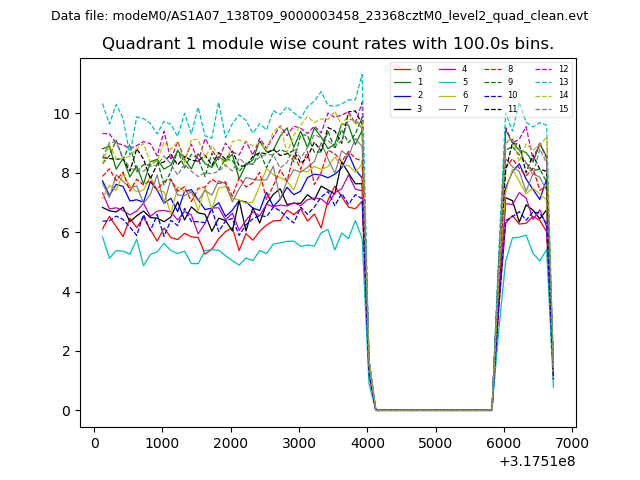
| Module-wise count rates for Quadrant A Data is divided into 100 sec bins |
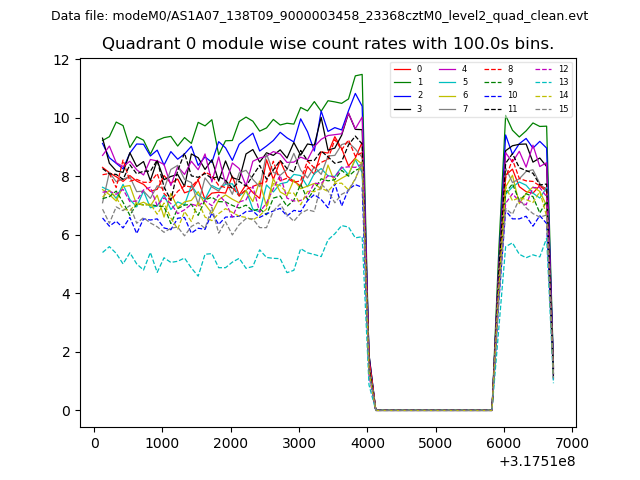 |
 |
| Module-wise count rates for Quadrant B Data is divided into 100 sec bins |
 |
 |
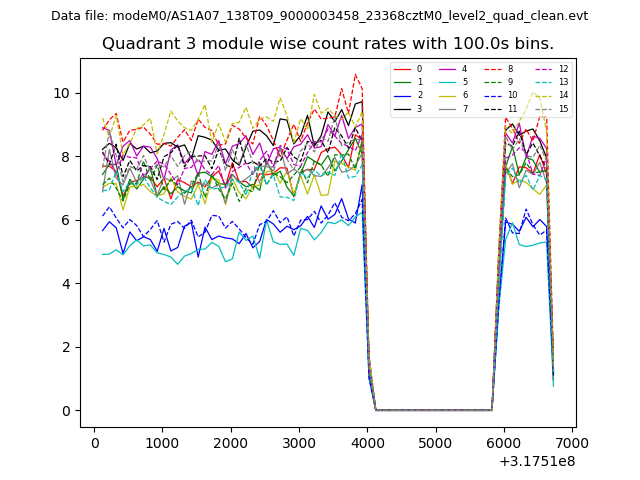
| Module-wise count rates for Quadrant C Data is divided into 100 sec bins |
 |
 |
| Module-wise count rates for Quadrant D Data is divided into 100 sec bins |
 |
 |
| Parameter | Plot |
|---|---|
| CZT HV Monitor | 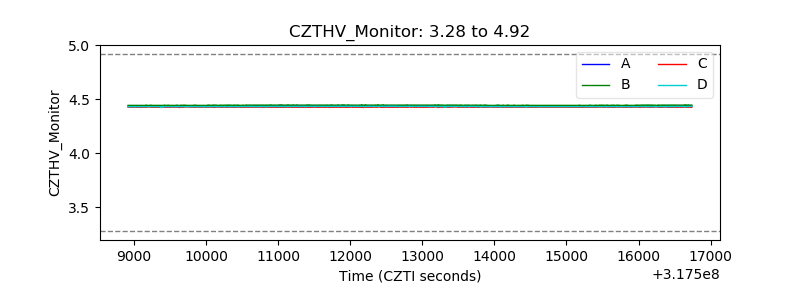 |
| D_VDD |  |
| Temperature 1 | 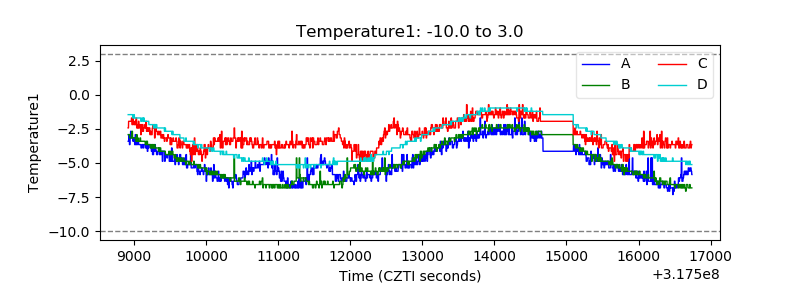 |
| Veto HV Monitor | 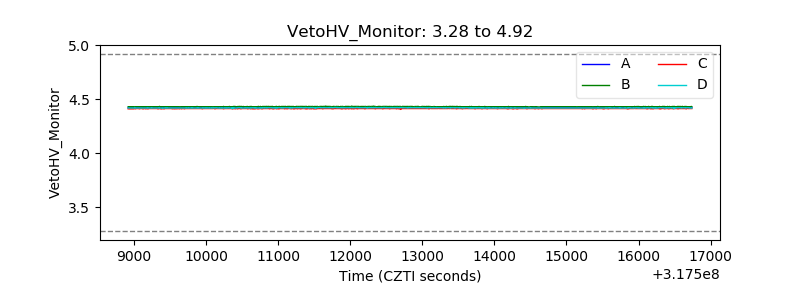 |
| Veto LLD |  |
| Alpha Counter | 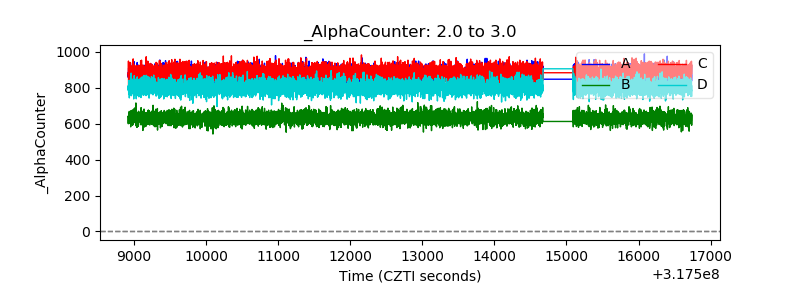 |
| _CPM_Rate | 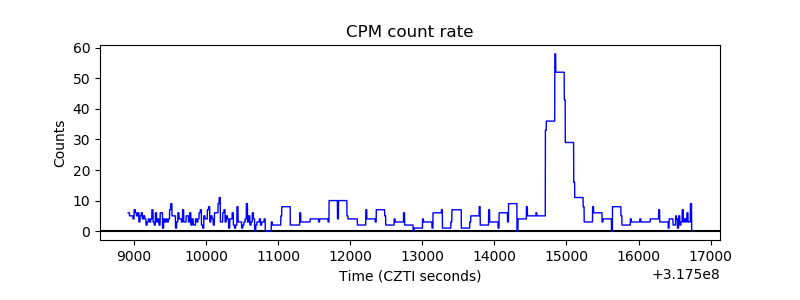 |
| CZT Counter | 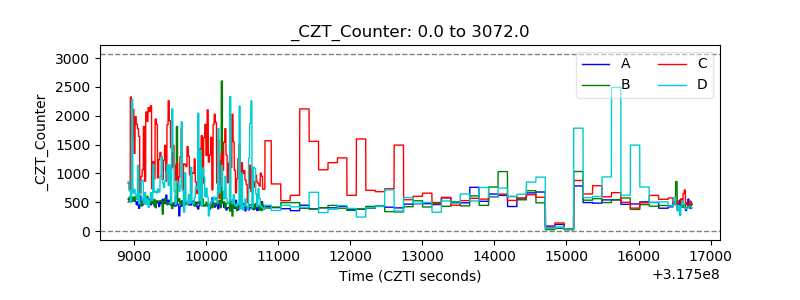 |
| +2.5 Volts monitor |  |
| +5 Volts monitor |  |
| _ROLL_ROT | 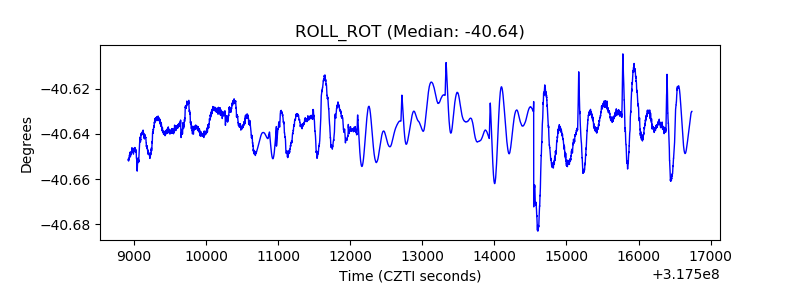 |
| _Roll_DEC | 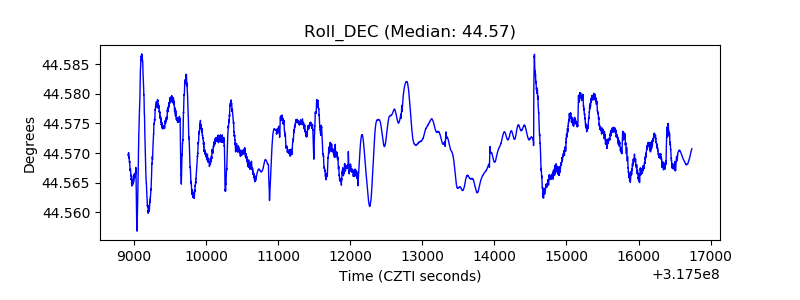 |
| _Roll_RA | 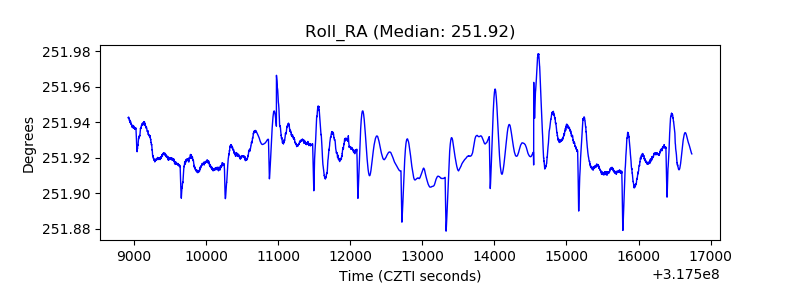 |
| Veto Counter | 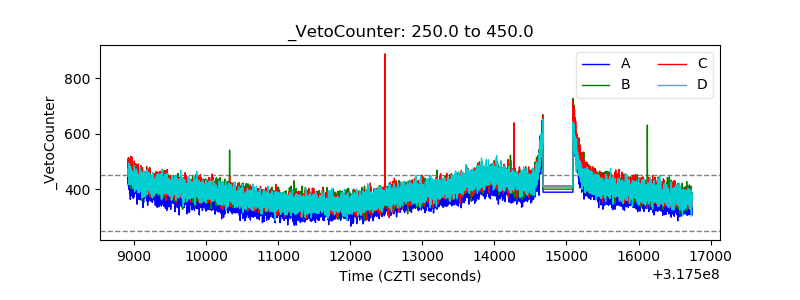 |