| Param | Original file | Final file |
|---|---|---|
| Filename | modeM0/AS1A07_138T09_9000003458_23370cztM0_level2.evt | modeM0/AS1A07_138T09_9000003458_23370cztM0_level2_quad_clean.evt |
| Size (bytes) | 871,750,080 | 178,329,600 |
| Size | 831.4 MB | 170.1 MB |
| Events in quadrant A | 5,704,437 | 1,150,207 |
| Events in quadrant B | 5,918,153 | 1,165,714 |
| Events in quadrant C | 6,777,640 | 1,122,951 |
| Events in quadrant D | 7,154,089 | 1,097,739 |
| Mode SS | |||
|---|---|---|---|
| Quadrant | BADHDUFLAG | Total packets | Discarded packets |
| A | 0 | 254 | 0 |
| B | 0 | 254 | 0 |
| C | 0 | 254 | 0 |
| D | 0 | 254 | 0 |
| Mode M9 | |||
|---|---|---|---|
| Quadrant | BADHDUFLAG | Total packets | Discarded packets |
| A | 0 | 14 | 0 |
| B | 0 | 14 | 0 |
| C | 0 | 14 | 0 |
| D | 0 | 14 | 0 |
| Mode M0 | |||
|---|---|---|---|
| Quadrant | BADHDUFLAG | Total packets | Discarded packets |
| A | 0 | 25409 | 2 |
| B | 0 | 25868 | 2 |
| C | 0 | 28115 | 2 |
| D | 0 | 29848 | 2 |
| Quadrant | Total seconds | Saturated seconds | Saturation percentage |
|---|---|---|---|
| A | 12507 | 25 | 0.199888% |
| B | 12508 | 69 | 0.551647% |
| C | 12508 | 167 | 1.335146% |
| D | 12508 | 296 | 2.366485% |
Noise dominated data is calculated using 1-second bins in cleaned event files. If a bin has >2000 counts, and if more than 50% of those come from <1% of pixels, then it is considered to be noise-dominated and hence unusable.
| Quadrant | # 1 sec bins | Bins with >0 counts | Bins with >2000 counts | High rate bins dominated by noise | Noise dominated (total time) | Noise dominated (detector-on time) | Marked lightcurve |
|---|---|---|---|---|---|---|---|
| A | 13897 | 12509 | 0 | 0 | 0.00% | 0.00% |  |
| B | 13898 | 12510 | 6 | 6 | 0.04% | 0.05% | 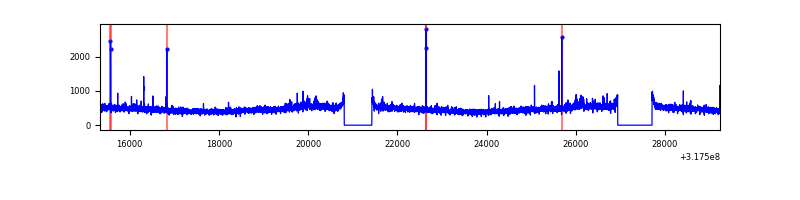 |
| C | 13898 | 12510 | 20 | 20 | 0.14% | 0.16% | 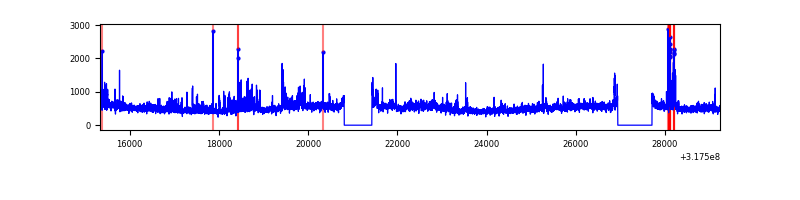 |
| D | 13898 | 12510 | 252 | 252 | 1.81% | 2.01% | 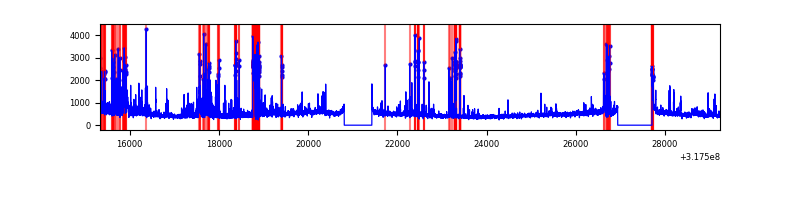 |
Top three noisy pixels from each quadrant. If the there are fewer than three noisy pixels in the level2.evt file, extra rows are filled as -1
| Pixel properties | Quadrant properties | ||||||
|---|---|---|---|---|---|---|---|
| Quadrant | DetID | PixID | Counts | Sigma | Mean | Median | Sigma |
| A | 13 | 254 | 17582 | 54.35 | 1479 | 1448 | 296.9 |
| A | 3 | 137 | 13257 | 39.78 | 1479 | 1448 | 296.9 |
| A | 0 | 226 | 12765 | 38.12 | 1479 | 1448 | 296.9 |
| B | 0 | 189 | 78966 | 275.31 | 1473 | 1436 | 281.6 |
| B | 12 | 111 | 35322 | 120.33 | 1473 | 1436 | 281.6 |
| B | 0 | 190 | 33033 | 112.2 | 1473 | 1436 | 281.6 |
| C | 0 | 239 | 631533 | 1905.73 | 1422 | 1431 | 330.6 |
| C | 14 | 238 | 223371 | 671.25 | 1422 | 1431 | 330.6 |
| C | 7 | 247 | 205522 | 617.27 | 1422 | 1431 | 330.6 |
| D | 1 | 52 | 1265127 | 3628.75 | 1433 | 1391 | 348.3 |
| D | 13 | 104 | 205202 | 585.23 | 1433 | 1391 | 348.3 |
| D | 7 | 238 | 184876 | 526.87 | 1433 | 1391 | 348.3 |
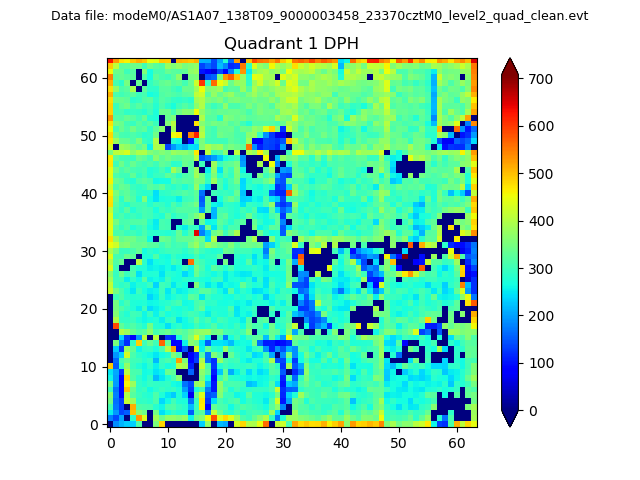
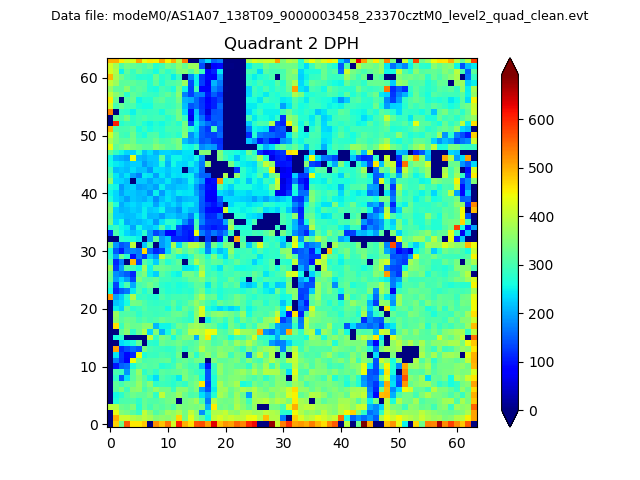
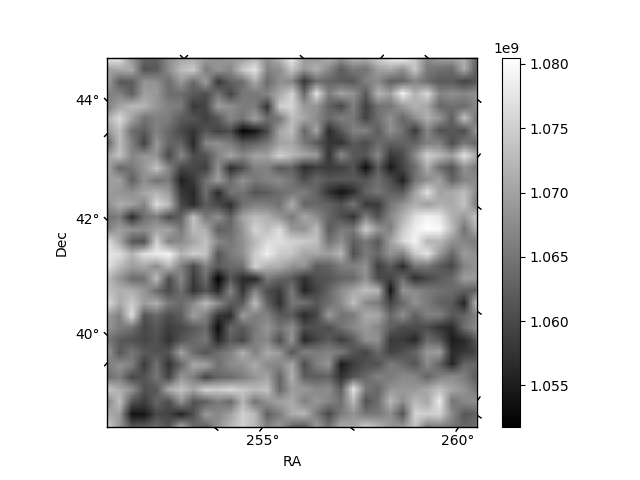
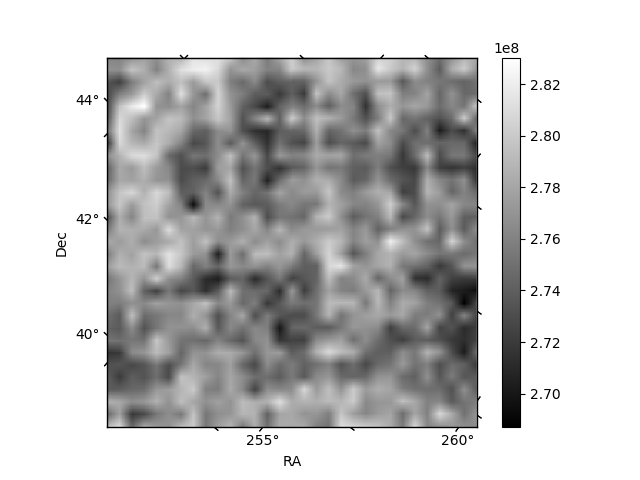
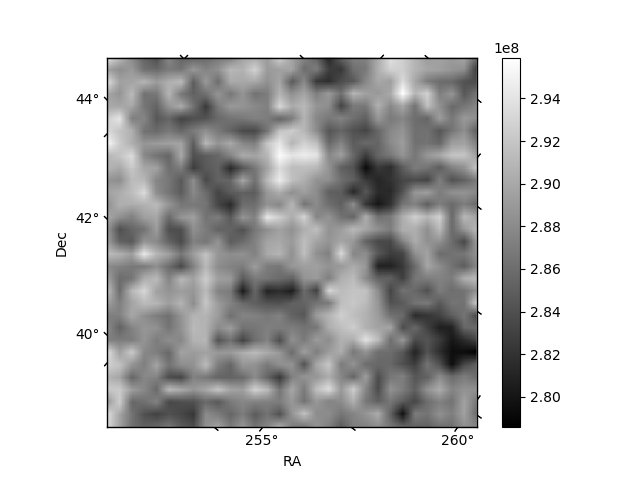
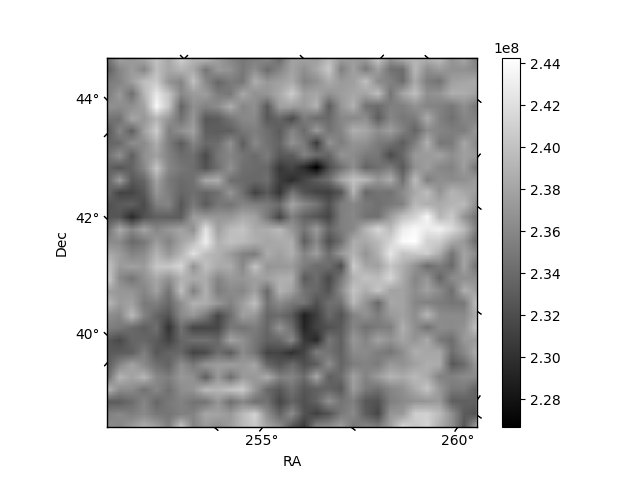
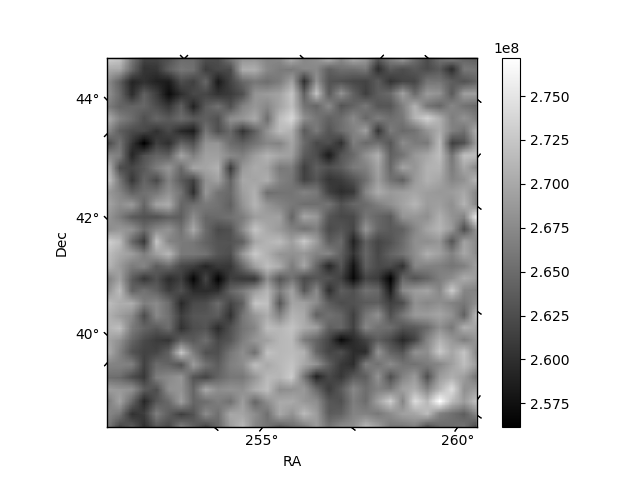
Histogram calculated using DETX and DETY for each event in the final _common_clean file
| Quadrant A | 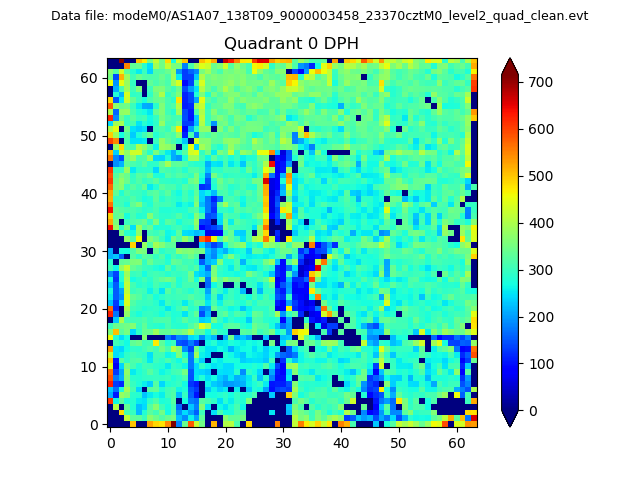 |
 |
Quadrant B |
|---|---|---|---|
| Quadrant D | 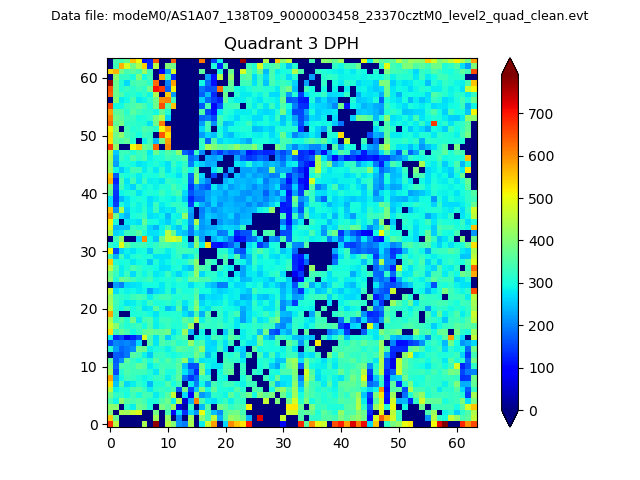 |
 |
Quadrant C |
| Plot type | Count rate plots | Images |
|---|---|---|
| Comparison with Poisson distribution Blue bars denote a histogram of data divided into 1 sec bins. Red curve is a Poisson curve with rate = median count rate of data. |
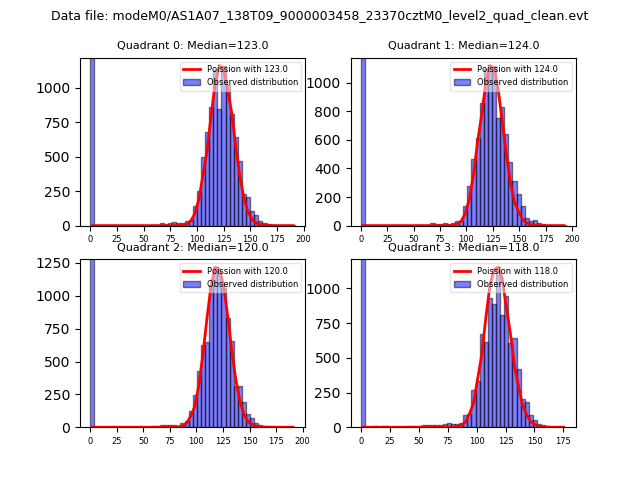 |
 |
| Quadrant-wise count rates Data is divided into 100 sec bins |
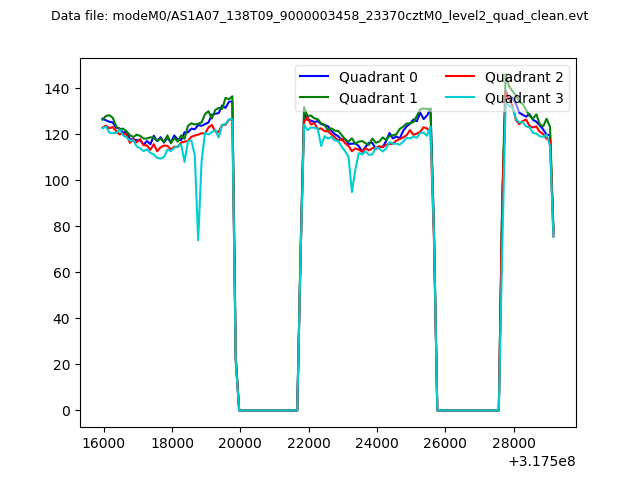 |
|
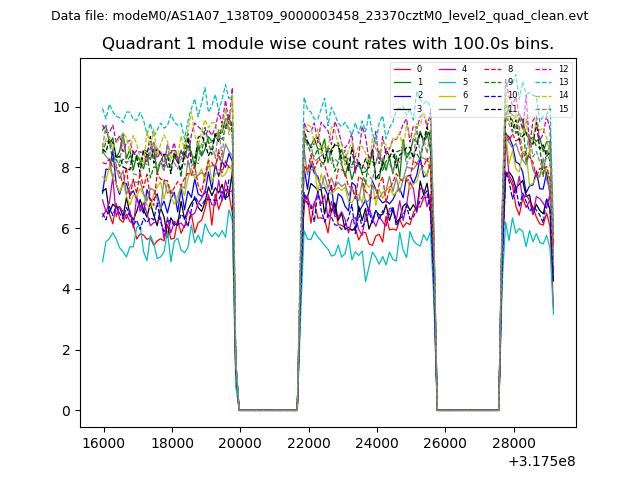
| Module-wise count rates for Quadrant A Data is divided into 100 sec bins |
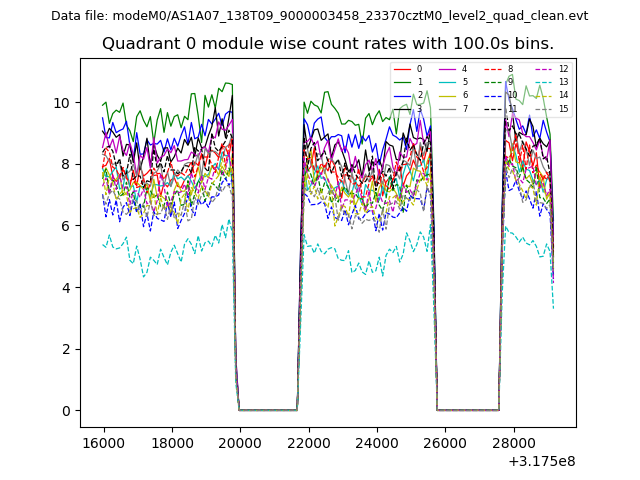 |
 |
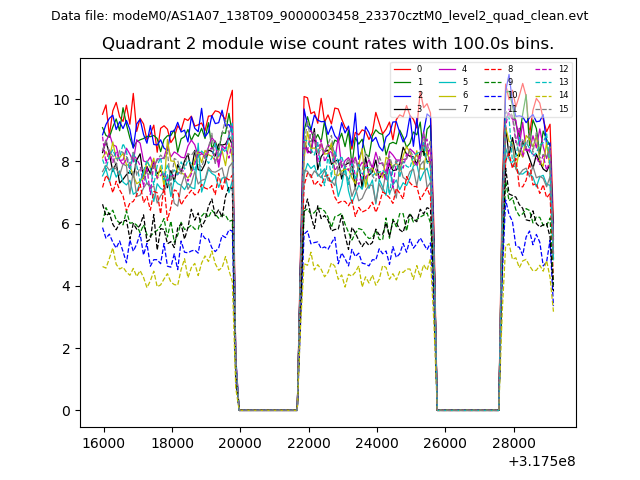
| Module-wise count rates for Quadrant B Data is divided into 100 sec bins |
 |
 |
| Module-wise count rates for Quadrant C Data is divided into 100 sec bins |
 |
 |
| Module-wise count rates for Quadrant D Data is divided into 100 sec bins |
 |
 |
| Parameter | Plot |
|---|---|
| CZT HV Monitor | 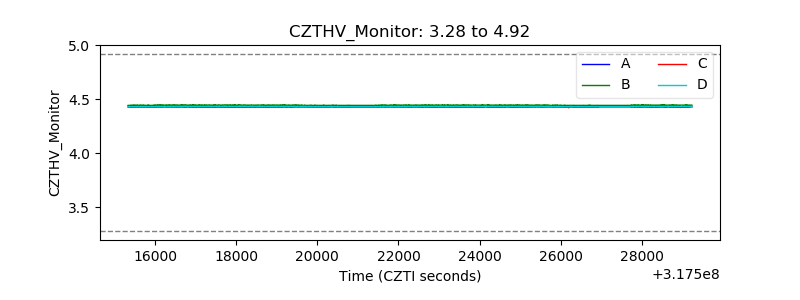 |
| D_VDD | 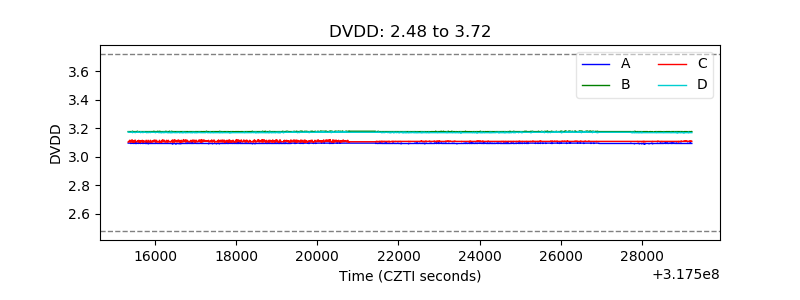 |
| Temperature 1 | 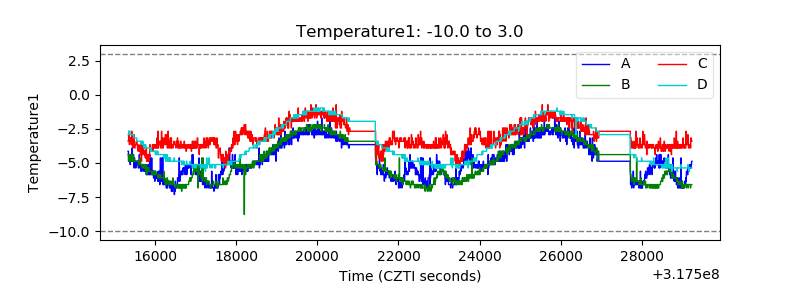 |
| Veto HV Monitor | 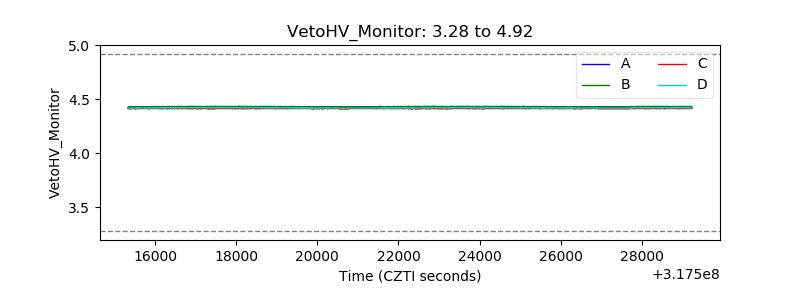 |
| Veto LLD |  |
| Alpha Counter | 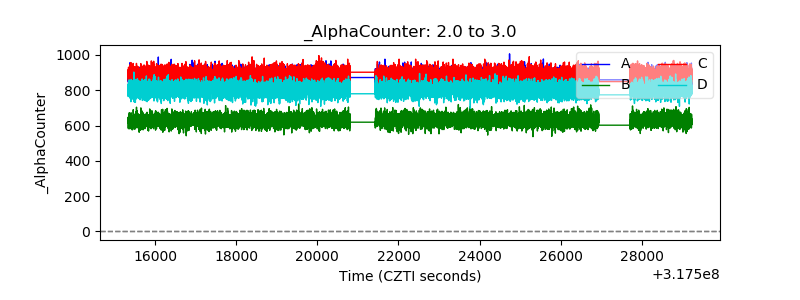 |
| _CPM_Rate | 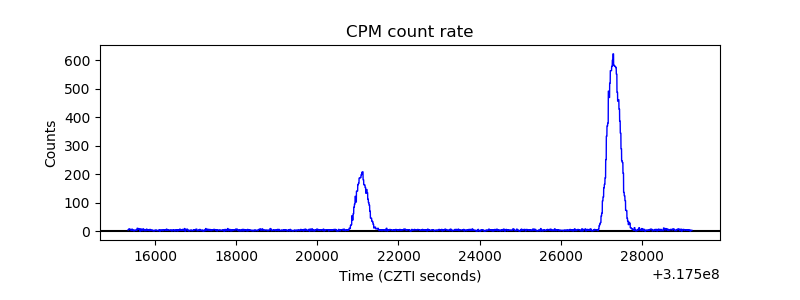 |
| CZT Counter | 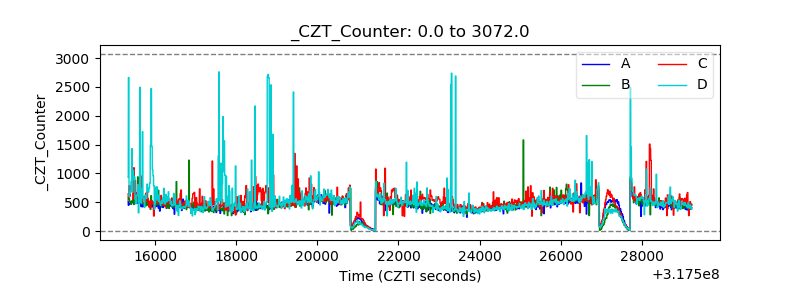 |
| +2.5 Volts monitor |  |
| +5 Volts monitor |  |
| _ROLL_ROT | 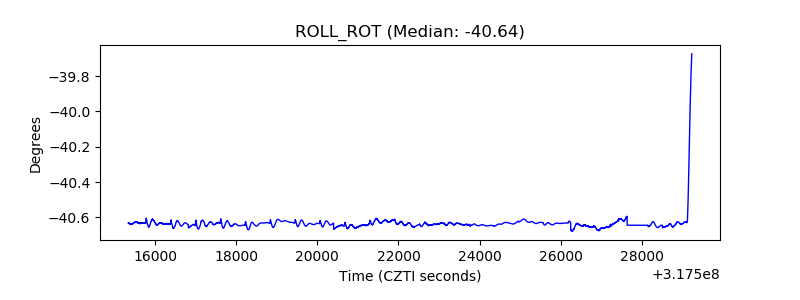 |
| _Roll_DEC | 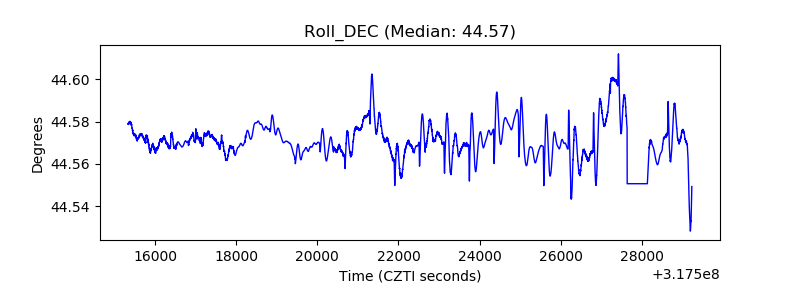 |
| _Roll_RA | 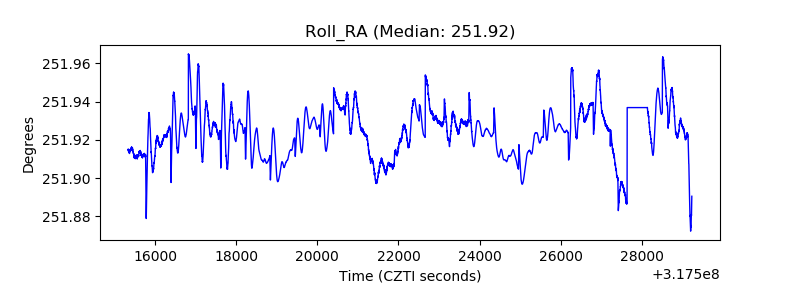 |
| Veto Counter | 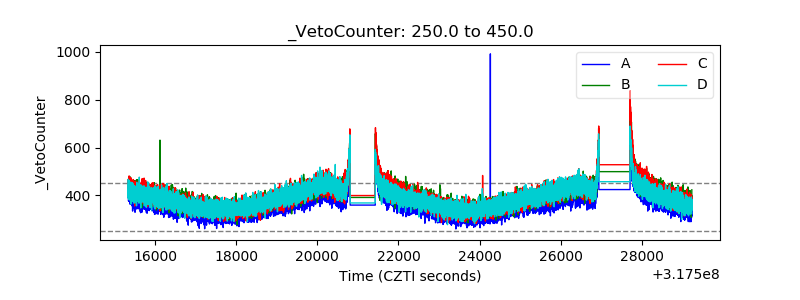 |