| Param | Original file | Final file |
|---|---|---|
| Filename | modeM0/AS1A07_138T09_9000003458_23376cztM0_level2.evt | modeM0/AS1A07_138T09_9000003458_23376cztM0_level2_quad_clean.evt |
| Size (bytes) | 280,152,000 | 56,560,320 |
| Size | 267.2 MB | 53.9 MB |
| Events in quadrant A | 1,877,063 | 372,183 |
| Events in quadrant B | 1,960,076 | 382,547 |
| Events in quadrant C | 1,963,057 | 349,433 |
| Events in quadrant D | 2,437,993 | 353,330 |
| Mode SS | |||
|---|---|---|---|
| Quadrant | BADHDUFLAG | Total packets | Discarded packets |
| A | 0 | 90 | 18 |
| B | 0 | 90 | 14 |
| C | 0 | 94 | 18 |
| D | 0 | 94 | 20 |
| Mode M9 | |||
|---|---|---|---|
| Quadrant | BADHDUFLAG | Total packets | Discarded packets |
| A | 0 | 13 | 1 |
| B | 0 | 13 | 1 |
| C | 0 | 14 | 1 |
| D | 0 | 13 | 1 |
| Mode M0 | |||
|---|---|---|---|
| Quadrant | BADHDUFLAG | Total packets | Discarded packets |
| A | 0 | 9189 | 1623 |
| B | 0 | 9501 | 1649 |
| C | 0 | 9640 | 1800 |
| D | 0 | 11701 | 2160 |
| Quadrant | Total seconds | Saturated seconds | Saturation percentage |
|---|---|---|---|
| A | 3594 | 30 | 0.834725% |
| B | 3623 | 30 | 0.828043% |
| C | 3588 | 39 | 1.086957% |
| D | 3582 | 82 | 2.289224% |
Noise dominated data is calculated using 1-second bins in cleaned event files. If a bin has >2000 counts, and if more than 50% of those come from <1% of pixels, then it is considered to be noise-dominated and hence unusable.
| Quadrant | # 1 sec bins | Bins with >0 counts | Bins with >2000 counts | High rate bins dominated by noise | Noise dominated (total time) | Noise dominated (detector-on time) | Marked lightcurve |
|---|---|---|---|---|---|---|---|
| A | 6819 | 3785 | 0 | 0 | 0.00% | 0.00% | 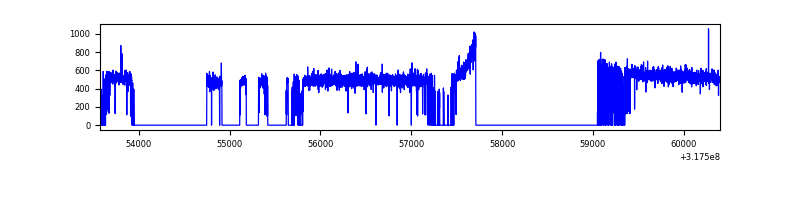 |
| B | 6808 | 3800 | 3 | 3 | 0.04% | 0.08% | 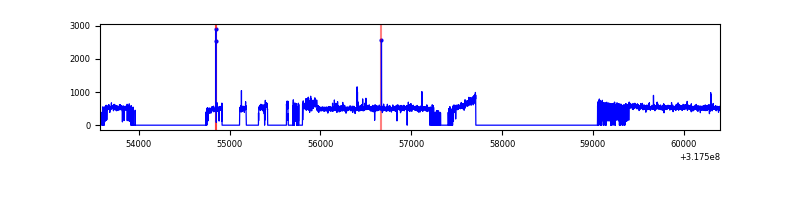 |
| C | 6823 | 3758 | 0 | 0 | 0.00% | 0.00% | 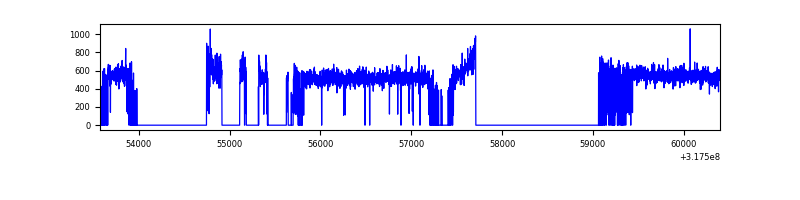 |
| D | 6803 | 3758 | 52 | 52 | 0.76% | 1.38% | 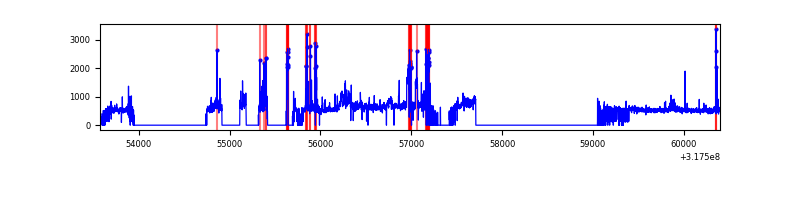 |
Top three noisy pixels from each quadrant. If the there are fewer than three noisy pixels in the level2.evt file, extra rows are filled as -1
| Pixel properties | Quadrant properties | ||||||
|---|---|---|---|---|---|---|---|
| Quadrant | DetID | PixID | Counts | Sigma | Mean | Median | Sigma |
| A | 13 | 254 | 5379 | 49.79 | 487 | 477 | 98.4 |
| A | 0 | 226 | 4363 | 39.47 | 487 | 477 | 98.4 |
| A | 3 | 137 | 4033 | 36.12 | 487 | 477 | 98.4 |
| B | 0 | 189 | 61718 | 674.32 | 481 | 471 | 90.8 |
| B | 12 | 111 | 10369 | 108.98 | 481 | 471 | 90.8 |
| B | 11 | 111 | 9225 | 96.38 | 481 | 471 | 90.8 |
| C | 14 | 238 | 75198 | 691.56 | 464 | 467 | 108.1 |
| C | 0 | 239 | 56347 | 517.12 | 464 | 467 | 108.1 |
| C | 3 | 233 | 17326 | 156.01 | 464 | 467 | 108.1 |
| D | 1 | 52 | 382893 | 3386.48 | 472 | 459 | 112.9 |
| D | 15 | 0 | 172040 | 1519.36 | 472 | 459 | 112.9 |
| D | 7 | 238 | 53154 | 466.62 | 472 | 459 | 112.9 |
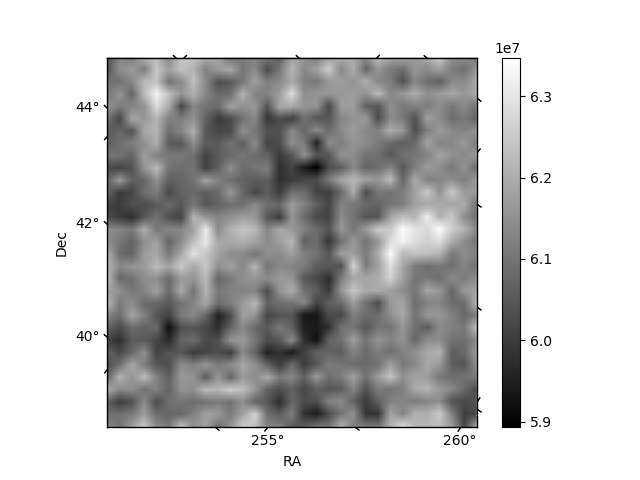
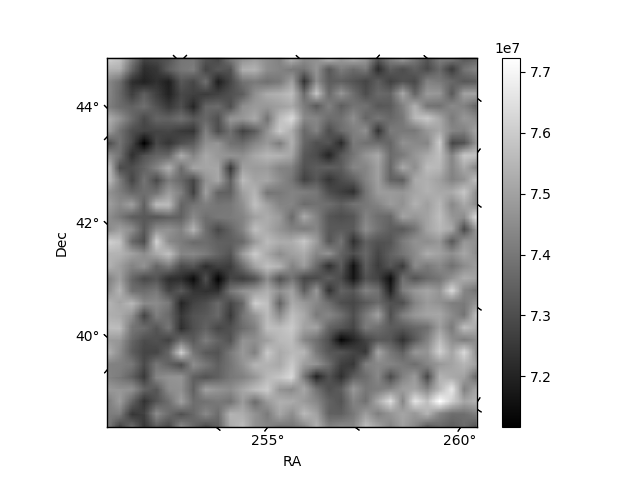
Histogram calculated using DETX and DETY for each event in the final _common_clean file
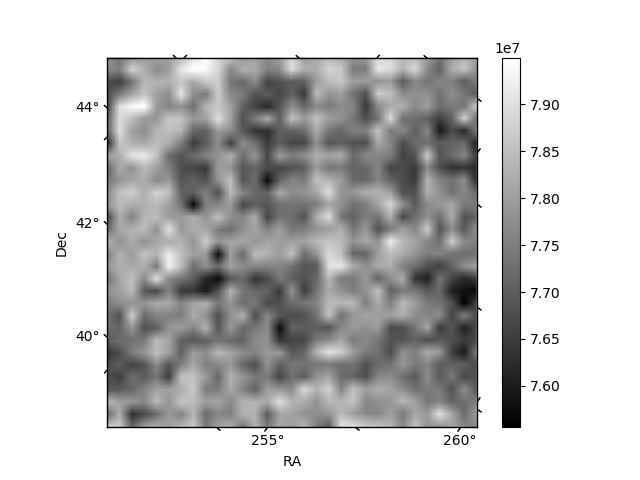
| Quadrant A | 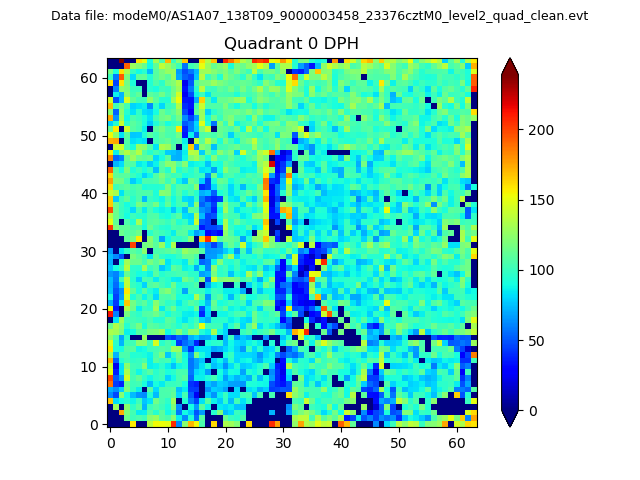 |
 |
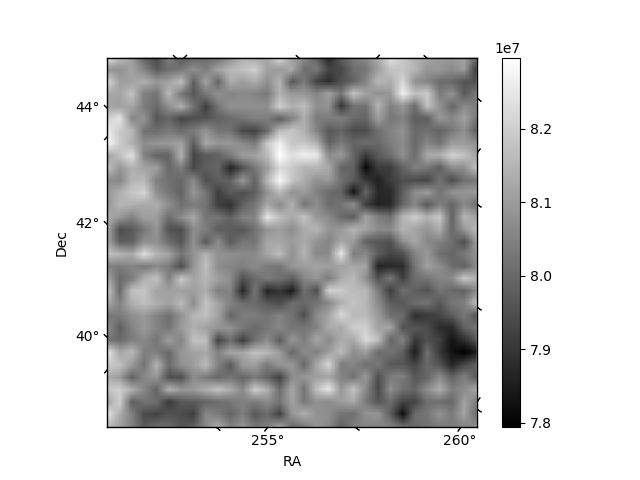
Quadrant B |
|---|---|---|---|
| Quadrant D | 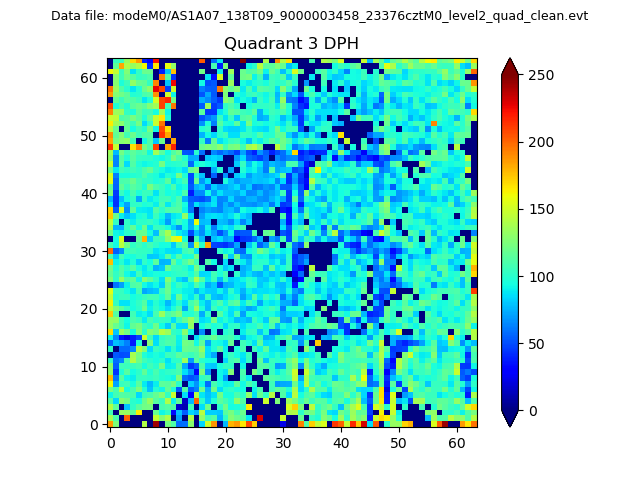 |
 |
Quadrant C |
| Plot type | Count rate plots | Images |
|---|---|---|
| Comparison with Poisson distribution Blue bars denote a histogram of data divided into 1 sec bins. Red curve is a Poisson curve with rate = median count rate of data. |
 |
 |
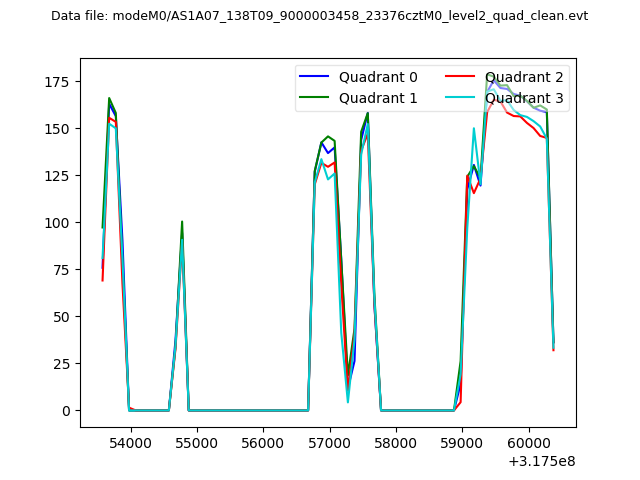
| Quadrant-wise count rates Data is divided into 100 sec bins |
 |
|
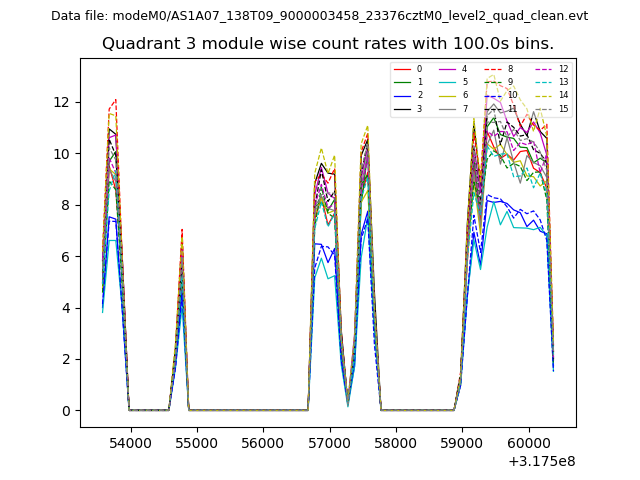
| Module-wise count rates for Quadrant A Data is divided into 100 sec bins |
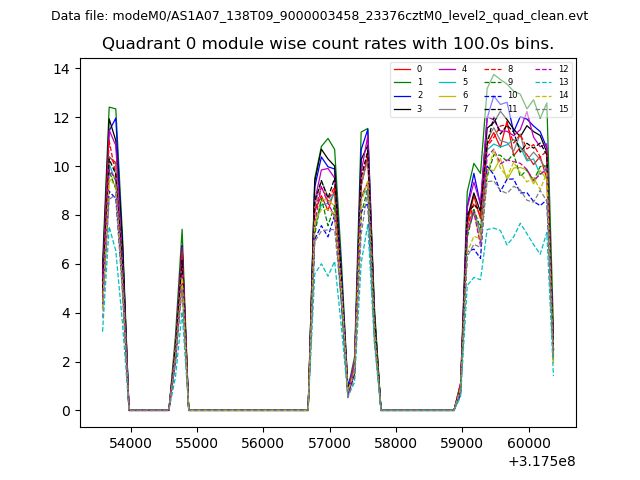 |
 |
| Module-wise count rates for Quadrant B Data is divided into 100 sec bins |
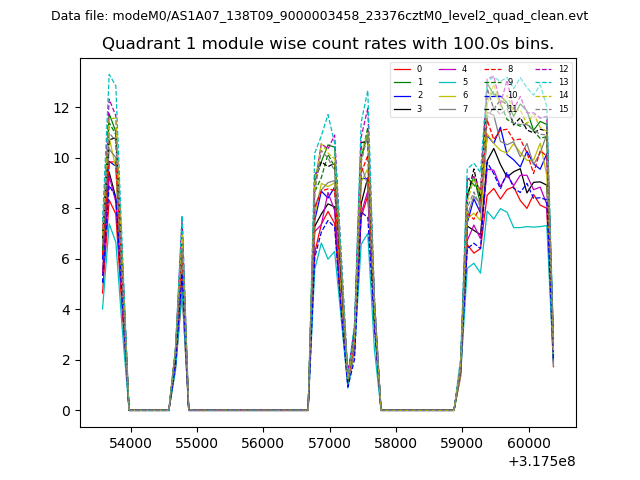 |
 |
| Module-wise count rates for Quadrant C Data is divided into 100 sec bins |
 |
 |
| Module-wise count rates for Quadrant D Data is divided into 100 sec bins |
 |
 |
| Parameter | Plot |
|---|---|
| CZT HV Monitor |  |
| D_VDD | 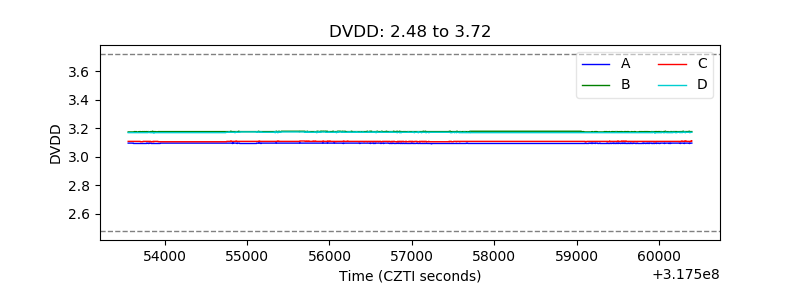 |
| Temperature 1 | 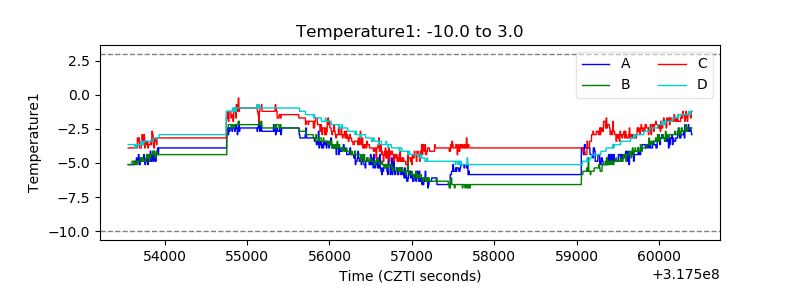 |
| Veto HV Monitor | 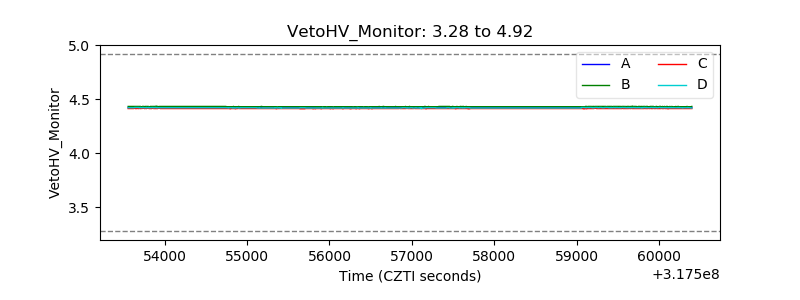 |
| Veto LLD | 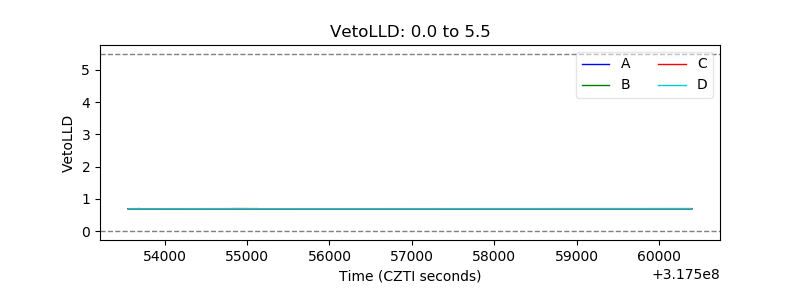 |
| Alpha Counter | 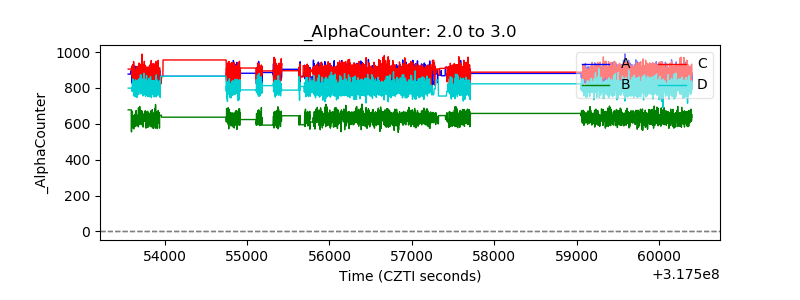 |
| _CPM_Rate | 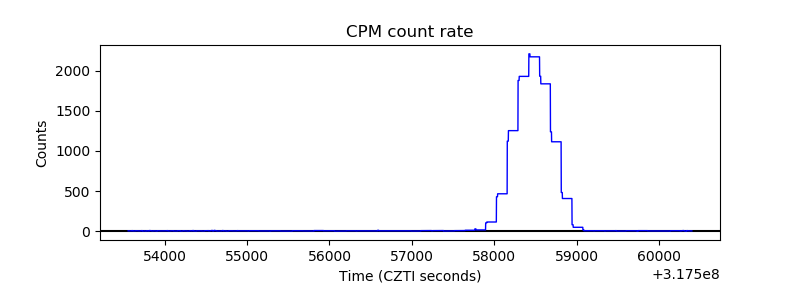 |
| CZT Counter | 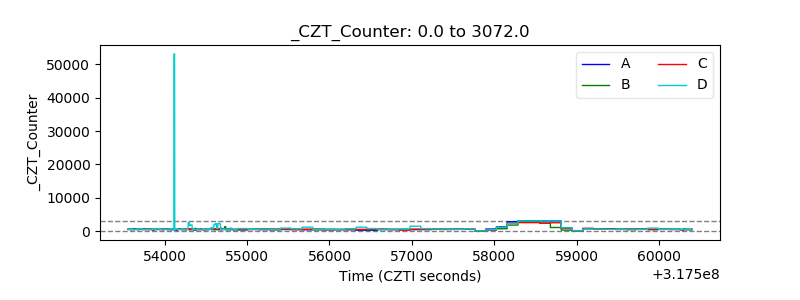 |
| +2.5 Volts monitor |  |
| +5 Volts monitor | 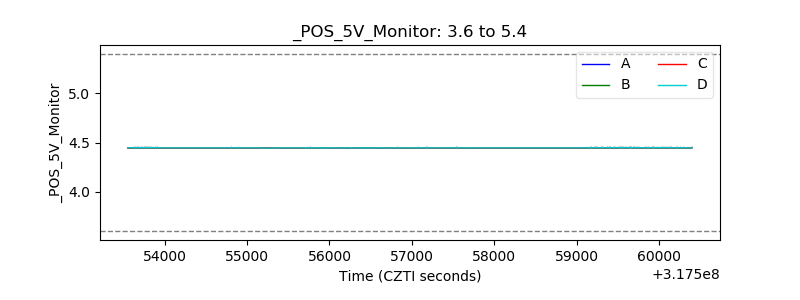 |
| _ROLL_ROT | 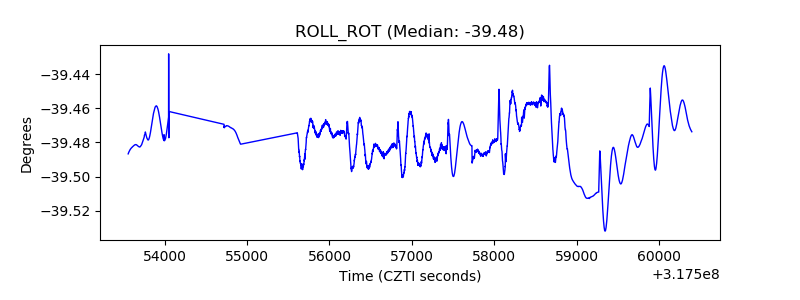 |
| _Roll_DEC | 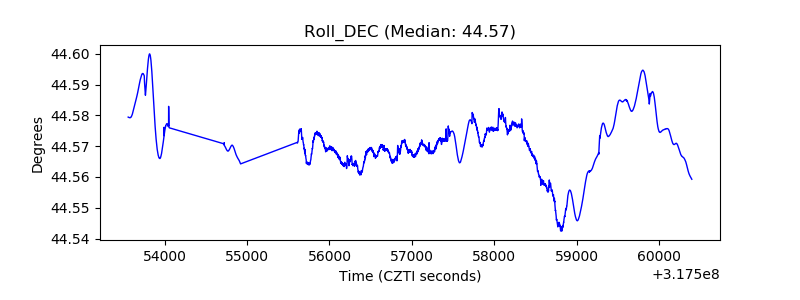 |
| _Roll_RA | 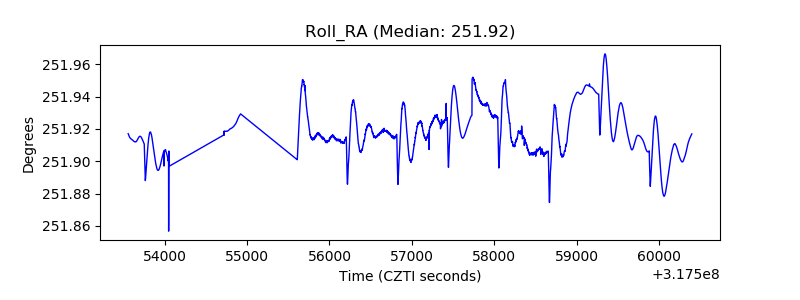 |
| Veto Counter | 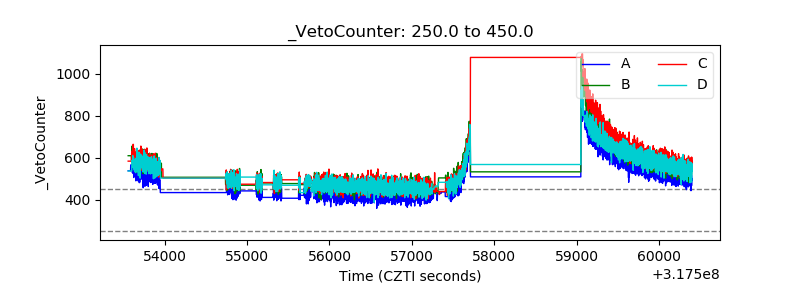 |