| Param | Original file | Final file |
|---|---|---|
| Filename | modeM0/AS1A07_138T09_9000003458_23377cztM0_level2.evt | modeM0/AS1A07_138T09_9000003458_23377cztM0_level2_quad_clean.evt |
| Size (bytes) | 853,738,560 | 152,144,640 |
| Size | 814.2 MB | 145.1 MB |
| Events in quadrant A | 5,386,553 | 990,633 |
| Events in quadrant B | 5,615,573 | 1,003,723 |
| Events in quadrant C | 5,868,574 | 960,489 |
| Events in quadrant D | 8,275,164 | 925,616 |
| Mode SS | |||
|---|---|---|---|
| Quadrant | BADHDUFLAG | Total packets | Discarded packets |
| A | 0 | 214 | 0 |
| B | 0 | 214 | 0 |
| C | 0 | 214 | 0 |
| D | 0 | 214 | 0 |
| Mode M9 | |||
|---|---|---|---|
| Quadrant | BADHDUFLAG | Total packets | Discarded packets |
| A | 0 | 26 | 0 |
| B | 0 | 26 | 0 |
| C | 0 | 26 | 0 |
| D | 0 | 26 | 0 |
| Mode M0 | |||
|---|---|---|---|
| Quadrant | BADHDUFLAG | Total packets | Discarded packets |
| A | 0 | 21929 | 2 |
| B | 0 | 22728 | 2 |
| C | 0 | 23665 | 4 |
| D | 0 | 31748 | 2 |
| Quadrant | Total seconds | Saturated seconds | Saturation percentage |
|---|---|---|---|
| A | 10502 | 126 | 1.199771% |
| B | 10503 | 117 | 1.113967% |
| C | 10502 | 161 | 1.533041% |
| D | 10503 | 462 | 4.398743% |
Noise dominated data is calculated using 1-second bins in cleaned event files. If a bin has >2000 counts, and if more than 50% of those come from <1% of pixels, then it is considered to be noise-dominated and hence unusable.
| Quadrant | # 1 sec bins | Bins with >0 counts | Bins with >2000 counts | High rate bins dominated by noise | Noise dominated (total time) | Noise dominated (detector-on time) | Marked lightcurve |
|---|---|---|---|---|---|---|---|
| A | 13147 | 10503 | 0 | 0 | 0.00% | 0.00% | 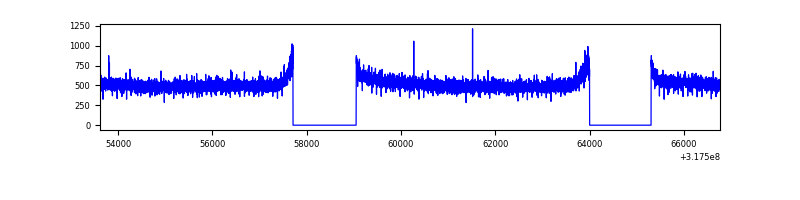 |
| B | 13148 | 10504 | 3 | 3 | 0.02% | 0.03% | 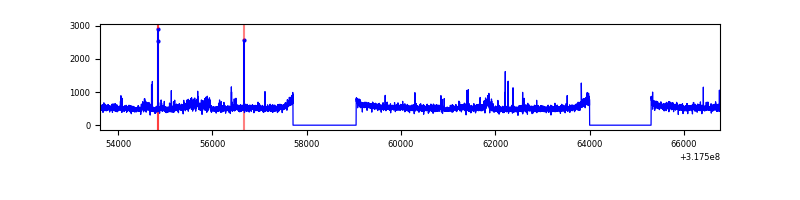 |
| C | 13148 | 10504 | 2 | 2 | 0.02% | 0.02% | 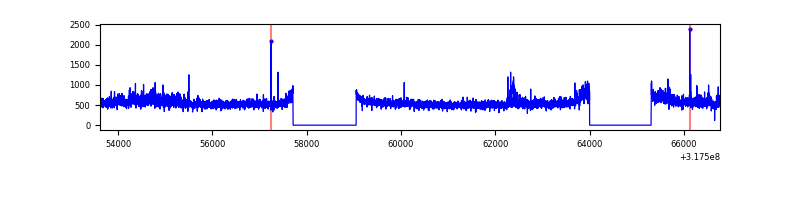 |
| D | 13148 | 10504 | 351 | 351 | 2.67% | 3.34% | 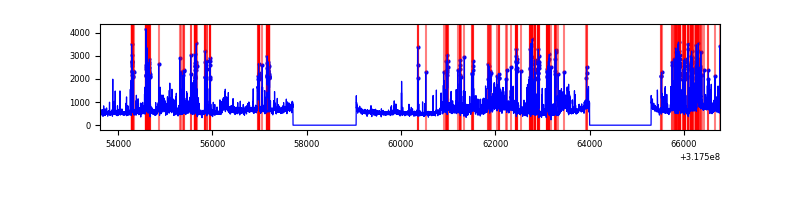 |
Top three noisy pixels from each quadrant. If the there are fewer than three noisy pixels in the level2.evt file, extra rows are filled as -1
| Pixel properties | Quadrant properties | ||||||
|---|---|---|---|---|---|---|---|
| Quadrant | DetID | PixID | Counts | Sigma | Mean | Median | Sigma |
| A | 13 | 254 | 16174 | 53.48 | 1398 | 1371 | 276.8 |
| A | 0 | 226 | 12355 | 39.68 | 1398 | 1371 | 276.8 |
| A | 3 | 137 | 11241 | 35.66 | 1398 | 1371 | 276.8 |
| B | 0 | 189 | 181113 | 715.29 | 1370 | 1343 | 251.3 |
| B | 0 | 190 | 49670 | 192.29 | 1370 | 1343 | 251.3 |
| B | 12 | 111 | 29427 | 111.74 | 1370 | 1343 | 251.3 |
| C | 0 | 239 | 317812 | 1037.35 | 1334 | 1342 | 305.1 |
| C | 14 | 238 | 216598 | 705.58 | 1334 | 1342 | 305.1 |
| C | 3 | 233 | 50166 | 160.04 | 1334 | 1342 | 305.1 |
| D | 1 | 52 | 2538779 | 7790.75 | 1354 | 1318 | 325.7 |
| D | 15 | 0 | 208395 | 635.79 | 1354 | 1318 | 325.7 |
| D | 7 | 238 | 161454 | 491.66 | 1354 | 1318 | 325.7 |
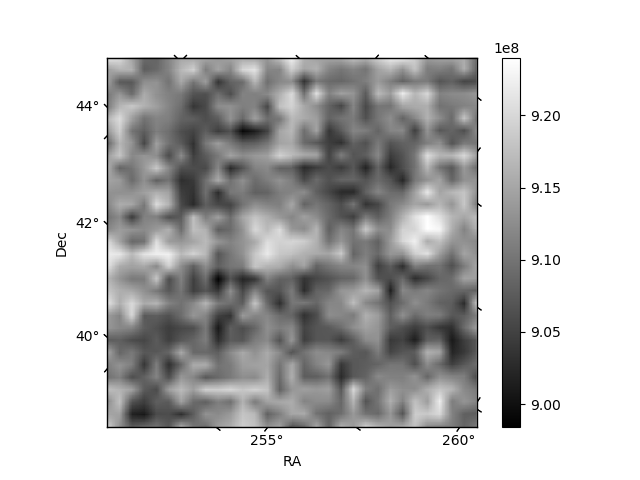
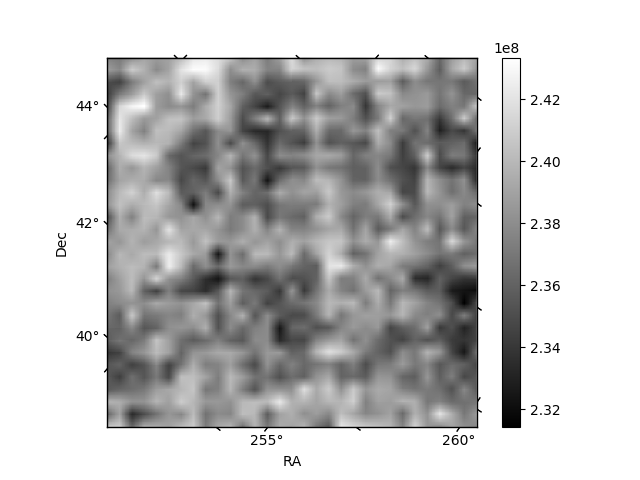
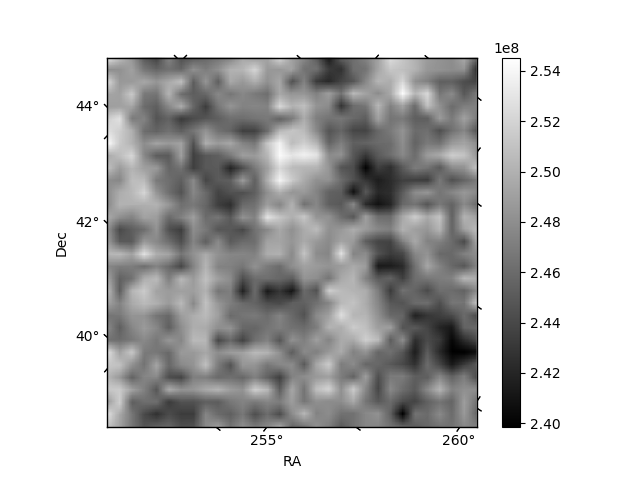
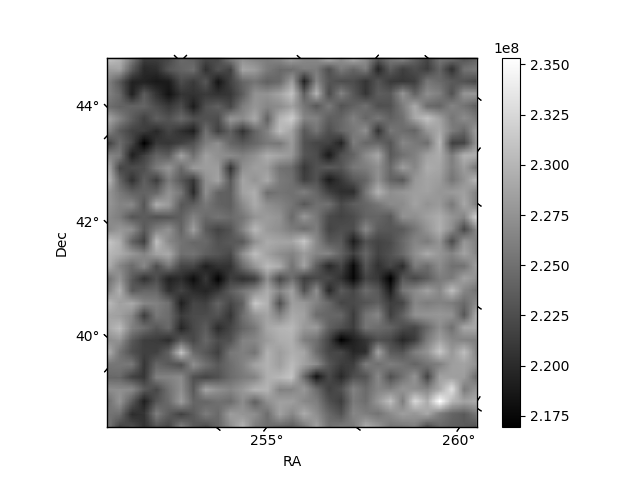
Histogram calculated using DETX and DETY for each event in the final _common_clean file
| Quadrant A | 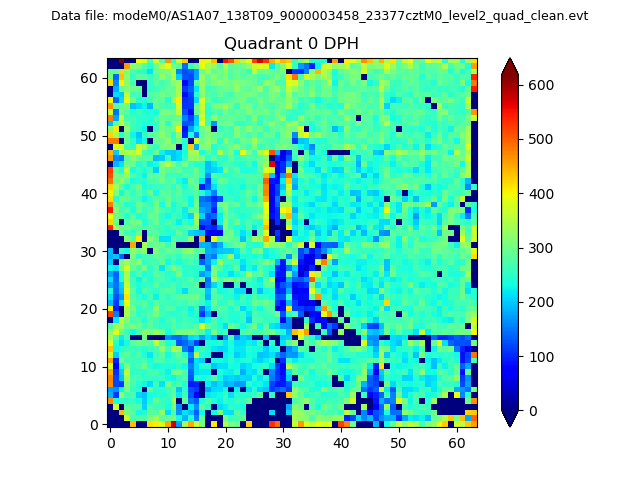 |
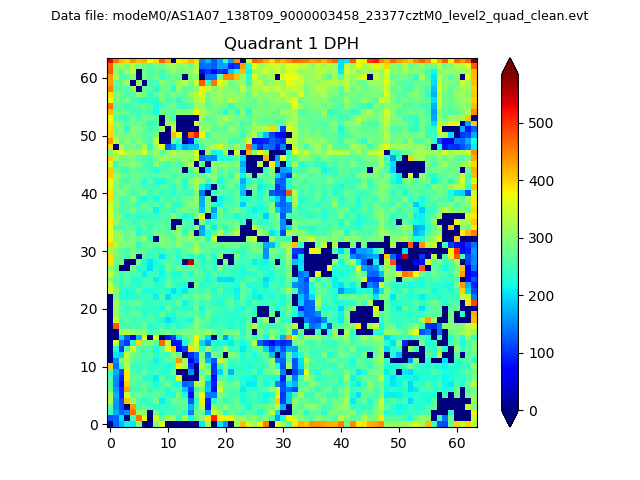 |
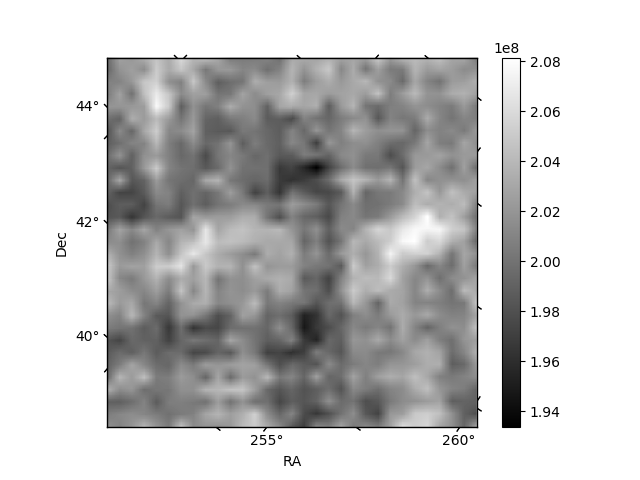
Quadrant B |
|---|---|---|---|
| Quadrant D | 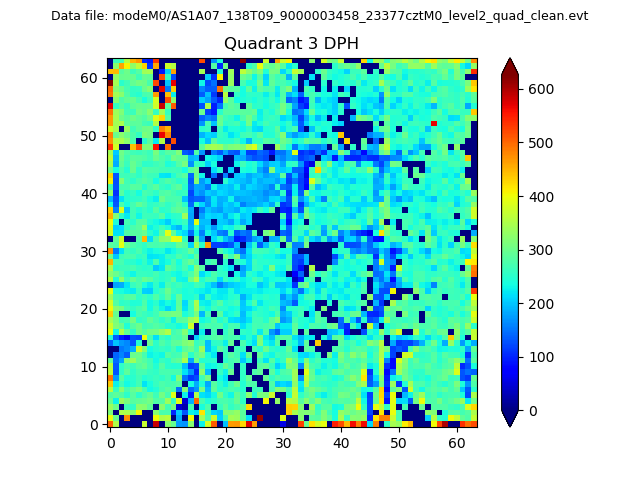 |
 |
Quadrant C |
| Plot type | Count rate plots | Images |
|---|---|---|
| Comparison with Poisson distribution Blue bars denote a histogram of data divided into 1 sec bins. Red curve is a Poisson curve with rate = median count rate of data. |
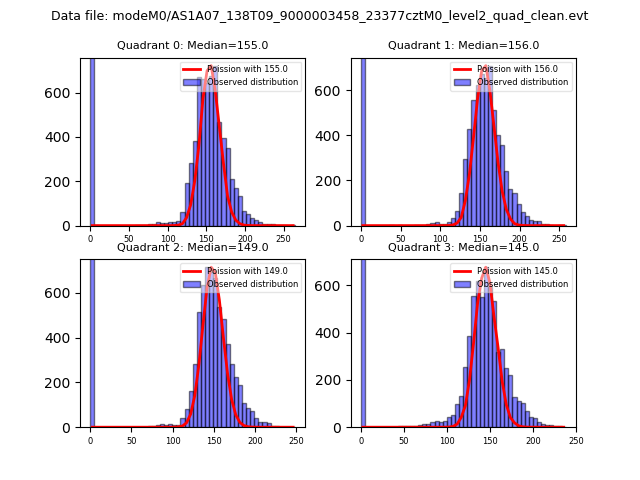 |
 |
| Quadrant-wise count rates Data is divided into 100 sec bins |
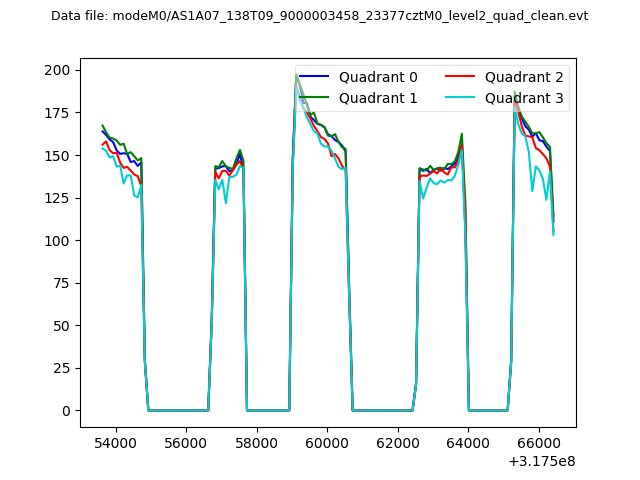 |
|
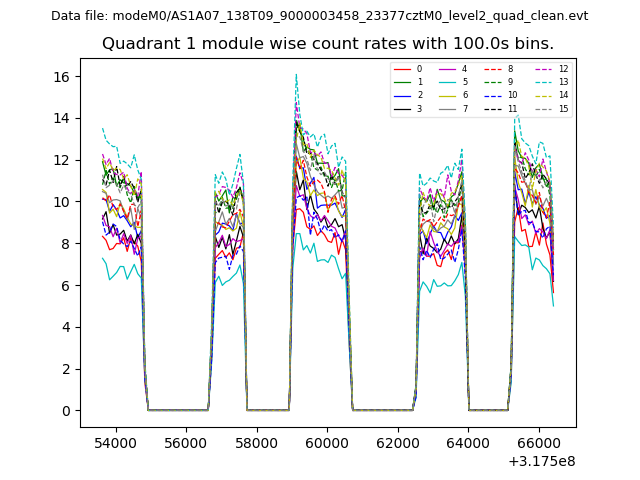
| Module-wise count rates for Quadrant A Data is divided into 100 sec bins |
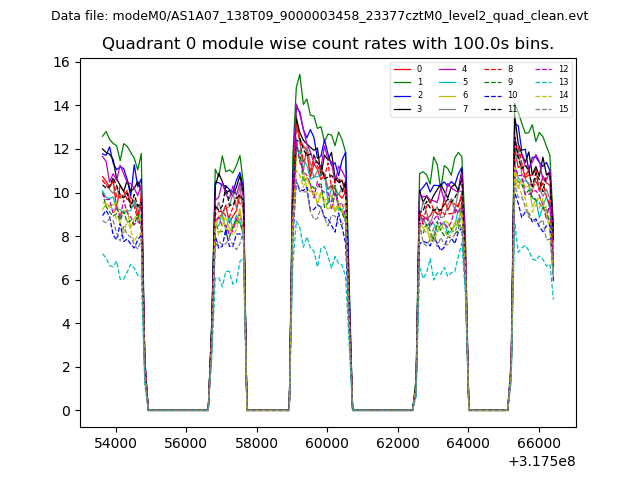 |
 |
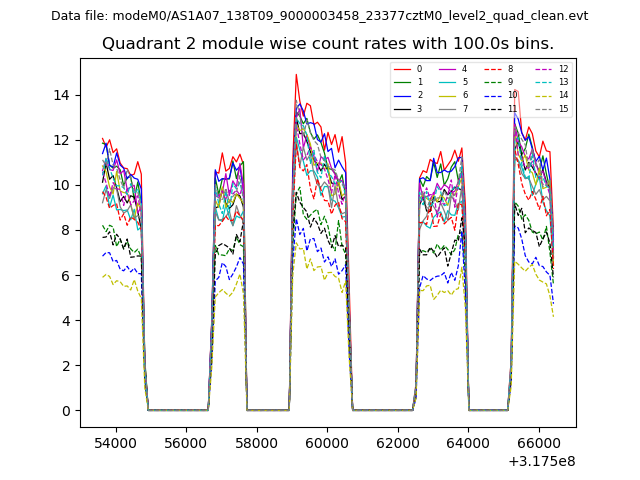
| Module-wise count rates for Quadrant B Data is divided into 100 sec bins |
 |
 |
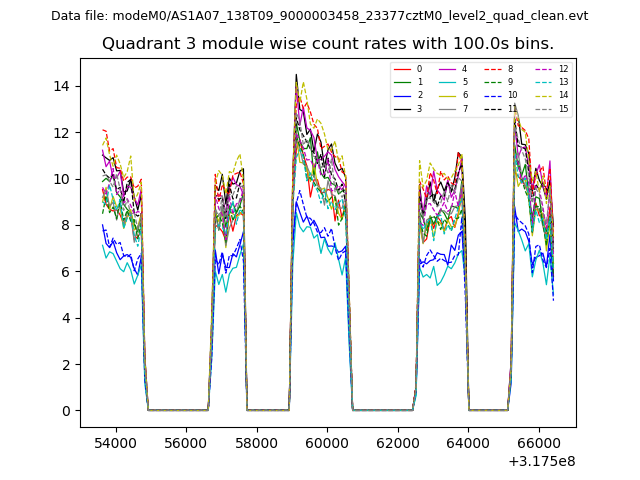
| Module-wise count rates for Quadrant C Data is divided into 100 sec bins |
 |
 |
| Module-wise count rates for Quadrant D Data is divided into 100 sec bins |
 |
 |
| Parameter | Plot |
|---|---|
| CZT HV Monitor | 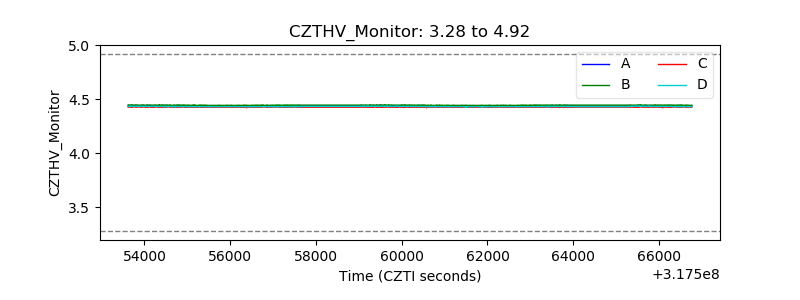 |
| D_VDD | 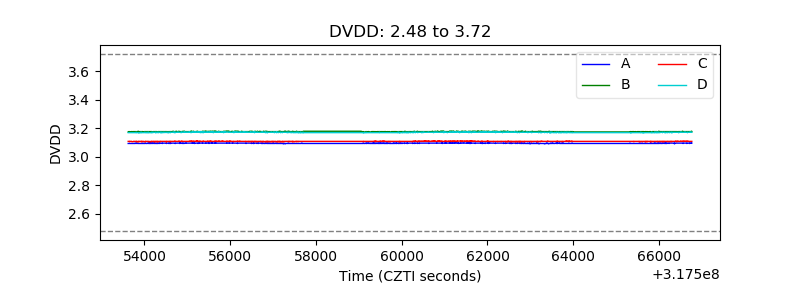 |
| Temperature 1 | 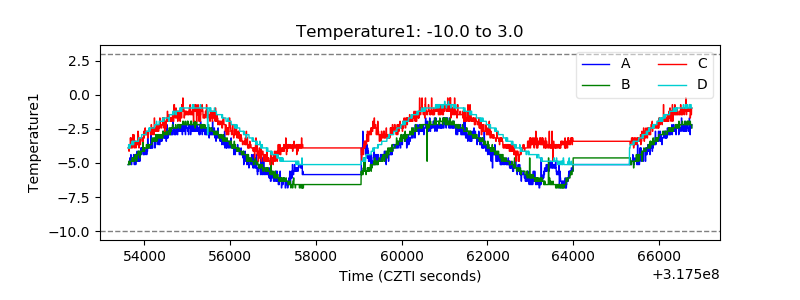 |
| Veto HV Monitor | 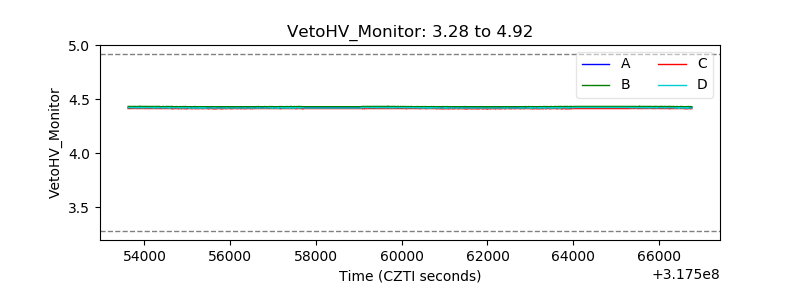 |
| Veto LLD | 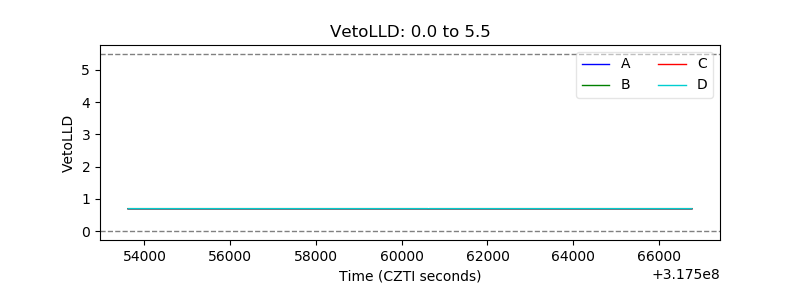 |
| Alpha Counter | 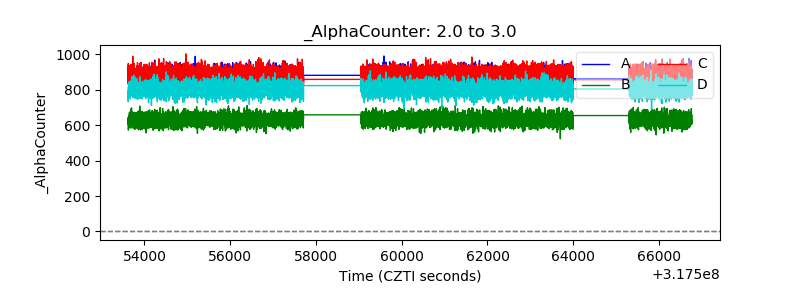 |
| _CPM_Rate | 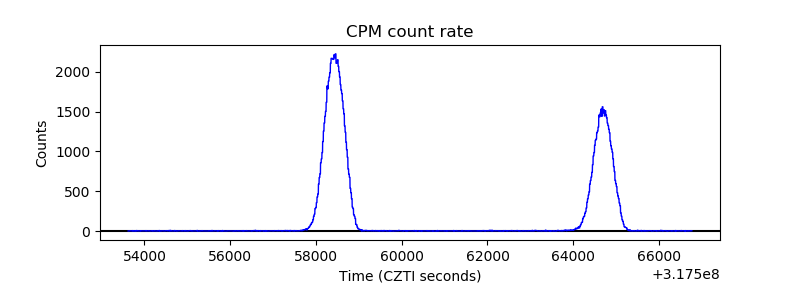 |
| CZT Counter |  |
| +2.5 Volts monitor |  |
| +5 Volts monitor | 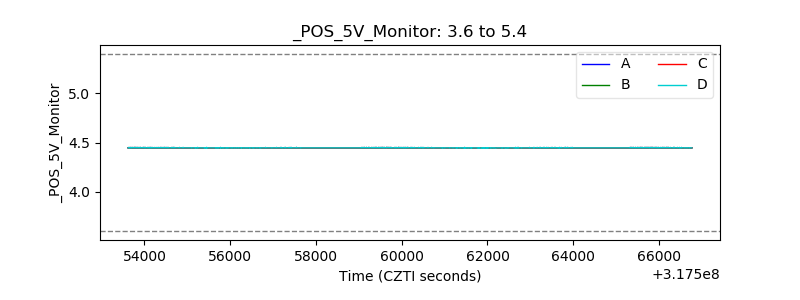 |
| _ROLL_ROT | 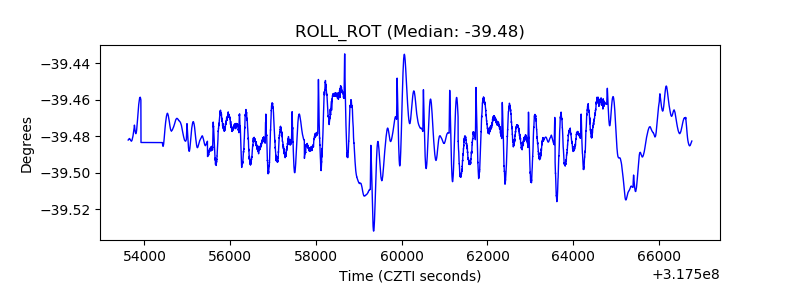 |
| _Roll_DEC | 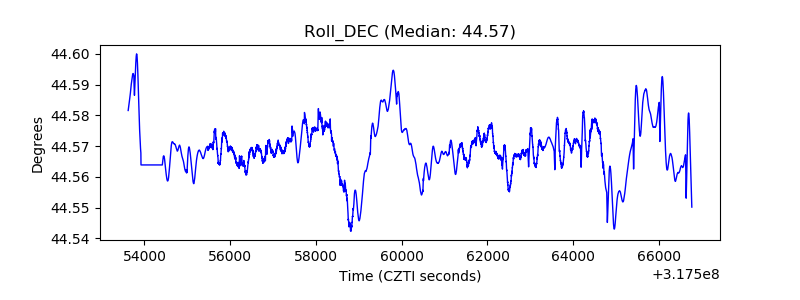 |
| _Roll_RA |  |
| Veto Counter | 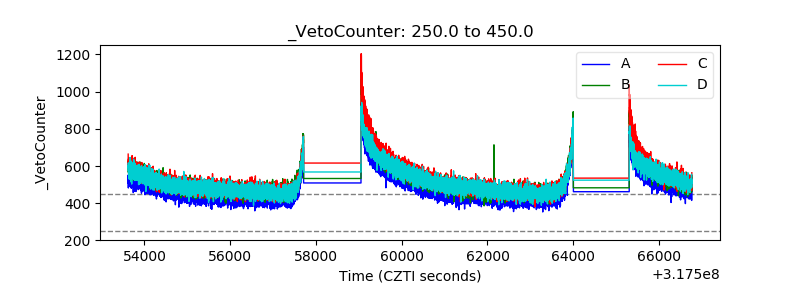 |