| Param | Original file | Final file |
|---|---|---|
| Filename | modeM0/AS1A07_138T09_9000003458_23378cztM0_level2.evt | modeM0/AS1A07_138T09_9000003458_23378cztM0_level2_quad_clean.evt |
| Size (bytes) | 515,050,560 | 83,476,800 |
| Size | 491.2 MB | 79.6 MB |
| Events in quadrant A | 3,094,362 | 537,937 |
| Events in quadrant B | 3,186,292 | 541,993 |
| Events in quadrant C | 3,983,102 | 515,508 |
| Events in quadrant D | 4,916,323 | 501,436 |
| Mode SS | |||
|---|---|---|---|
| Quadrant | BADHDUFLAG | Total packets | Discarded packets |
| A | 0 | 126 | 0 |
| B | 0 | 126 | 0 |
| C | 0 | 126 | 0 |
| D | 0 | 126 | 0 |
| Mode M9 | |||
|---|---|---|---|
| Quadrant | BADHDUFLAG | Total packets | Discarded packets |
| A | 0 | 12 | 0 |
| B | 0 | 12 | 0 |
| C | 0 | 12 | 0 |
| D | 0 | 12 | 0 |
| Mode M0 | |||
|---|---|---|---|
| Quadrant | BADHDUFLAG | Total packets | Discarded packets |
| A | 0 | 12737 | 1 |
| B | 0 | 13014 | 1 |
| C | 0 | 15617 | 1 |
| D | 0 | 18982 | 1 |
| Quadrant | Total seconds | Saturated seconds | Saturation percentage |
|---|---|---|---|
| A | 6169 | 67 | 1.086076% |
| B | 6170 | 73 | 1.183144% |
| C | 6170 | 213 | 3.452188% |
| D | 6170 | 225 | 3.646677% |
Noise dominated data is calculated using 1-second bins in cleaned event files. If a bin has >2000 counts, and if more than 50% of those come from <1% of pixels, then it is considered to be noise-dominated and hence unusable.
| Quadrant | # 1 sec bins | Bins with >0 counts | Bins with >2000 counts | High rate bins dominated by noise | Noise dominated (total time) | Noise dominated (detector-on time) | Marked lightcurve |
|---|---|---|---|---|---|---|---|
| A | 7349 | 6170 | 0 | 0 | 0.00% | 0.00% | 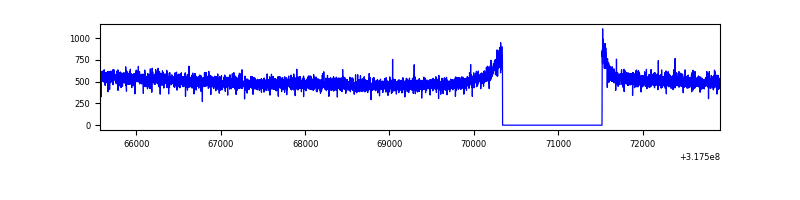 |
| B | 7350 | 6171 | 0 | 0 | 0.00% | 0.00% | 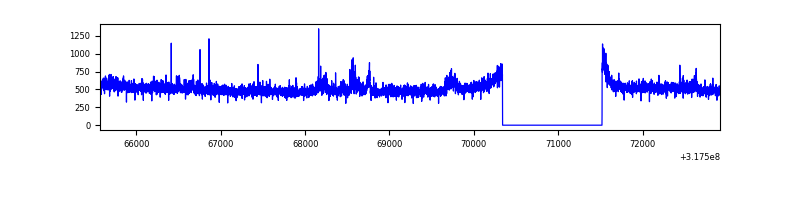 |
| C | 7350 | 6170 | 62 | 62 | 0.84% | 1.00% | 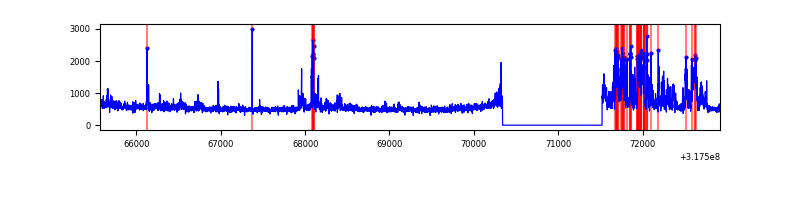 |
| D | 7350 | 6171 | 133 | 133 | 1.81% | 2.16% | 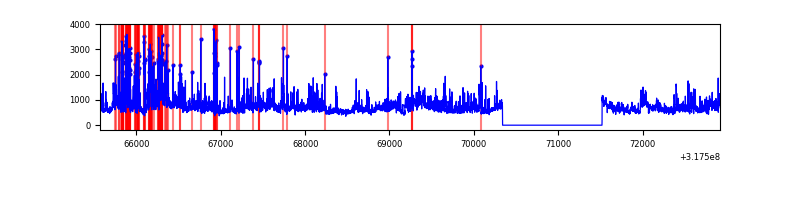 |
Top three noisy pixels from each quadrant. If the there are fewer than three noisy pixels in the level2.evt file, extra rows are filled as -1
| Pixel properties | Quadrant properties | ||||||
|---|---|---|---|---|---|---|---|
| Quadrant | DetID | PixID | Counts | Sigma | Mean | Median | Sigma |
| A | 13 | 254 | 9734 | 56.06 | 803 | 786 | 159.6 |
| A | 0 | 226 | 7043 | 39.2 | 803 | 786 | 159.6 |
| A | 3 | 137 | 6493 | 35.75 | 803 | 786 | 159.6 |
| B | 0 | 189 | 71476 | 473.96 | 790 | 770 | 149.2 |
| B | 0 | 190 | 21389 | 138.21 | 790 | 770 | 149.2 |
| B | 12 | 111 | 17376 | 111.31 | 790 | 770 | 149.2 |
| C | 0 | 239 | 715215 | 4044.89 | 765 | 771 | 176.6 |
| C | 14 | 238 | 121956 | 686.1 | 765 | 771 | 176.6 |
| C | 7 | 247 | 103186 | 579.83 | 765 | 771 | 176.6 |
| D | 1 | 52 | 1786278 | 9452.35 | 780 | 759 | 188.9 |
| D | 7 | 223 | 58116 | 303.64 | 780 | 759 | 188.9 |
| D | 13 | 104 | 48443 | 252.43 | 780 | 759 | 188.9 |
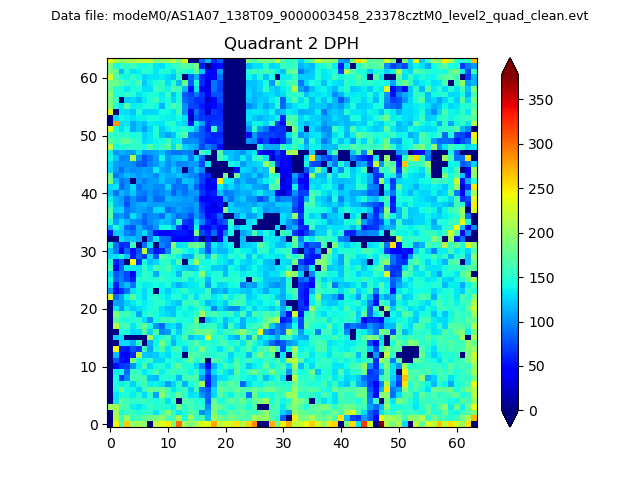
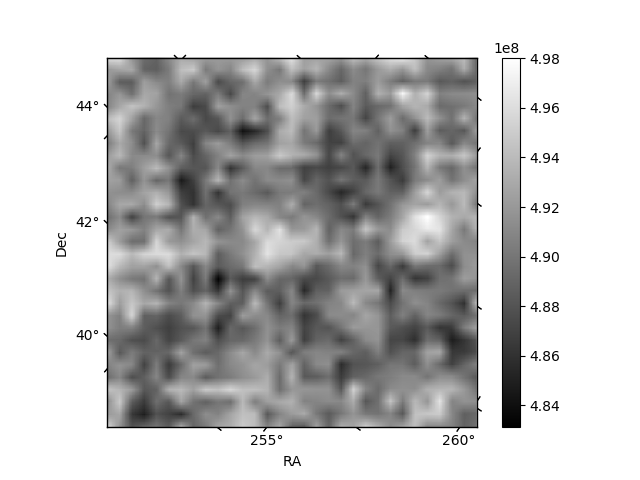
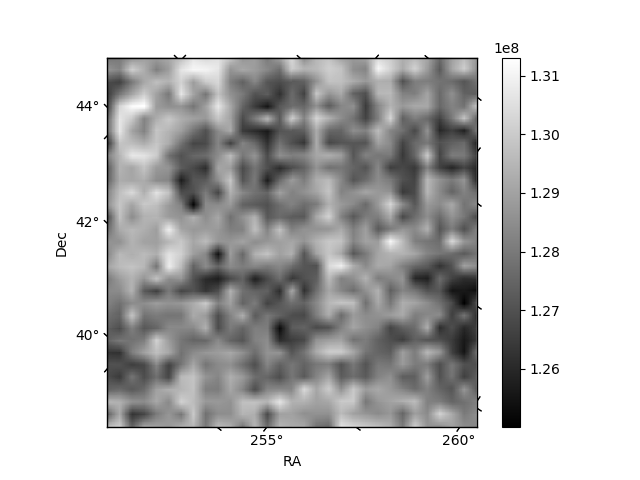
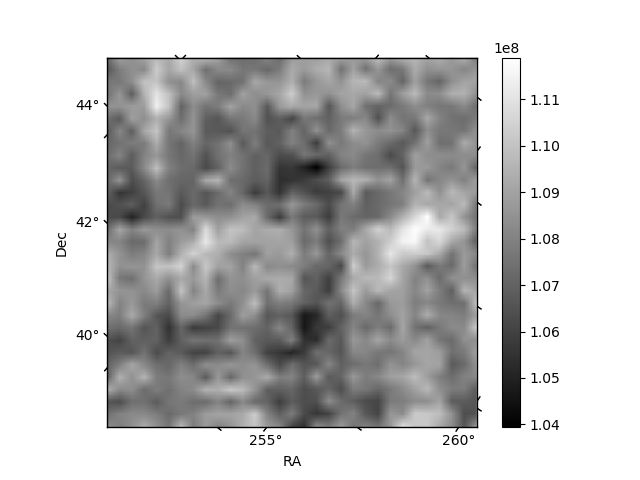
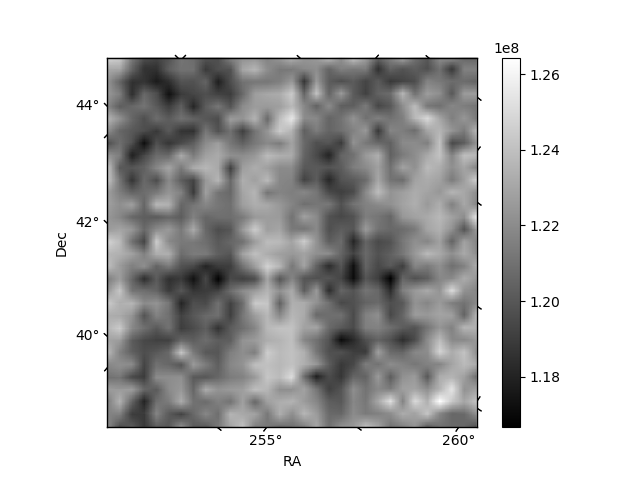
Histogram calculated using DETX and DETY for each event in the final _common_clean file
| Quadrant A | 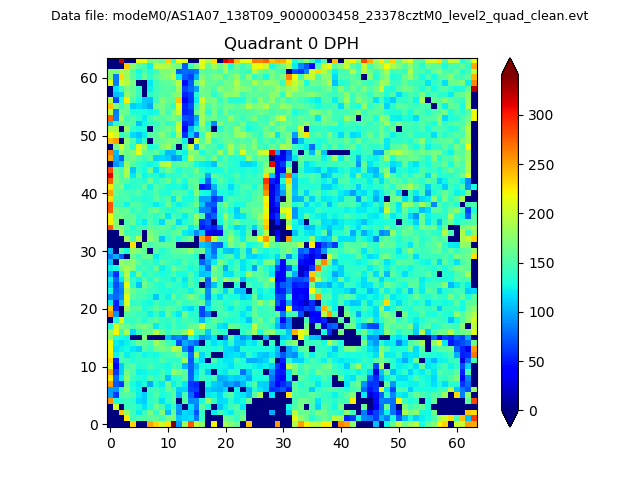 |
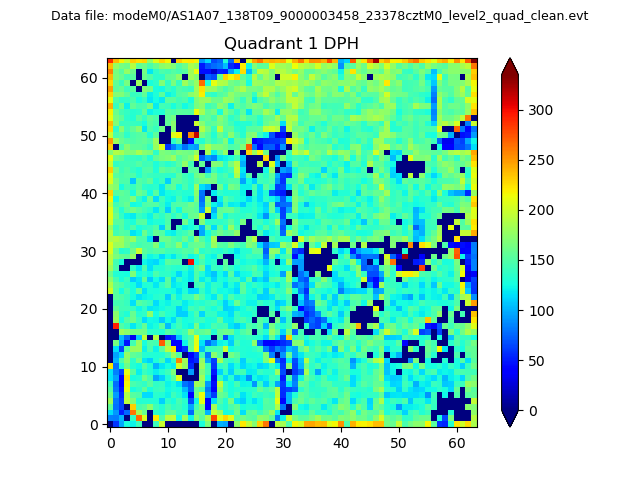 |
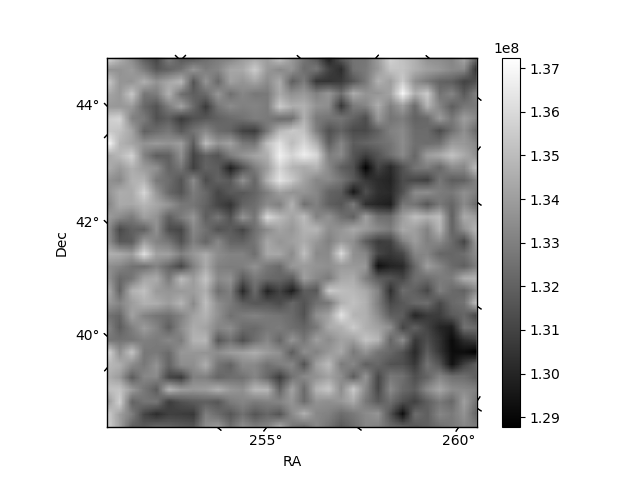
Quadrant B |
|---|---|---|---|
| Quadrant D | 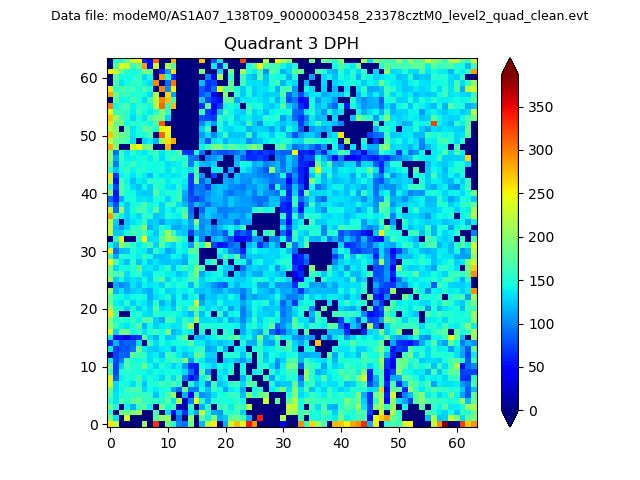 |
 |
Quadrant C |
| Plot type | Count rate plots | Images |
|---|---|---|
| Comparison with Poisson distribution Blue bars denote a histogram of data divided into 1 sec bins. Red curve is a Poisson curve with rate = median count rate of data. |
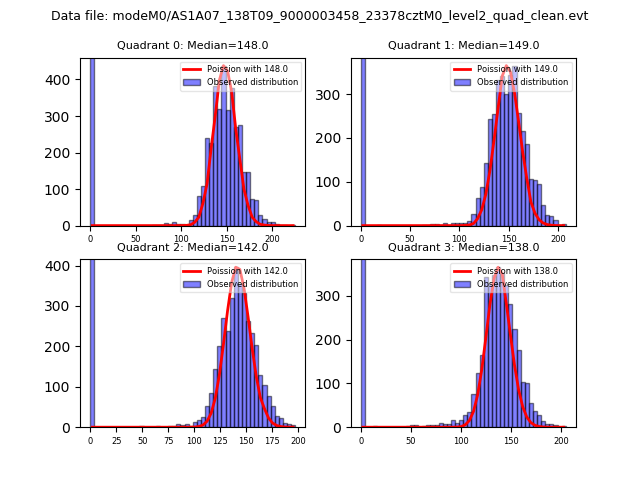 |
 |
| Quadrant-wise count rates Data is divided into 100 sec bins |
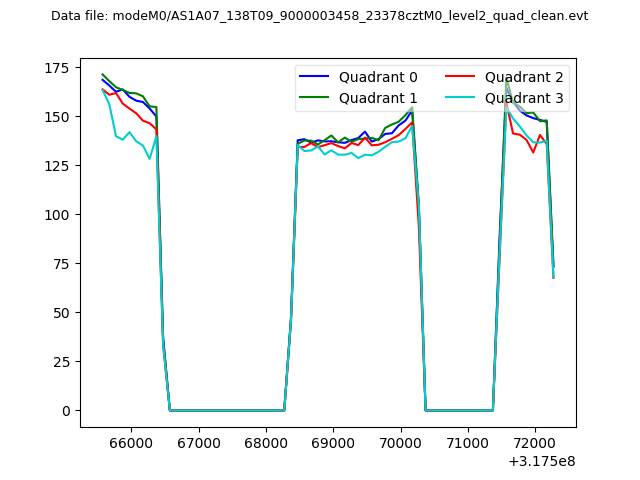 |
|
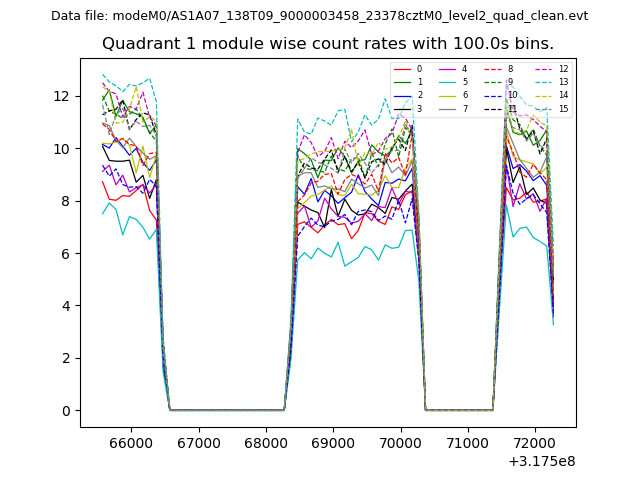
| Module-wise count rates for Quadrant A Data is divided into 100 sec bins |
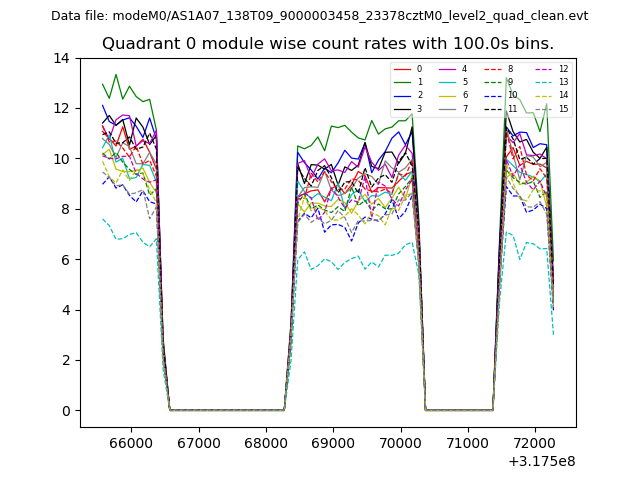 |
 |
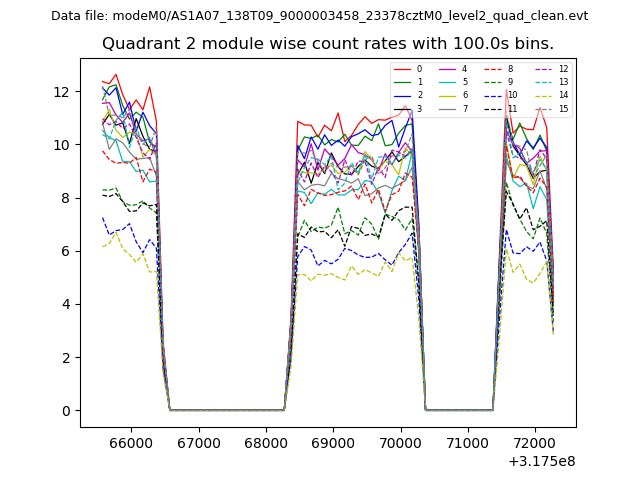
| Module-wise count rates for Quadrant B Data is divided into 100 sec bins |
 |
 |
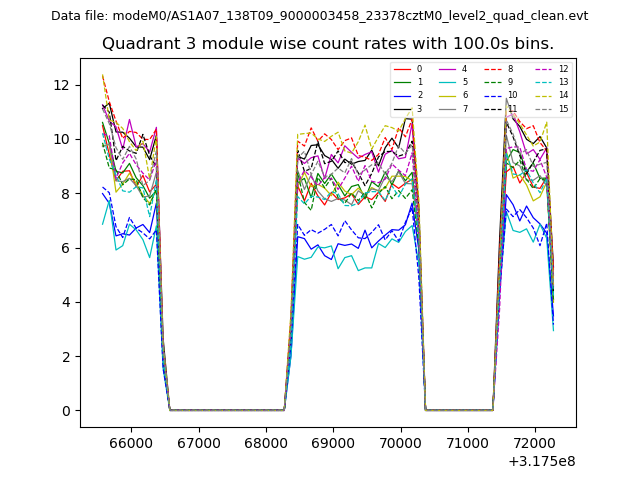
| Module-wise count rates for Quadrant C Data is divided into 100 sec bins |
 |
 |
| Module-wise count rates for Quadrant D Data is divided into 100 sec bins |
 |
 |
| Parameter | Plot |
|---|---|
| CZT HV Monitor | 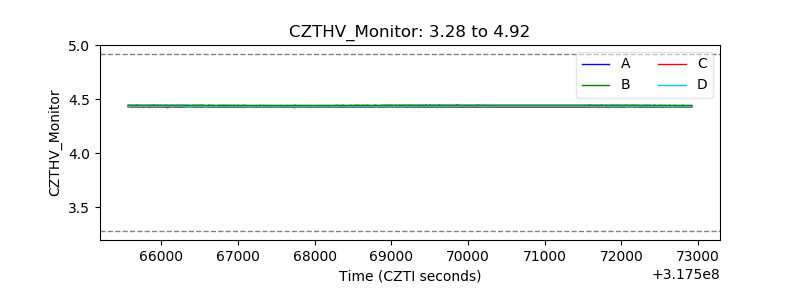 |
| D_VDD | 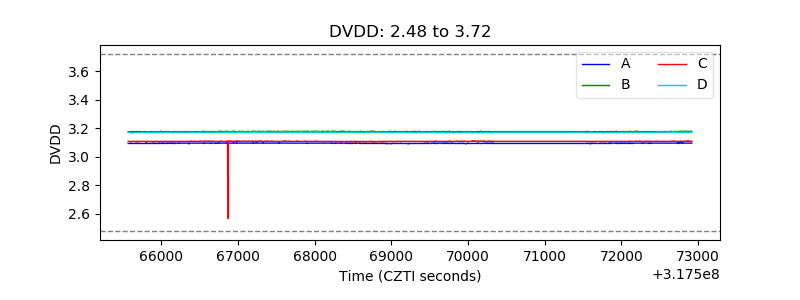 |
| Temperature 1 | 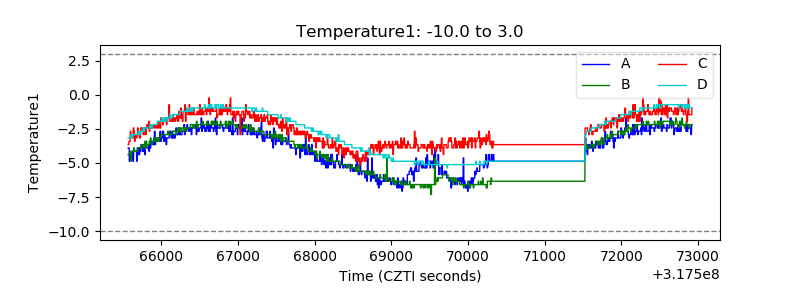 |
| Veto HV Monitor | 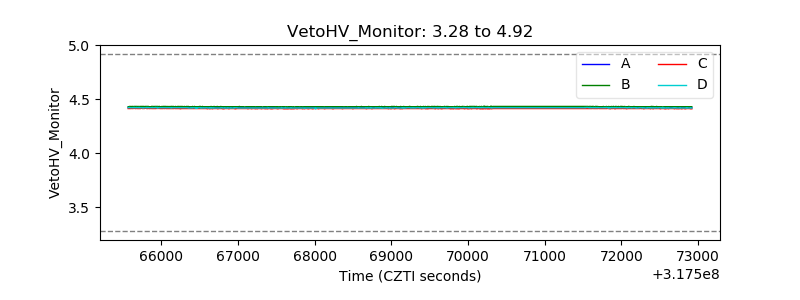 |
| Veto LLD |  |
| Alpha Counter | 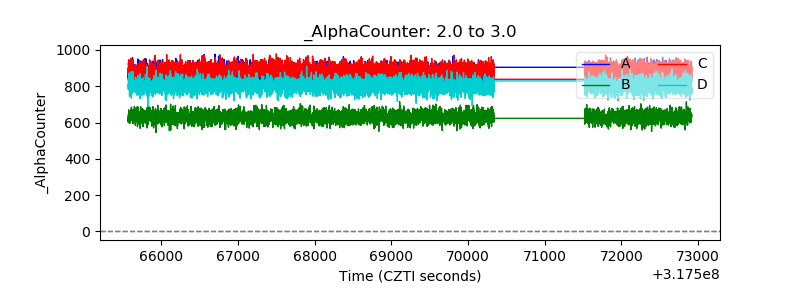 |
| _CPM_Rate | 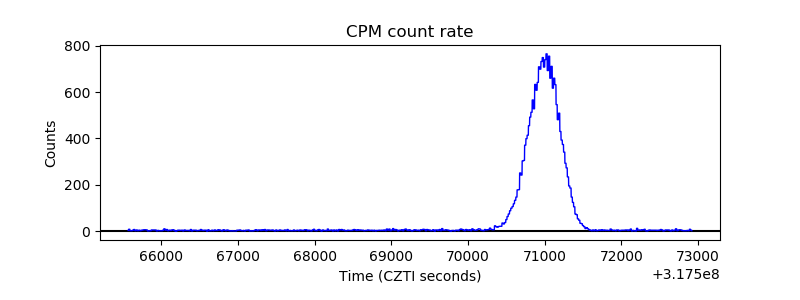 |
| CZT Counter | 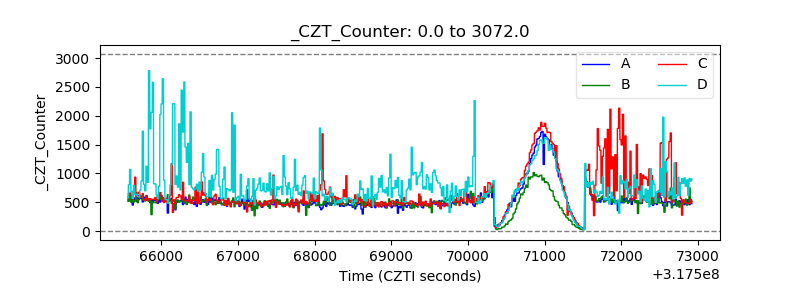 |
| +2.5 Volts monitor |  |
| +5 Volts monitor | 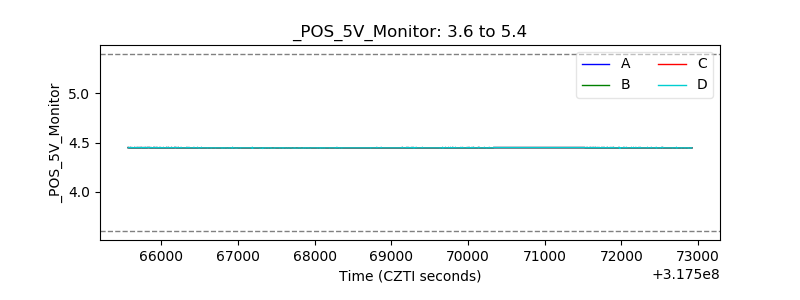 |
| _ROLL_ROT | 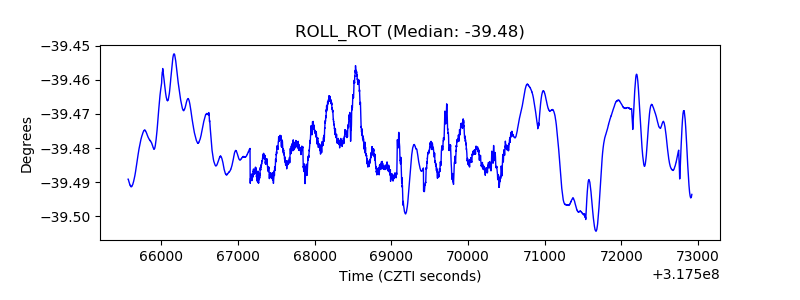 |
| _Roll_DEC | 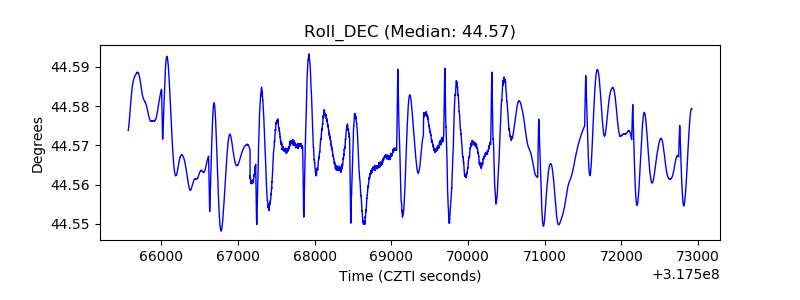 |
| _Roll_RA |  |
| Veto Counter | 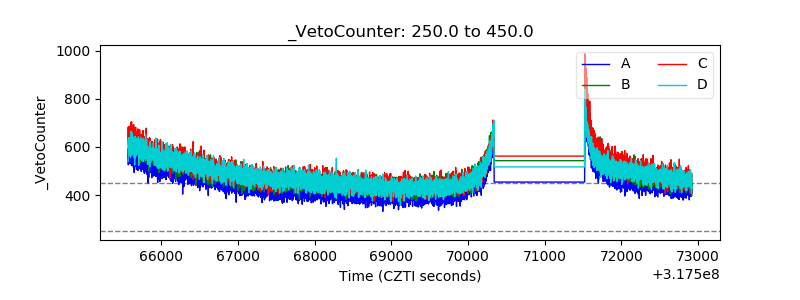 |