| Param | Original file | Final file |
|---|---|---|
| Filename | modeM0/AS1A07_138T09_9000003458_23380cztM0_level2.evt | modeM0/AS1A07_138T09_9000003458_23380cztM0_level2_quad_clean.evt |
| Size (bytes) | 967,207,680 | 135,881,280 |
| Size | 922.4 MB | 129.6 MB |
| Events in quadrant A | 5,604,237 | 840,288 |
| Events in quadrant B | 6,052,765 | 843,282 |
| Events in quadrant C | 8,596,422 | 801,258 |
| Events in quadrant D | 8,238,465 | 810,808 |
| Mode SS | |||
|---|---|---|---|
| Quadrant | BADHDUFLAG | Total packets | Discarded packets |
| A | 0 | 240 | 0 |
| B | 0 | 240 | 0 |
| C | 0 | 240 | 0 |
| D | 0 | 240 | 0 |
| Mode M9 | |||
|---|---|---|---|
| Quadrant | BADHDUFLAG | Total packets | Discarded packets |
| A | 0 | 14 | 0 |
| B | 0 | 14 | 0 |
| C | 0 | 14 | 0 |
| D | 0 | 14 | 0 |
| Mode M0 | |||
|---|---|---|---|
| Quadrant | BADHDUFLAG | Total packets | Discarded packets |
| A | 0 | 24263 | 4 |
| B | 0 | 25416 | 2 |
| C | 0 | 33071 | 2 |
| D | 0 | 32461 | 2 |
| Quadrant | Total seconds | Saturated seconds | Saturation percentage |
|---|---|---|---|
| A | 11845 | 103 | 0.869565% |
| B | 11847 | 204 | 1.721955% |
| C | 11847 | 478 | 4.034777% |
| D | 11847 | 536 | 4.524352% |
Noise dominated data is calculated using 1-second bins in cleaned event files. If a bin has >2000 counts, and if more than 50% of those come from <1% of pixels, then it is considered to be noise-dominated and hence unusable.
| Quadrant | # 1 sec bins | Bins with >0 counts | Bins with >2000 counts | High rate bins dominated by noise | Noise dominated (total time) | Noise dominated (detector-on time) | Marked lightcurve |
|---|---|---|---|---|---|---|---|
| A | 13226 | 11847 | 0 | 0 | 0.00% | 0.00% | 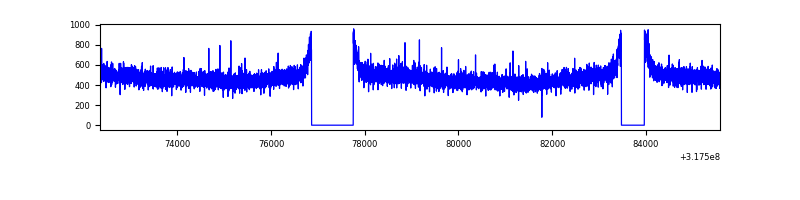 |
| B | 13227 | 11849 | 35 | 35 | 0.26% | 0.30% | 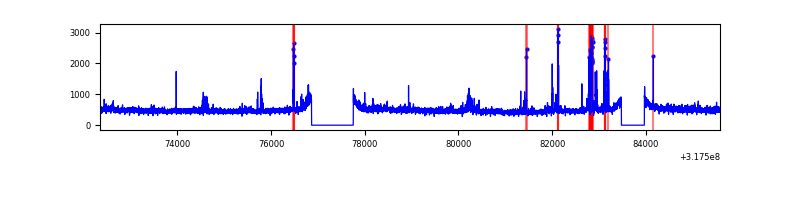 |
| C | 13227 | 11848 | 52 | 52 | 0.39% | 0.44% | 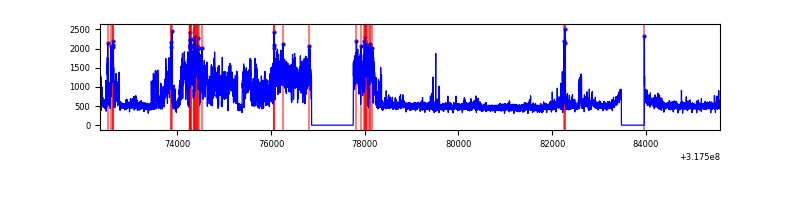 |
| D | 13227 | 11848 | 406 | 406 | 3.07% | 3.43% | 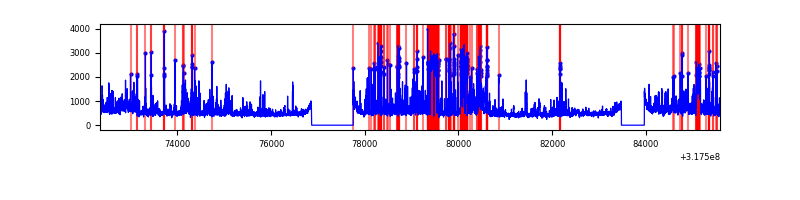 |
Top three noisy pixels from each quadrant. If the there are fewer than three noisy pixels in the level2.evt file, extra rows are filled as -1
| Pixel properties | Quadrant properties | ||||||
|---|---|---|---|---|---|---|---|
| Quadrant | DetID | PixID | Counts | Sigma | Mean | Median | Sigma |
| A | 13 | 254 | 18524 | 59.15 | 1454 | 1423 | 289.1 |
| A | 3 | 137 | 12796 | 39.34 | 1454 | 1423 | 289.1 |
| A | 0 | 226 | 12445 | 38.12 | 1454 | 1423 | 289.1 |
| B | 0 | 189 | 357334 | 1300.66 | 1439 | 1403 | 273.7 |
| B | 0 | 229 | 41274 | 145.7 | 1439 | 1403 | 273.7 |
| B | 0 | 190 | 33956 | 118.96 | 1439 | 1403 | 273.7 |
| C | 0 | 239 | 2780214 | 8696.67 | 1385 | 1395 | 319.5 |
| C | 14 | 238 | 218121 | 678.27 | 1385 | 1395 | 319.5 |
| C | 7 | 247 | 81715 | 251.37 | 1385 | 1395 | 319.5 |
| D | 1 | 52 | 2703077 | 7974.74 | 1404 | 1366 | 338.8 |
| D | 7 | 238 | 81680 | 237.07 | 1404 | 1366 | 338.8 |
| D | 13 | 104 | 52620 | 151.29 | 1404 | 1366 | 338.8 |
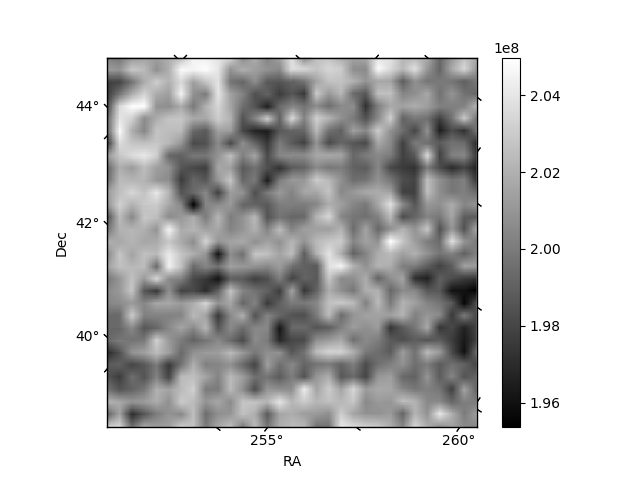
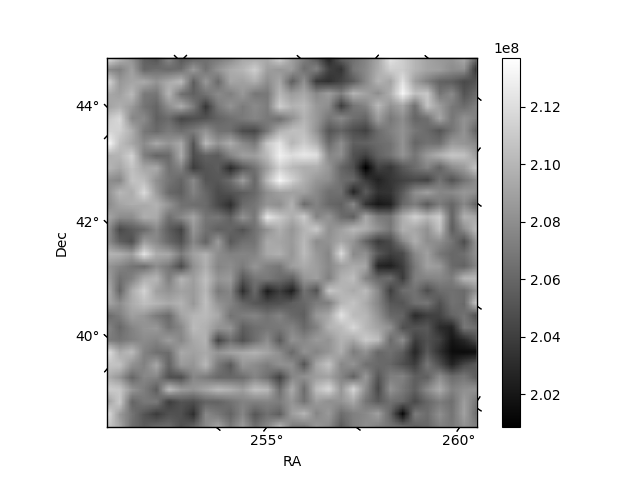
Histogram calculated using DETX and DETY for each event in the final _common_clean file
| Quadrant A |  |
 |
Quadrant B |
|---|---|---|---|
| Quadrant D |  |
 |
Quadrant C |
| Plot type | Count rate plots | Images |
|---|---|---|
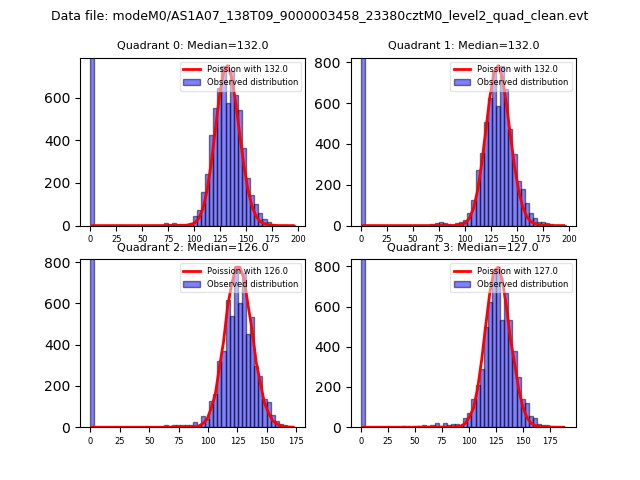
| Comparison with Poisson distribution Blue bars denote a histogram of data divided into 1 sec bins. Red curve is a Poisson curve with rate = median count rate of data. |
 |
 |
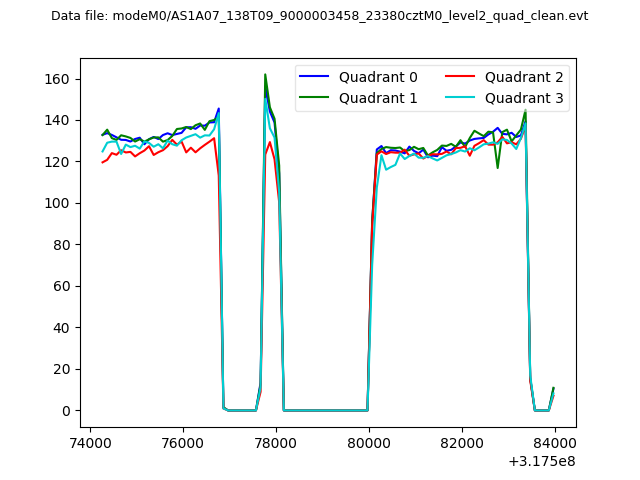
| Quadrant-wise count rates Data is divided into 100 sec bins |
 |
|
| Module-wise count rates for Quadrant A Data is divided into 100 sec bins |
 |
 |
| Module-wise count rates for Quadrant B Data is divided into 100 sec bins |
 |
 |
| Module-wise count rates for Quadrant C Data is divided into 100 sec bins |
 |
 |
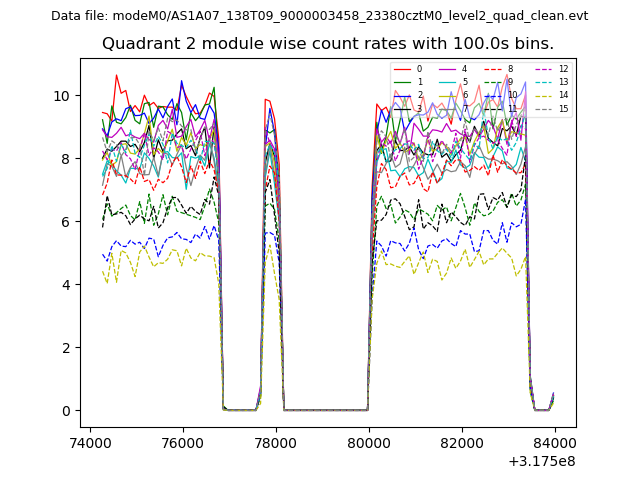
| Module-wise count rates for Quadrant D Data is divided into 100 sec bins |
 |
 |
| Parameter | Plot |
|---|---|
| CZT HV Monitor |  |
| D_VDD |  |
| Temperature 1 |  |
| Veto HV Monitor |  |
| Veto LLD |  |
| Alpha Counter | 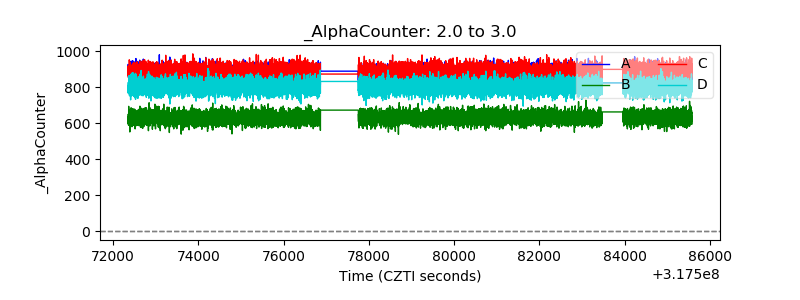 |
| _CPM_Rate | 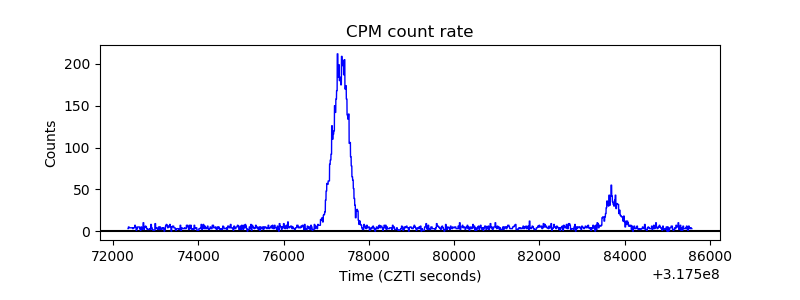 |
| CZT Counter |  |
| +2.5 Volts monitor |  |
| +5 Volts monitor |  |
| _ROLL_ROT |  |
| _Roll_DEC |  |
| _Roll_RA |  |
| Veto Counter |  |