| Param | Original file | Final file |
|---|---|---|
| Filename | modeM0/AS1A07_138T09_9000003458_23381cztM0_level2.evt | modeM0/AS1A07_138T09_9000003458_23381cztM0_level2_quad_clean.evt |
| Size (bytes) | 570,006,720 | 83,142,720 |
| Size | 543.6 MB | 79.3 MB |
| Events in quadrant A | 3,630,460 | 502,465 |
| Events in quadrant B | 3,871,386 | 505,213 |
| Events in quadrant C | 4,288,364 | 488,759 |
| Events in quadrant D | 4,953,162 | 488,466 |
| Mode SS | |||
|---|---|---|---|
| Quadrant | BADHDUFLAG | Total packets | Discarded packets |
| A | 0 | 156 | 0 |
| B | 0 | 156 | 0 |
| C | 0 | 156 | 0 |
| D | 0 | 156 | 0 |
| Mode M9 | |||
|---|---|---|---|
| Quadrant | BADHDUFLAG | Total packets | Discarded packets |
| A | 0 | 3 | 0 |
| B | 0 | 4 | 0 |
| C | 0 | 4 | 0 |
| D | 0 | 4 | 0 |
| Mode M0 | |||
|---|---|---|---|
| Quadrant | BADHDUFLAG | Total packets | Discarded packets |
| A | 0 | 15822 | 3 |
| B | 0 | 16406 | 3 |
| C | 0 | 17673 | 4 |
| D | 0 | 20002 | 3 |
| Quadrant | Total seconds | Saturated seconds | Saturation percentage |
|---|---|---|---|
| A | 7656 | 76 | 0.992685% |
| B | 7656 | 136 | 1.776385% |
| C | 7655 | 183 | 2.390594% |
| D | 7655 | 256 | 3.344219% |
Noise dominated data is calculated using 1-second bins in cleaned event files. If a bin has >2000 counts, and if more than 50% of those come from <1% of pixels, then it is considered to be noise-dominated and hence unusable.
| Quadrant | # 1 sec bins | Bins with >0 counts | Bins with >2000 counts | High rate bins dominated by noise | Noise dominated (total time) | Noise dominated (detector-on time) | Marked lightcurve |
|---|---|---|---|---|---|---|---|
| A | 7896 | 7658 | 0 | 0 | 0.00% | 0.00% | 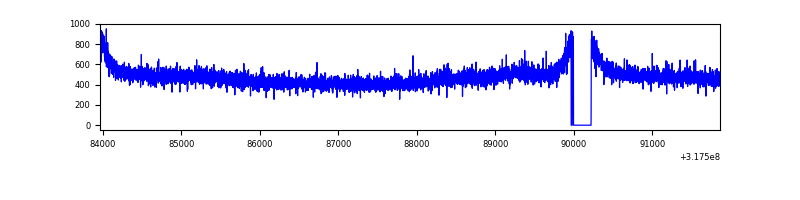 |
| B | 7896 | 7658 | 1 | 1 | 0.01% | 0.01% | 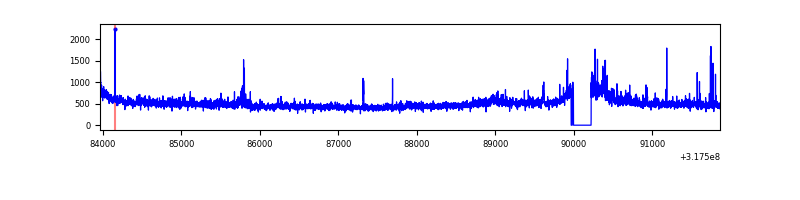 |
| C | 7895 | 7656 | 1 | 1 | 0.01% | 0.01% | 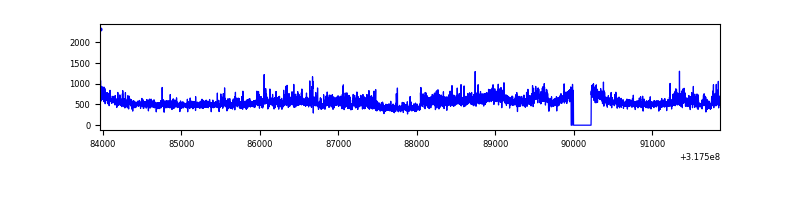 |
| D | 7895 | 7656 | 107 | 107 | 1.36% | 1.40% | 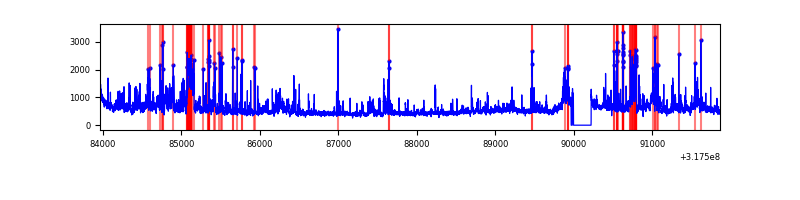 |
Top three noisy pixels from each quadrant. If the there are fewer than three noisy pixels in the level2.evt file, extra rows are filled as -1
| Pixel properties | Quadrant properties | ||||||
|---|---|---|---|---|---|---|---|
| Quadrant | DetID | PixID | Counts | Sigma | Mean | Median | Sigma |
| A | 13 | 254 | 11595 | 56.27 | 941 | 921 | 189.7 |
| A | 3 | 137 | 8562 | 40.28 | 941 | 921 | 189.7 |
| A | 0 | 226 | 8042 | 37.54 | 941 | 921 | 189.7 |
| B | 0 | 189 | 170435 | 950.88 | 930 | 903 | 178.3 |
| B | 0 | 190 | 37272 | 203.99 | 930 | 903 | 178.3 |
| B | 12 | 111 | 21532 | 115.71 | 930 | 903 | 178.3 |
| C | 0 | 239 | 585031 | 2761.61 | 903 | 908 | 211.5 |
| C | 14 | 238 | 143880 | 675.94 | 903 | 908 | 211.5 |
| C | 7 | 247 | 13258 | 58.39 | 903 | 908 | 211.5 |
| D | 1 | 52 | 1306959 | 5832.59 | 917 | 888 | 223.9 |
| D | 13 | 104 | 50624 | 222.11 | 917 | 888 | 223.9 |
| D | 7 | 238 | 50243 | 220.41 | 917 | 888 | 223.9 |
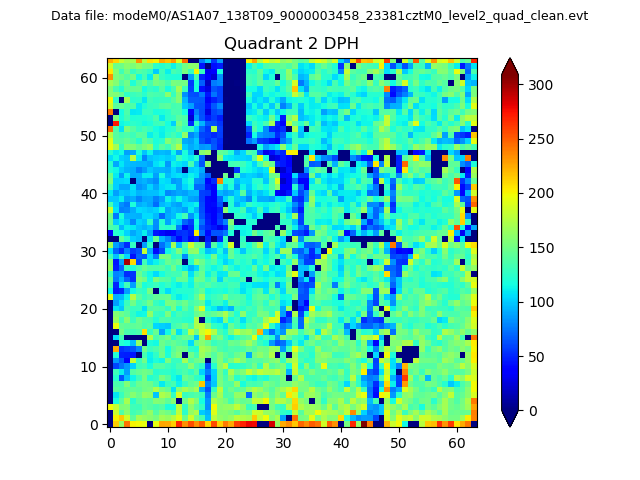
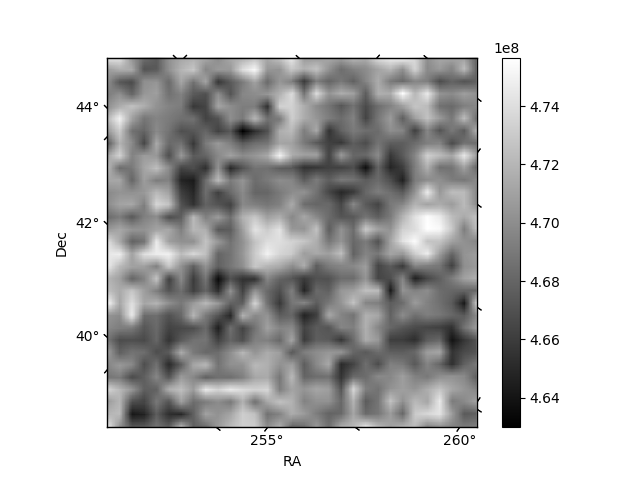
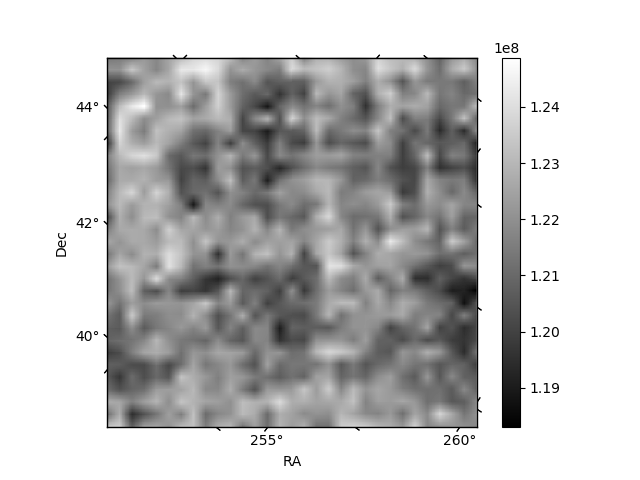
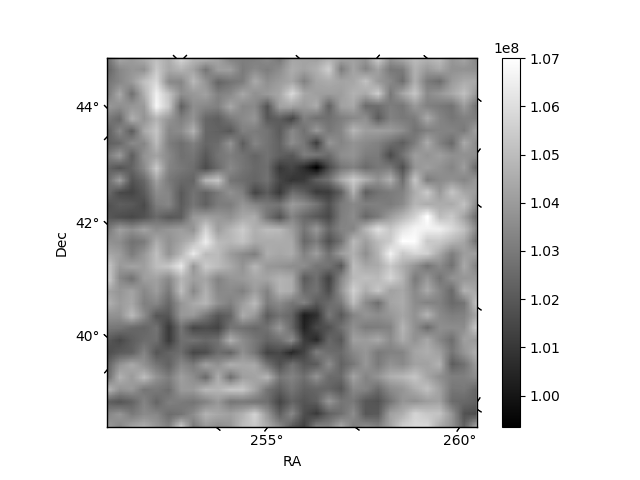
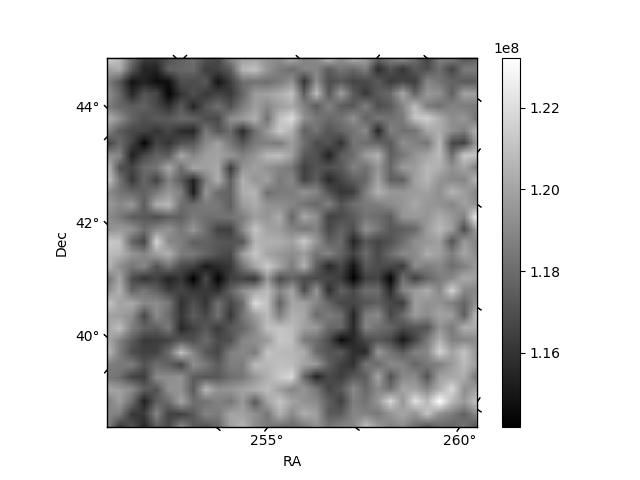
Histogram calculated using DETX and DETY for each event in the final _common_clean file
| Quadrant A | 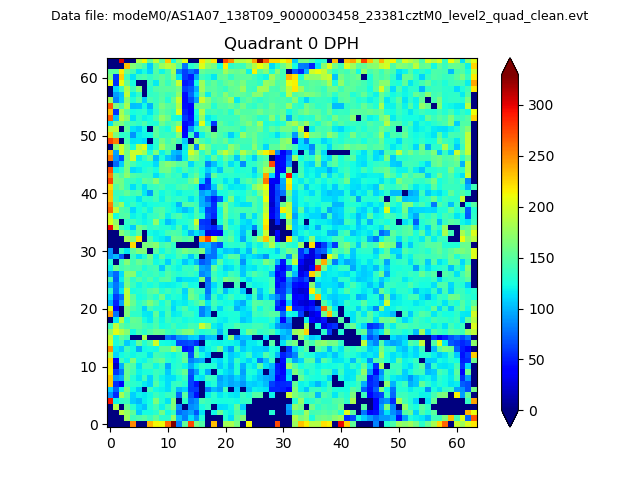 |
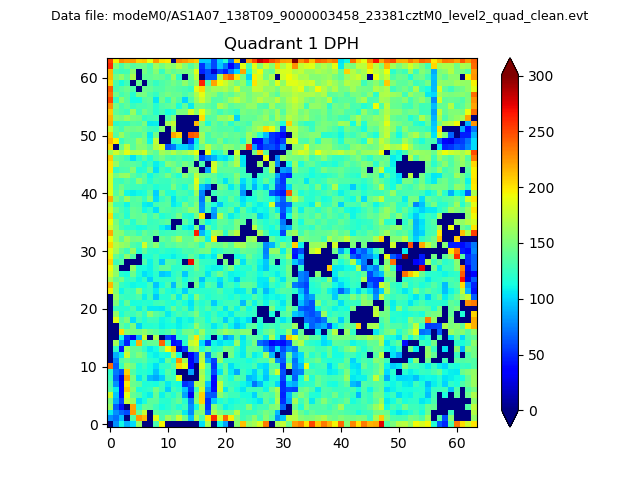 |
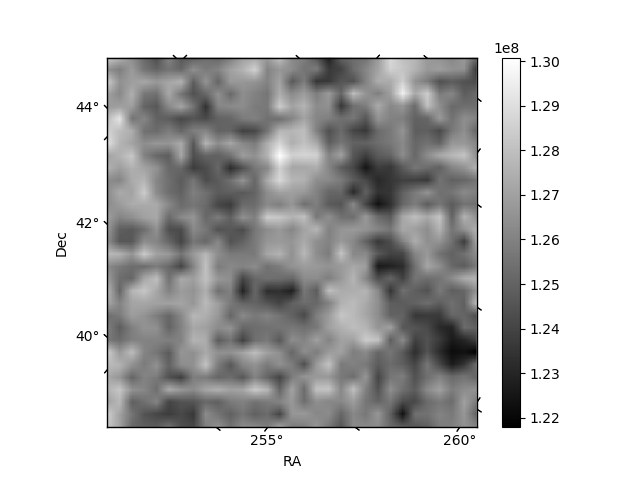
Quadrant B |
|---|---|---|---|
| Quadrant D | 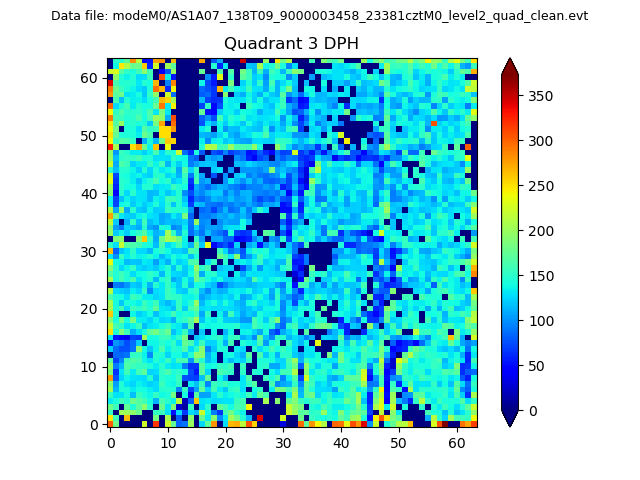 |
 |
Quadrant C |
| Plot type | Count rate plots | Images |
|---|---|---|
| Comparison with Poisson distribution Blue bars denote a histogram of data divided into 1 sec bins. Red curve is a Poisson curve with rate = median count rate of data. |
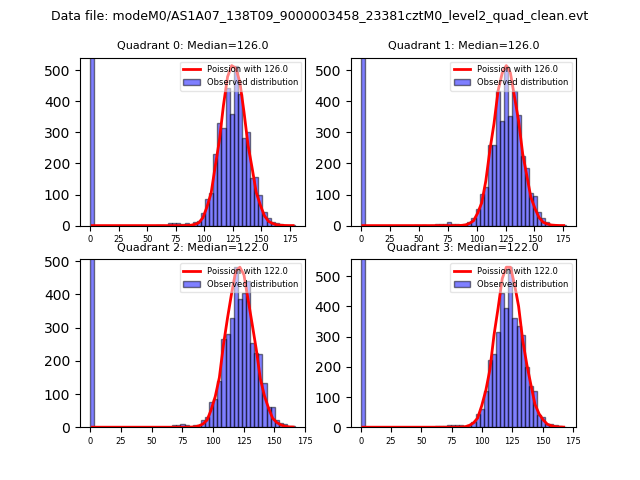 |
 |
| Quadrant-wise count rates Data is divided into 100 sec bins |
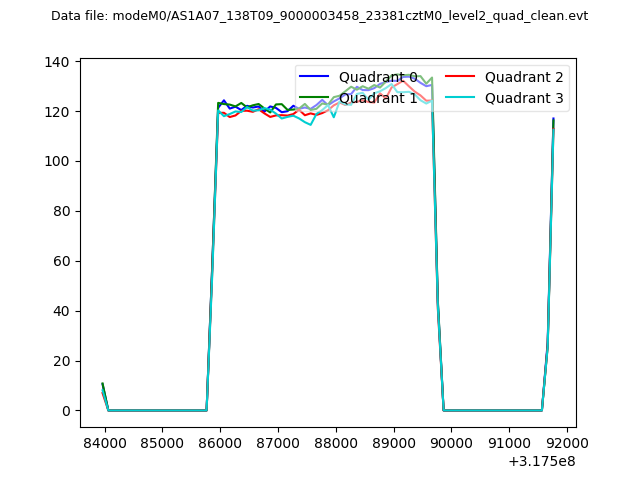 |
|
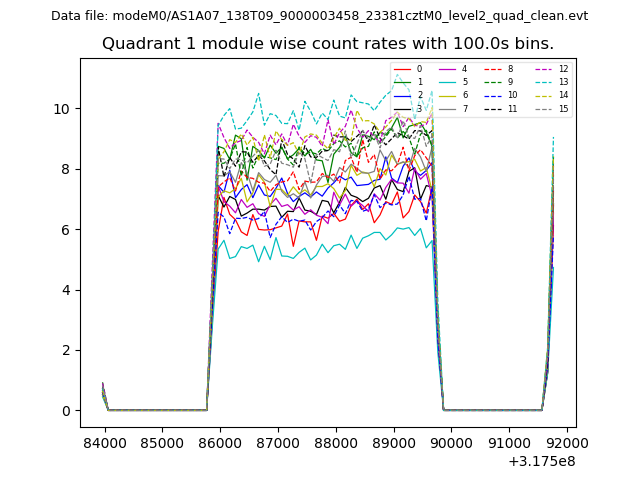
| Module-wise count rates for Quadrant A Data is divided into 100 sec bins |
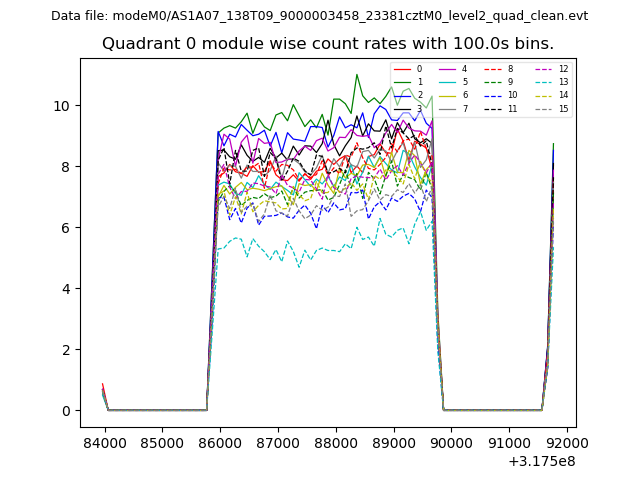 |
 |
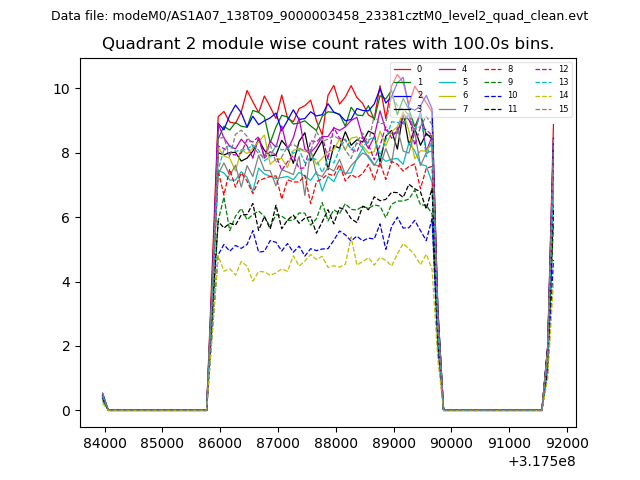
| Module-wise count rates for Quadrant B Data is divided into 100 sec bins |
 |
 |
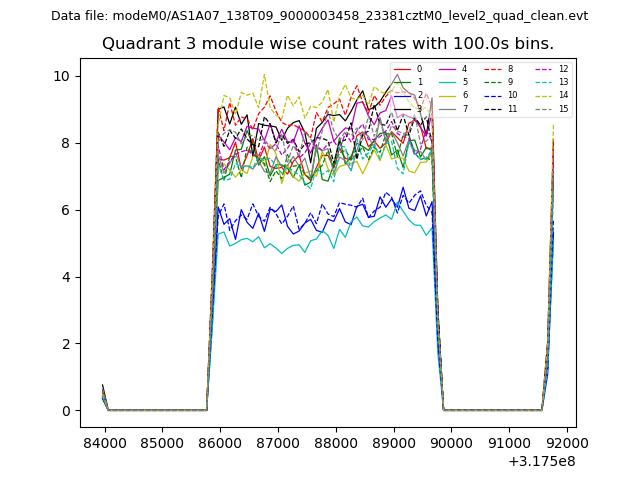
| Module-wise count rates for Quadrant C Data is divided into 100 sec bins |
 |
 |
| Module-wise count rates for Quadrant D Data is divided into 100 sec bins |
 |
 |
| Parameter | Plot |
|---|---|
| CZT HV Monitor | 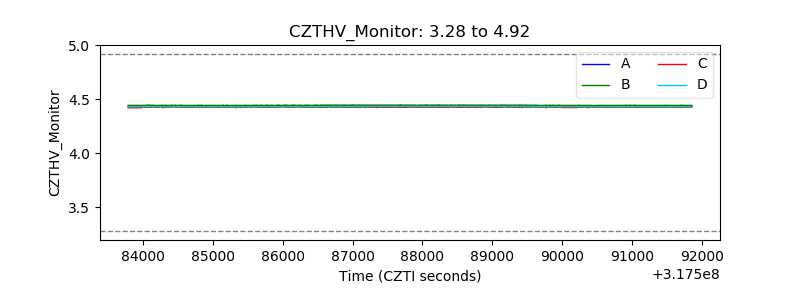 |
| D_VDD | 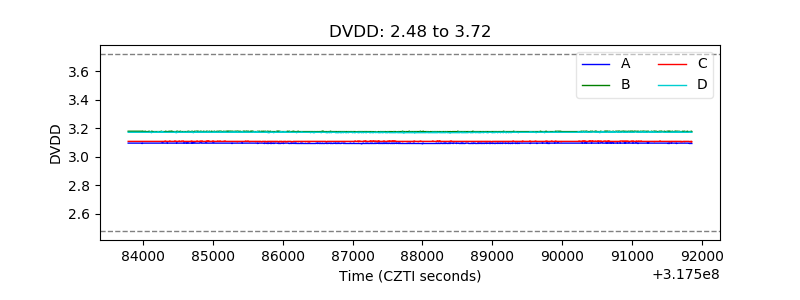 |
| Temperature 1 | 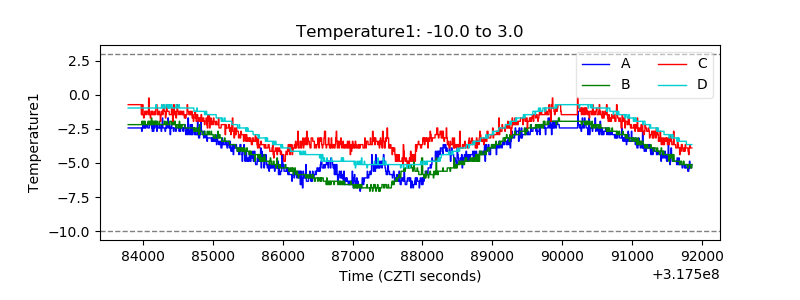 |
| Veto HV Monitor | 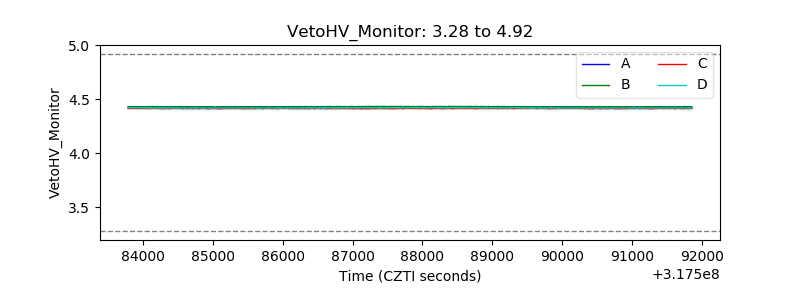 |
| Veto LLD | 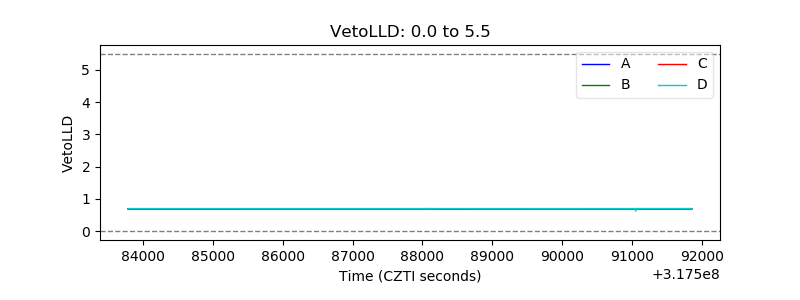 |
| Alpha Counter | 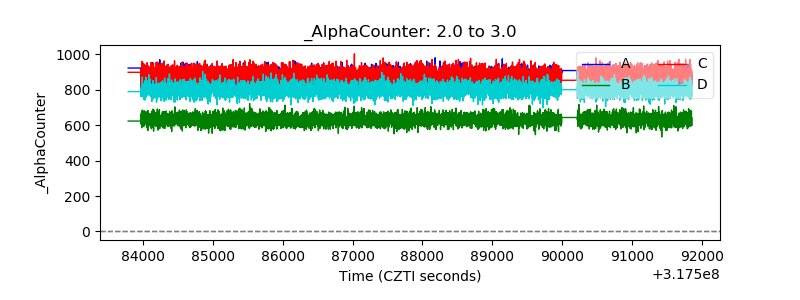 |
| _CPM_Rate | 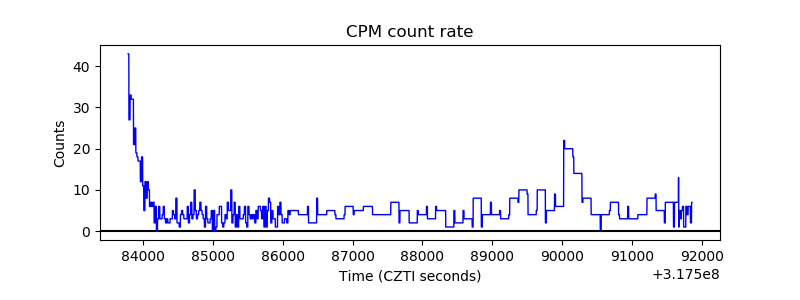 |
| CZT Counter | 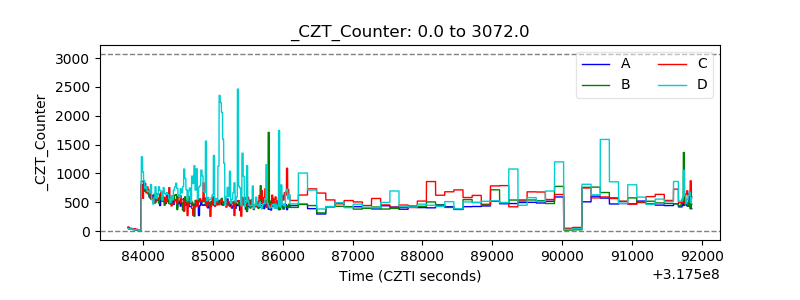 |
| +2.5 Volts monitor |  |
| +5 Volts monitor |  |
| _ROLL_ROT | 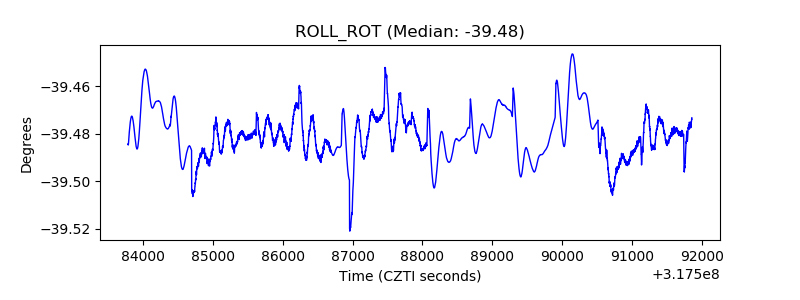 |
| _Roll_DEC |  |
| _Roll_RA | 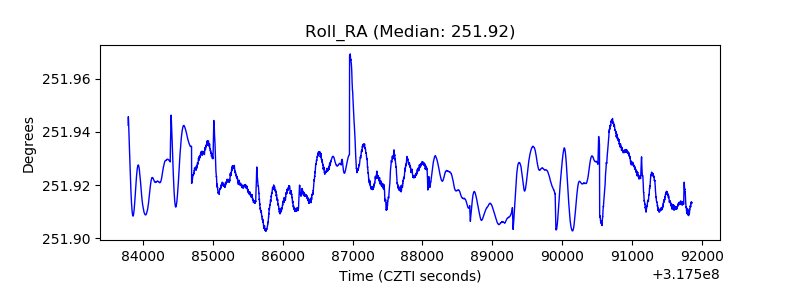 |
| Veto Counter | 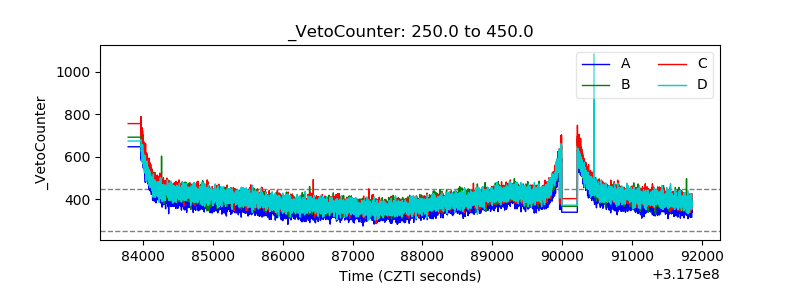 |