| Param | Original file | Final file |
|---|---|---|
| Filename | modeM0/AS1A07_138T09_9000003458_23385cztM0_level2.evt | modeM0/AS1A07_138T09_9000003458_23385cztM0_level2_quad_clean.evt |
| Size (bytes) | 1,203,042,240 | 248,022,720 |
| Size | 1.1 GB | 236.5 MB |
| Events in quadrant A | 8,122,084 | 1,588,535 |
| Events in quadrant B | 8,827,883 | 1,608,005 |
| Events in quadrant C | 8,743,242 | 1,564,492 |
| Events in quadrant D | 9,554,850 | 1,542,041 |
| Mode SS | |||
|---|---|---|---|
| Quadrant | BADHDUFLAG | Total packets | Discarded packets |
| A | 0 | 356 | 0 |
| B | 0 | 356 | 0 |
| C | 0 | 356 | 0 |
| D | 0 | 356 | 0 |
| Mode M9 | |||
|---|---|---|---|
| Quadrant | BADHDUFLAG | Total packets | Discarded packets |
| A | 0 | 22 | 0 |
| B | 0 | 22 | 0 |
| C | 0 | 22 | 0 |
| D | 0 | 22 | 0 |
| Mode M0 | |||
|---|---|---|---|
| Quadrant | BADHDUFLAG | Total packets | Discarded packets |
| A | 0 | 36221 | 115 |
| B | 0 | 37998 | 117 |
| C | 0 | 37733 | 119 |
| D | 0 | 40702 | 128 |
| Quadrant | Total seconds | Saturated seconds | Saturation percentage |
|---|---|---|---|
| A | 17547 | 79 | 0.450219% |
| B | 17544 | 252 | 1.436389% |
| C | 17545 | 151 | 0.860644% |
| D | 17541 | 232 | 1.322616% |
Noise dominated data is calculated using 1-second bins in cleaned event files. If a bin has >2000 counts, and if more than 50% of those come from <1% of pixels, then it is considered to be noise-dominated and hence unusable.
| Quadrant | # 1 sec bins | Bins with >0 counts | Bins with >2000 counts | High rate bins dominated by noise | Noise dominated (total time) | Noise dominated (detector-on time) | Marked lightcurve |
|---|---|---|---|---|---|---|---|
| A | 19783 | 17575 | 31 | 31 | 0.16% | 0.18% | 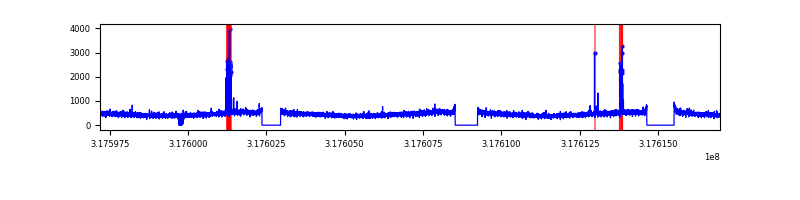 |
| B | 19783 | 17562 | 140 | 140 | 0.71% | 0.80% | 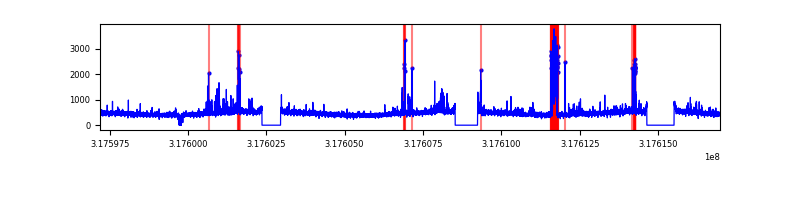 |
| C | 19783 | 17566 | 1 | 1 | 0.01% | 0.01% | 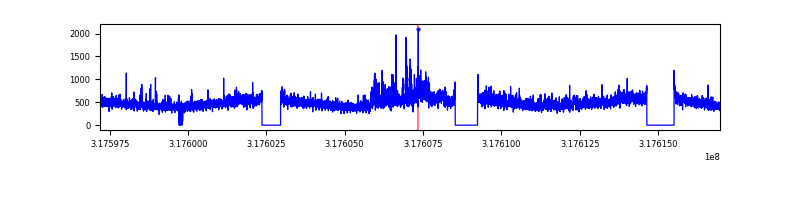 |
| D | 19783 | 17563 | 167 | 167 | 0.84% | 0.95% | 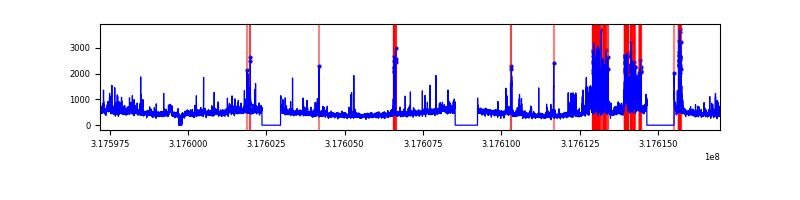 |
Top three noisy pixels from each quadrant. If the there are fewer than three noisy pixels in the level2.evt file, extra rows are filled as -1
| Pixel properties | Quadrant properties | ||||||
|---|---|---|---|---|---|---|---|
| Quadrant | DetID | PixID | Counts | Sigma | Mean | Median | Sigma |
| A | 15 | 174 | 179672 | 429.72 | 2061 | 2020 | 413.4 |
| A | 13 | 254 | 25059 | 55.73 | 2061 | 2020 | 413.4 |
| A | 3 | 137 | 18802 | 40.59 | 2061 | 2020 | 413.4 |
| B | 0 | 229 | 391858 | 1005.76 | 2046 | 1992 | 387.6 |
| B | 0 | 189 | 267913 | 686.02 | 2046 | 1992 | 387.6 |
| B | 0 | 190 | 81657 | 205.52 | 2046 | 1992 | 387.6 |
| C | 10 | 9 | 587786 | 1273.58 | 1981 | 1992 | 460.0 |
| C | 14 | 238 | 317211 | 685.32 | 1981 | 1992 | 460.0 |
| C | 7 | 247 | 89365 | 189.96 | 1981 | 1992 | 460.0 |
| D | 1 | 52 | 1301596 | 2701.19 | 1999 | 1944 | 481.1 |
| D | 7 | 238 | 418092 | 864.92 | 1999 | 1944 | 481.1 |
| D | 13 | 174 | 180311 | 370.72 | 1999 | 1944 | 481.1 |
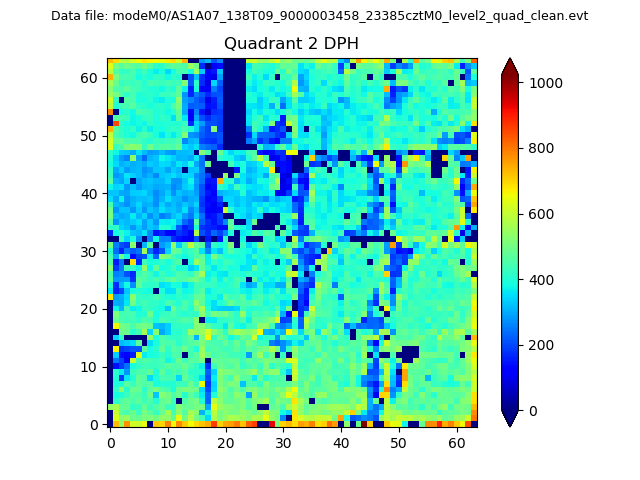
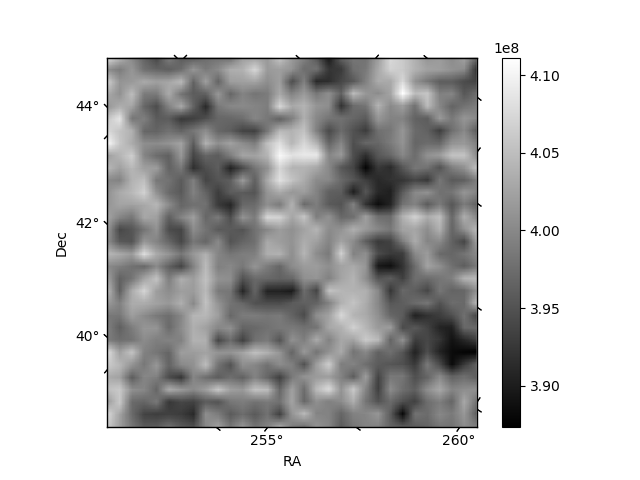
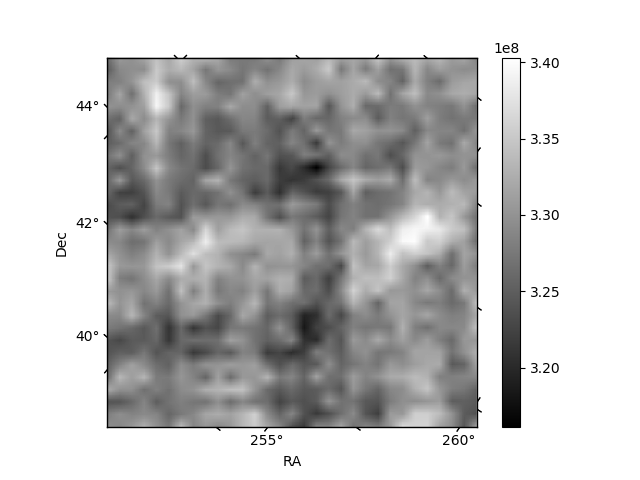
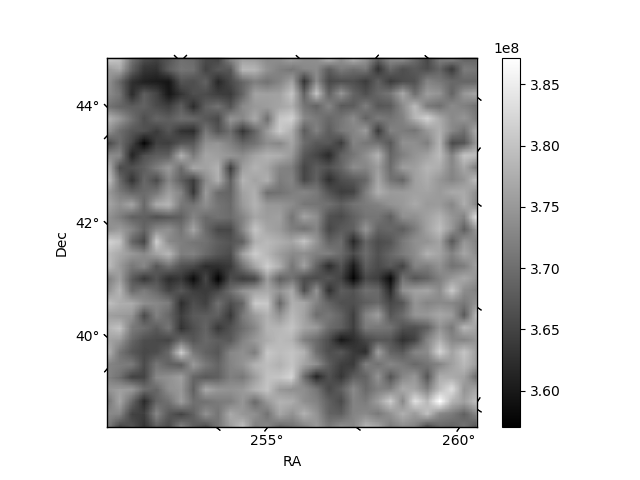
Histogram calculated using DETX and DETY for each event in the final _common_clean file
| Quadrant A | 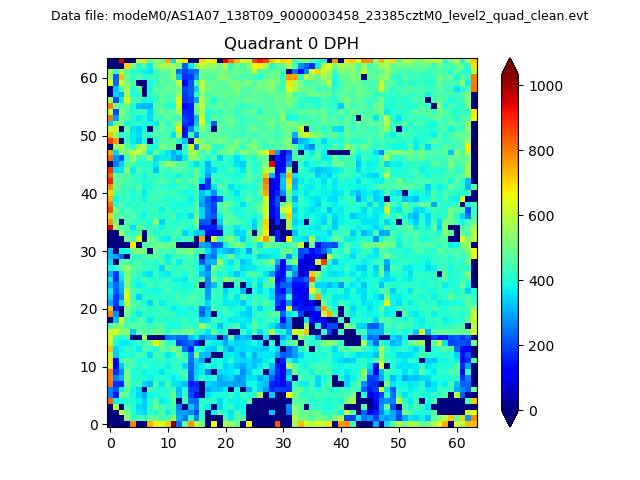 |
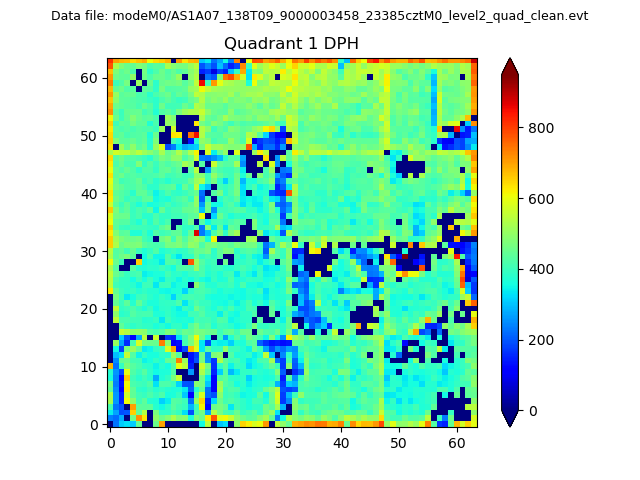 |
Quadrant B |
|---|---|---|---|
| Quadrant D | 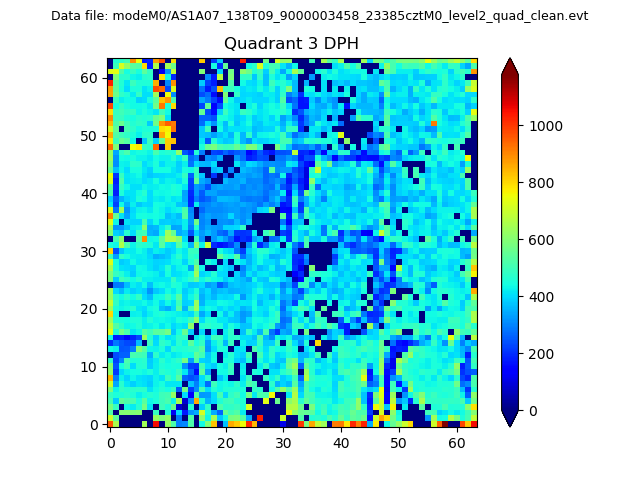 |
 |
Quadrant C |
| Plot type | Count rate plots | Images |
|---|---|---|
| Comparison with Poisson distribution Blue bars denote a histogram of data divided into 1 sec bins. Red curve is a Poisson curve with rate = median count rate of data. |
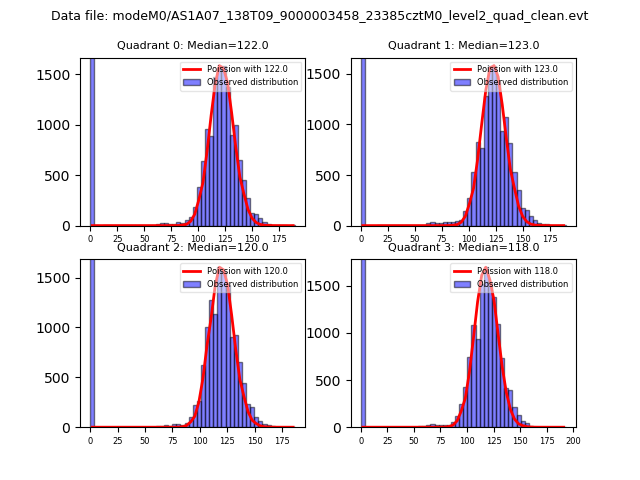 |
 |
| Quadrant-wise count rates Data is divided into 100 sec bins |
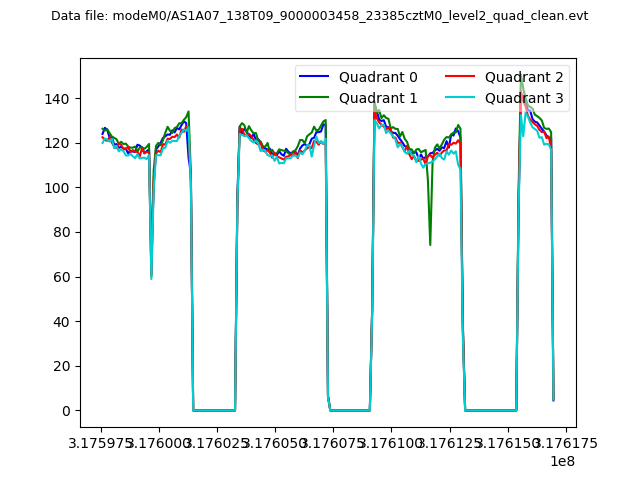 |
|
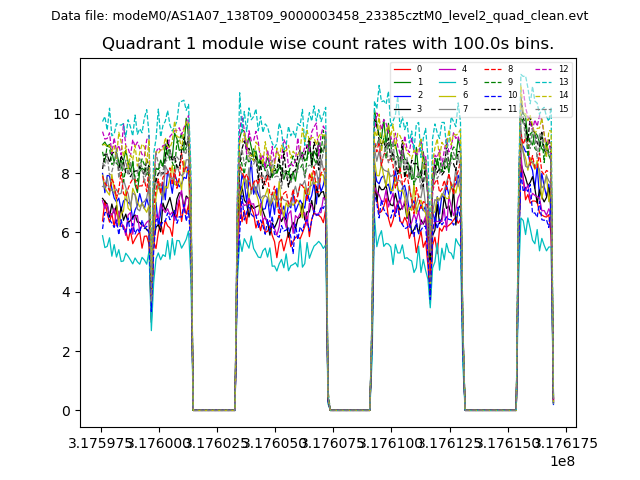
| Module-wise count rates for Quadrant A Data is divided into 100 sec bins |
 |
 |
| Module-wise count rates for Quadrant B Data is divided into 100 sec bins |
 |
 |
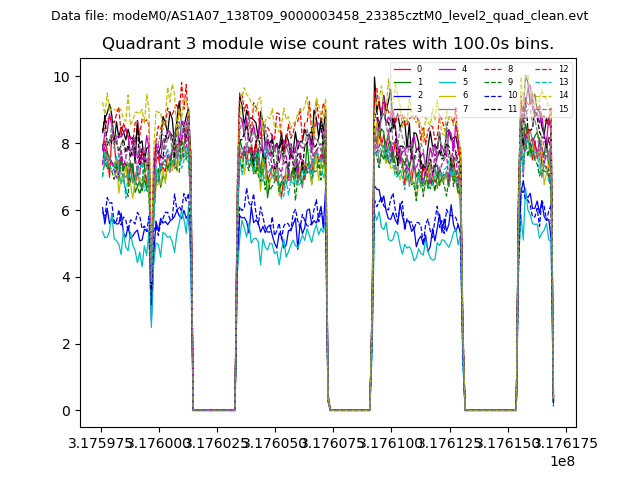
| Module-wise count rates for Quadrant C Data is divided into 100 sec bins |
 |
 |
| Module-wise count rates for Quadrant D Data is divided into 100 sec bins |
 |
 |
| Parameter | Plot |
|---|---|
| CZT HV Monitor | 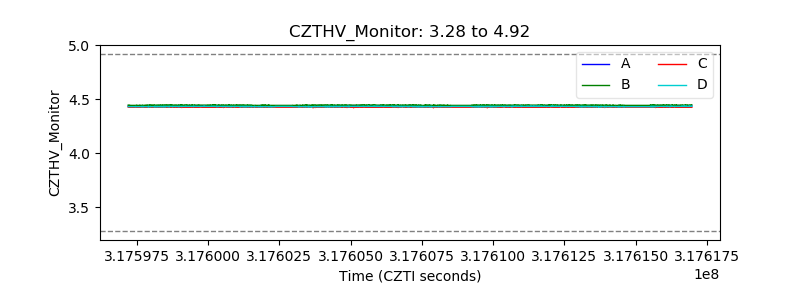 |
| D_VDD |  |
| Temperature 1 | 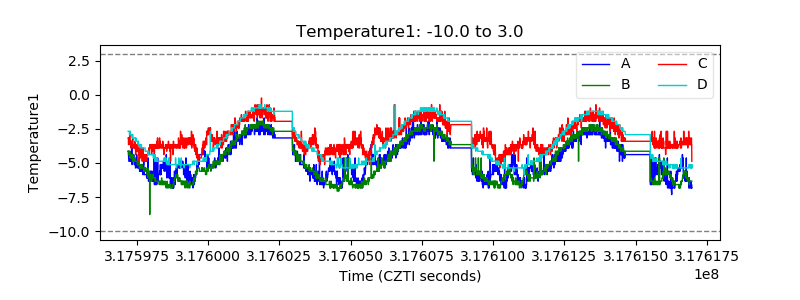 |
| Veto HV Monitor |  |
| Veto LLD |  |
| Alpha Counter | 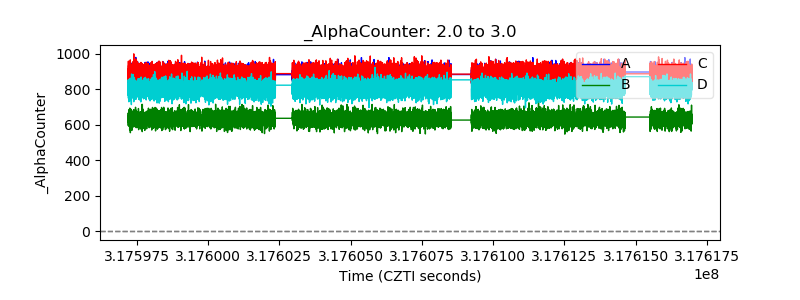 |
| _CPM_Rate | 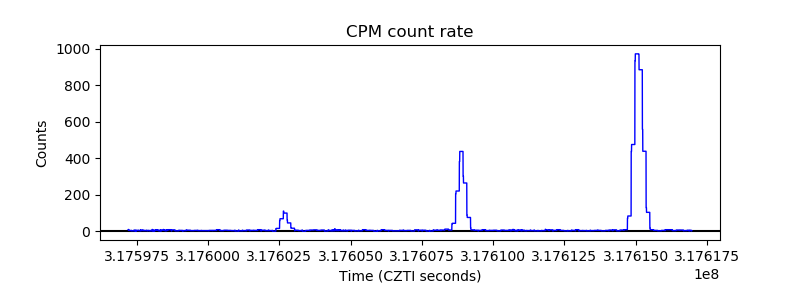 |
| CZT Counter | 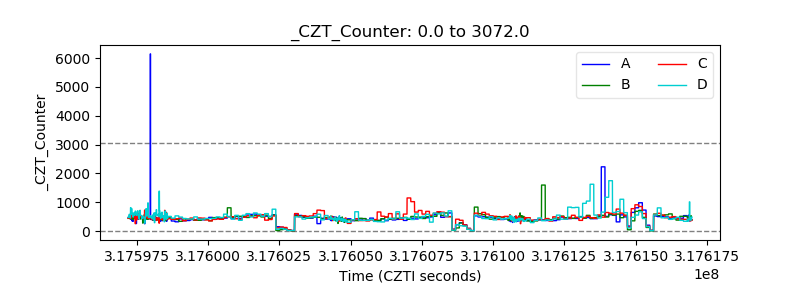 |
| +2.5 Volts monitor |  |
| +5 Volts monitor |  |
| _ROLL_ROT | 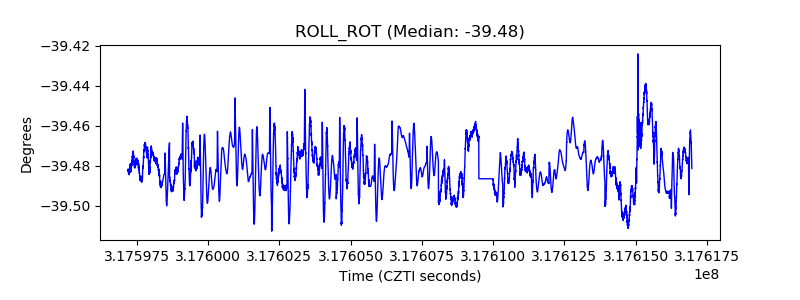 |
| _Roll_DEC | 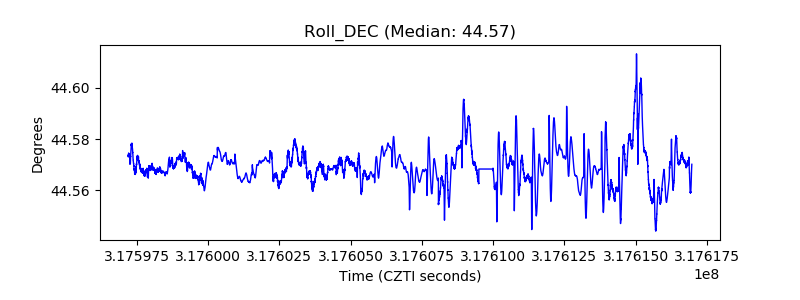 |
| _Roll_RA | 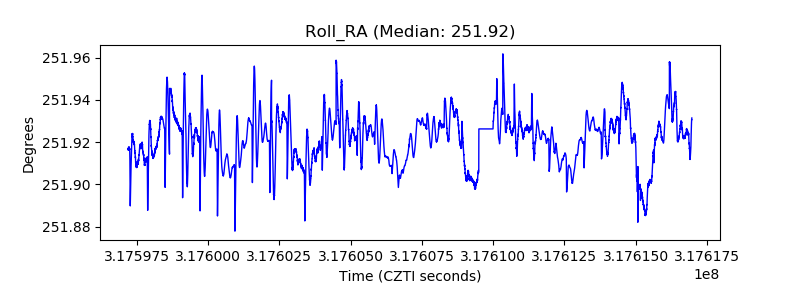 |
| Veto Counter |  |