| Param | Original file | Final file |
|---|---|---|
| Filename | modeM0/AS1A07_138T09_9000003458_23388cztM0_level2.evt | modeM0/AS1A07_138T09_9000003458_23388cztM0_level2_quad_clean.evt |
| Size (bytes) | 437,106,240 | 94,636,800 |
| Size | 416.9 MB | 90.3 MB |
| Events in quadrant A | 3,018,548 | 614,183 |
| Events in quadrant B | 3,266,502 | 630,631 |
| Events in quadrant C | 3,263,971 | 596,093 |
| Events in quadrant D | 3,255,785 | 580,667 |
| Mode SS | |||
|---|---|---|---|
| Quadrant | BADHDUFLAG | Total packets | Discarded packets |
| A | 0 | 132 | 2 |
| B | 0 | 132 | 0 |
| C | 0 | 132 | 0 |
| D | 0 | 132 | 2 |
| Mode M9 | |||
|---|---|---|---|
| Quadrant | BADHDUFLAG | Total packets | Discarded packets |
| A | 0 | 13 | 0 |
| B | 0 | 14 | 0 |
| C | 0 | 14 | 0 |
| D | 0 | 14 | 0 |
| Mode M0 | |||
|---|---|---|---|
| Quadrant | BADHDUFLAG | Total packets | Discarded packets |
| A | 0 | 13199 | 149 |
| B | 0 | 13982 | 154 |
| C | 0 | 13796 | 144 |
| D | 0 | 14179 | 166 |
| Quadrant | Total seconds | Saturated seconds | Saturation percentage |
|---|---|---|---|
| A | 6366 | 17 | 0.267044% |
| B | 6364 | 38 | 0.597109% |
| C | 6369 | 55 | 0.863558% |
| D | 6361 | 46 | 0.723157% |
Noise dominated data is calculated using 1-second bins in cleaned event files. If a bin has >2000 counts, and if more than 50% of those come from <1% of pixels, then it is considered to be noise-dominated and hence unusable.
| Quadrant | # 1 sec bins | Bins with >0 counts | Bins with >2000 counts | High rate bins dominated by noise | Noise dominated (total time) | Noise dominated (detector-on time) | Marked lightcurve |
|---|---|---|---|---|---|---|---|
| A | 7592 | 6392 | 0 | 0 | 0.00% | 0.00% | 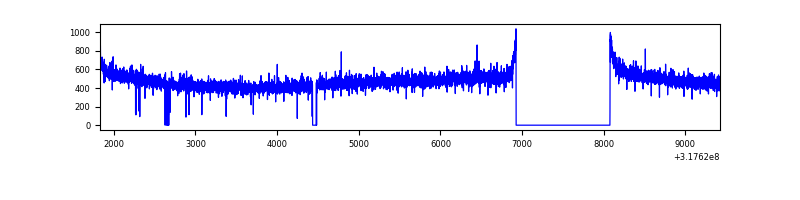 |
| B | 7592 | 6398 | 3 | 3 | 0.04% | 0.05% | 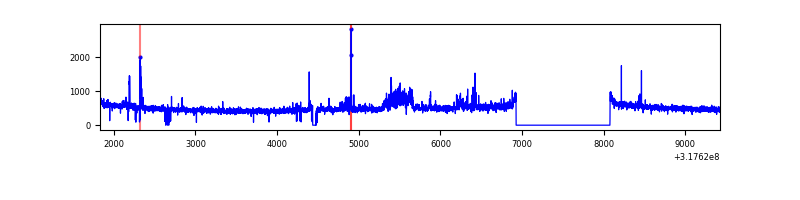 |
| C | 7591 | 6394 | 17 | 17 | 0.22% | 0.27% | 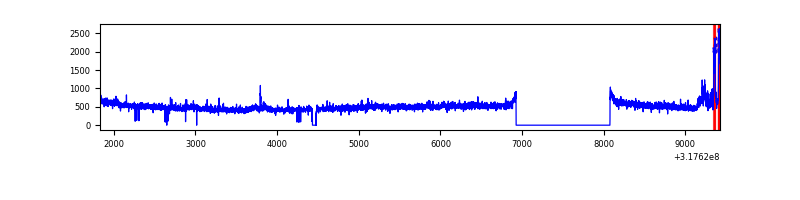 |
| D | 7591 | 6394 | 34 | 34 | 0.45% | 0.53% | 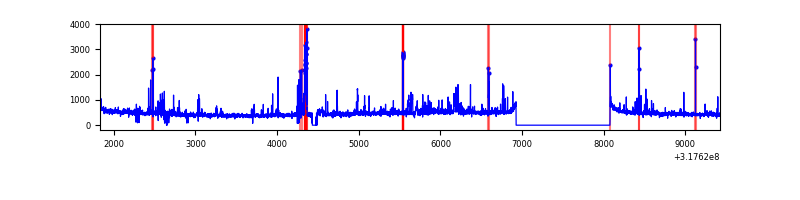 |
Top three noisy pixels from each quadrant. If the there are fewer than three noisy pixels in the level2.evt file, extra rows are filled as -1
| Pixel properties | Quadrant properties | ||||||
|---|---|---|---|---|---|---|---|
| Quadrant | DetID | PixID | Counts | Sigma | Mean | Median | Sigma |
| A | 13 | 254 | 9346 | 54.73 | 782 | 766 | 156.8 |
| A | 3 | 137 | 6746 | 38.15 | 782 | 766 | 156.8 |
| A | 0 | 226 | 6728 | 38.03 | 782 | 766 | 156.8 |
| B | 0 | 190 | 89904 | 604.45 | 780 | 761 | 147.5 |
| B | 0 | 189 | 81549 | 547.8 | 780 | 761 | 147.5 |
| B | 12 | 111 | 17600 | 114.18 | 780 | 761 | 147.5 |
| C | 10 | 9 | 217374 | 1253.23 | 745 | 751 | 172.9 |
| C | 14 | 238 | 119533 | 687.19 | 745 | 751 | 172.9 |
| C | 7 | 247 | 11398 | 61.6 | 745 | 751 | 172.9 |
| D | 1 | 52 | 308558 | 1696.49 | 751 | 730 | 181.5 |
| D | 13 | 104 | 34160 | 184.24 | 751 | 730 | 181.5 |
| D | 7 | 238 | 33886 | 182.73 | 751 | 730 | 181.5 |
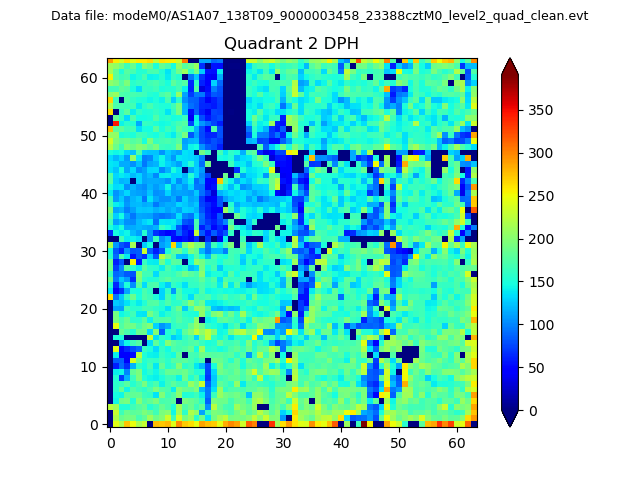
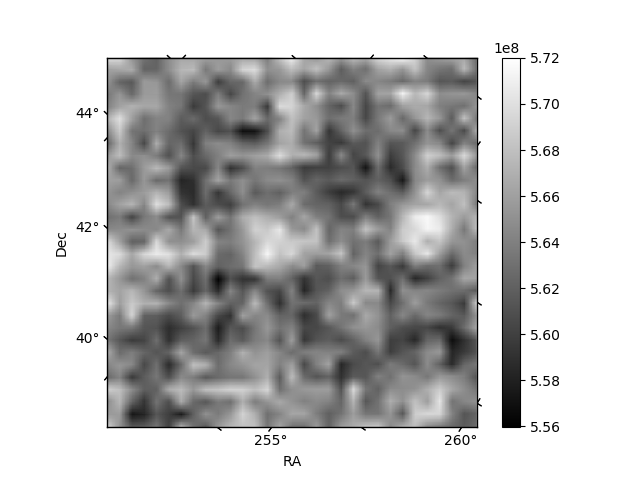
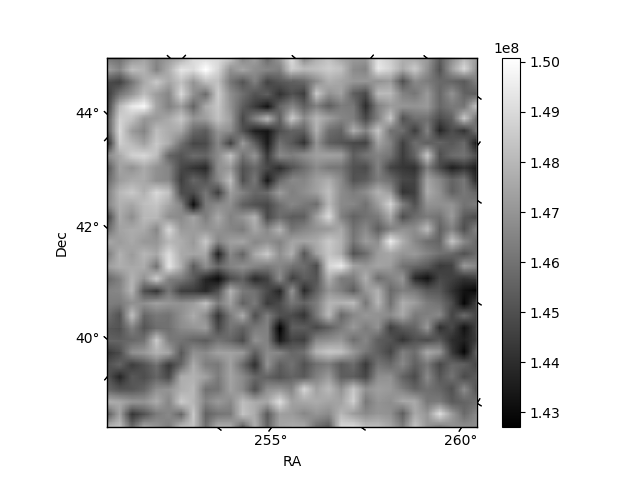
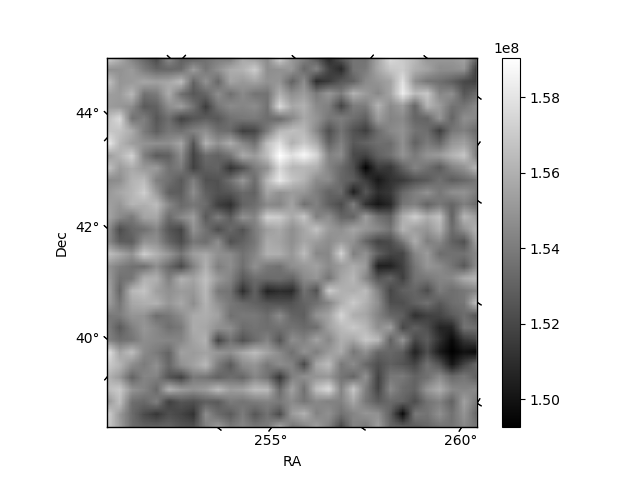
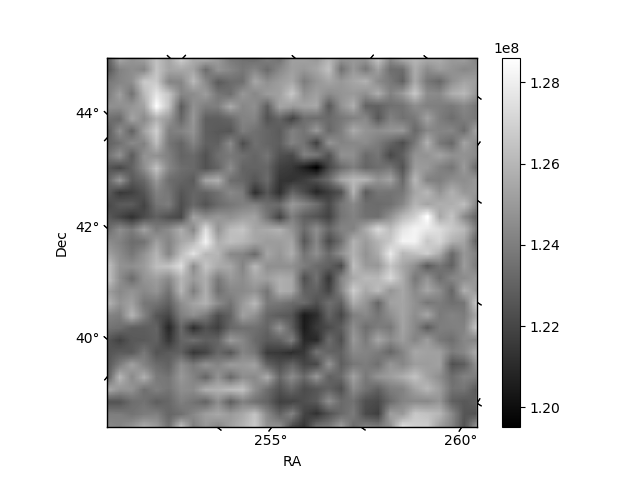
Histogram calculated using DETX and DETY for each event in the final _common_clean file
| Quadrant A | 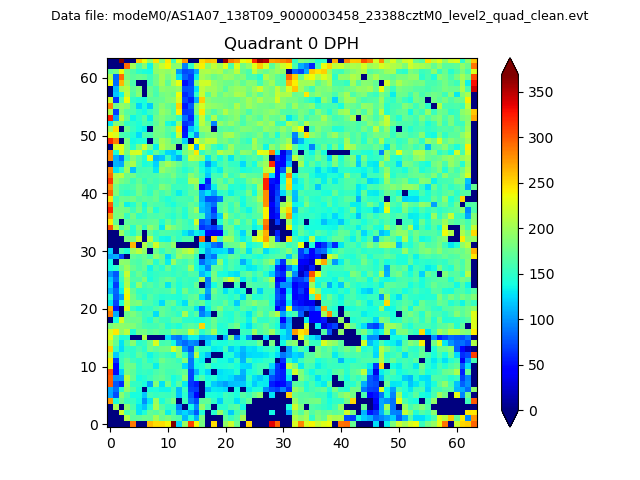 |
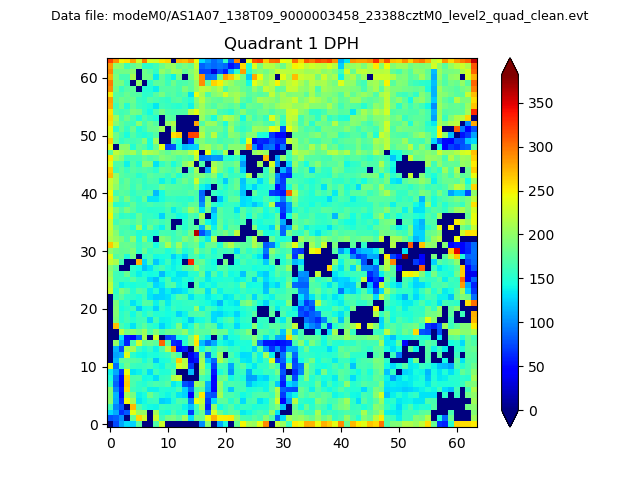 |
Quadrant B |
|---|---|---|---|
| Quadrant D | 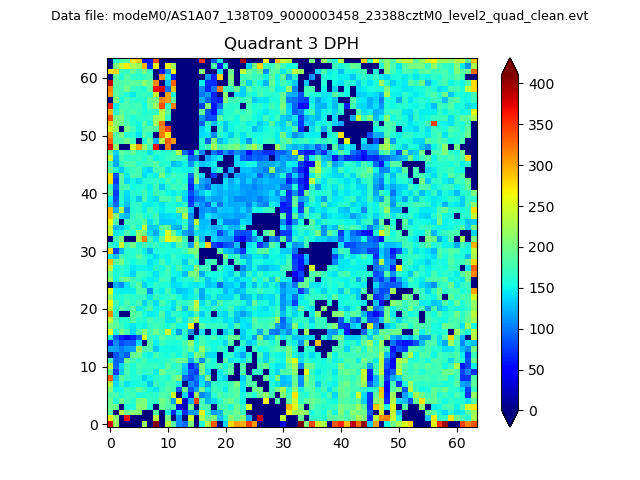 |
 |
Quadrant C |
| Plot type | Count rate plots | Images |
|---|---|---|
| Comparison with Poisson distribution Blue bars denote a histogram of data divided into 1 sec bins. Red curve is a Poisson curve with rate = median count rate of data. |
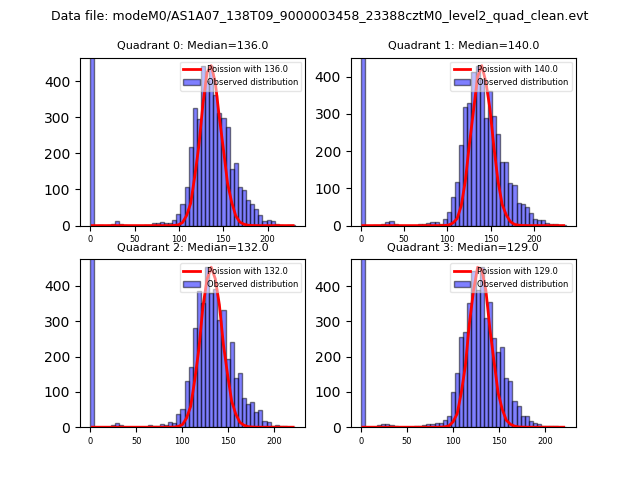 |
 |
| Quadrant-wise count rates Data is divided into 100 sec bins |
 |
|
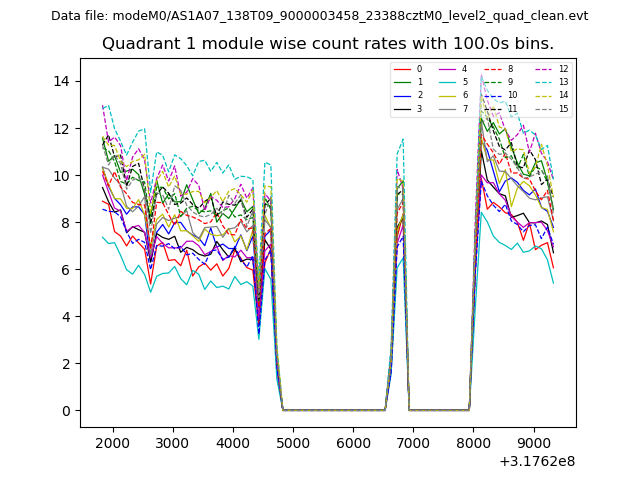
| Module-wise count rates for Quadrant A Data is divided into 100 sec bins |
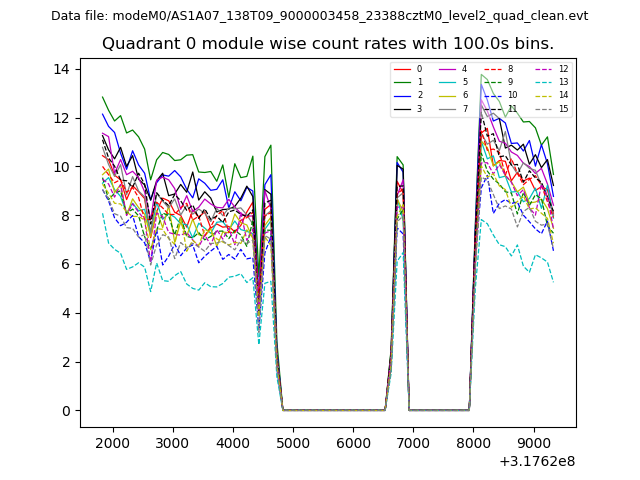 |
 |
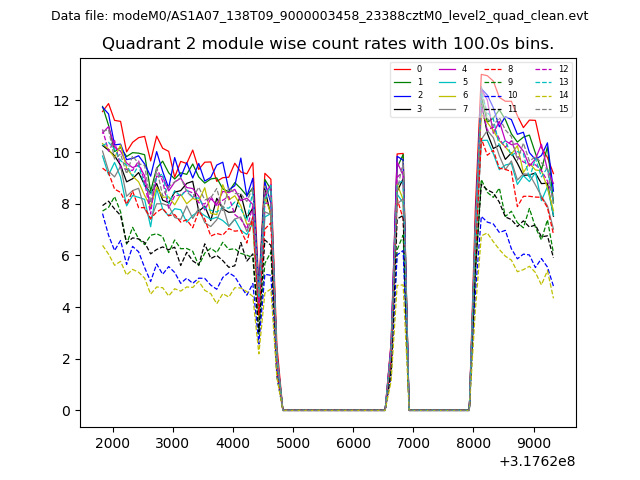
| Module-wise count rates for Quadrant B Data is divided into 100 sec bins |
 |
 |
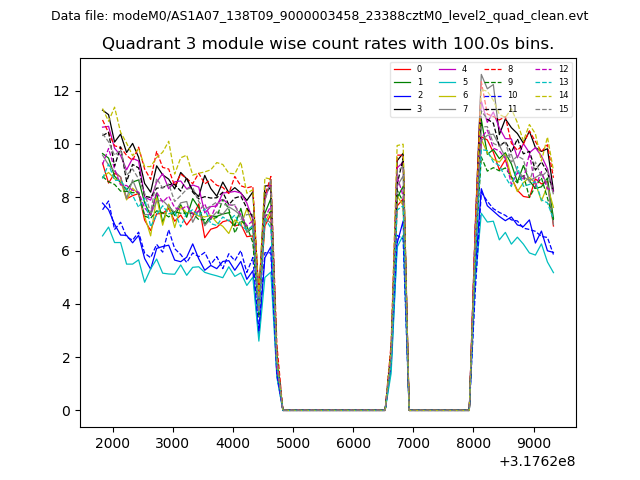
| Module-wise count rates for Quadrant C Data is divided into 100 sec bins |
 |
 |
| Module-wise count rates for Quadrant D Data is divided into 100 sec bins |
 |
 |
| Parameter | Plot |
|---|---|
| CZT HV Monitor | 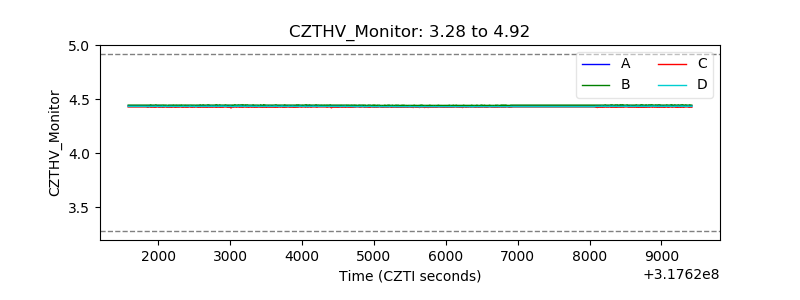 |
| D_VDD | 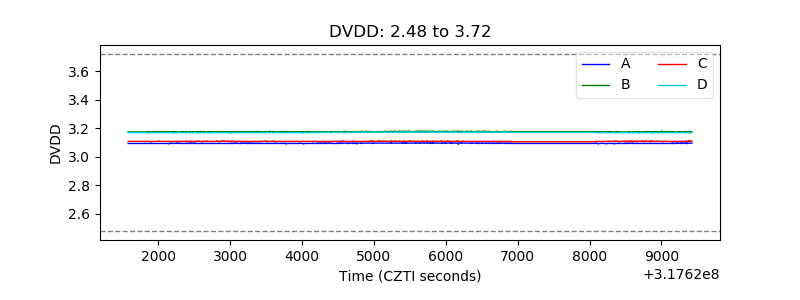 |
| Temperature 1 | 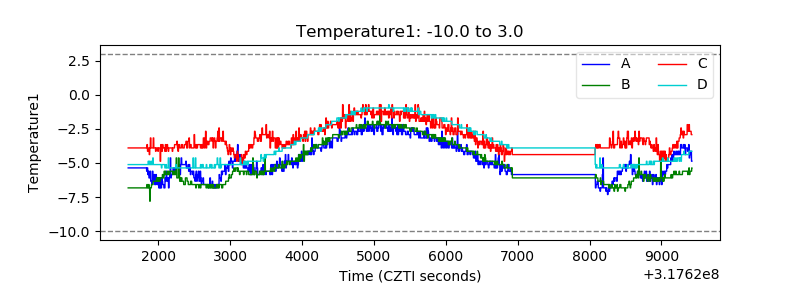 |
| Veto HV Monitor | 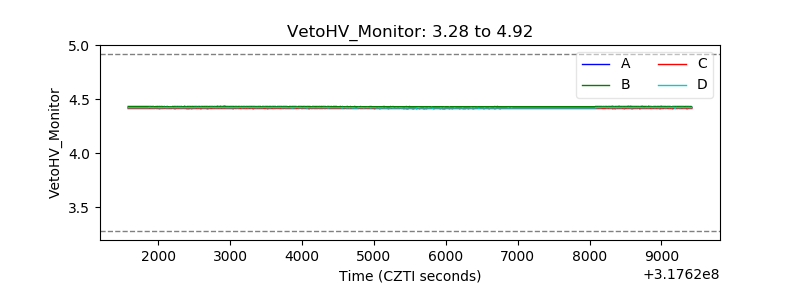 |
| Veto LLD | 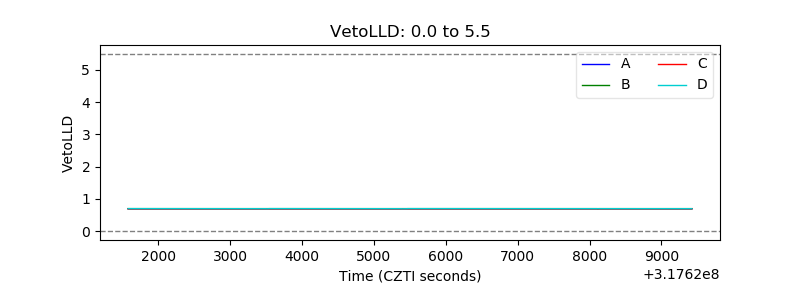 |
| Alpha Counter |  |
| _CPM_Rate | 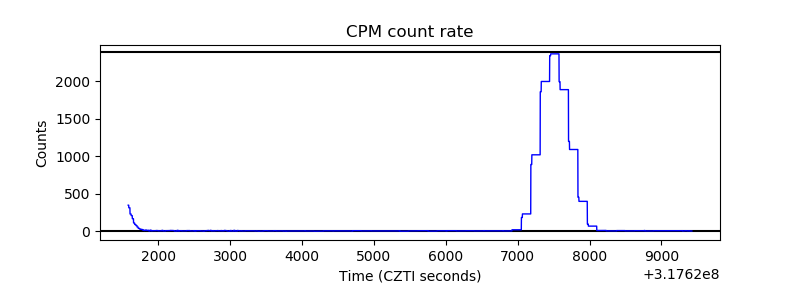 |
| CZT Counter |  |
| +2.5 Volts monitor |  |
| +5 Volts monitor |  |
| _ROLL_ROT | 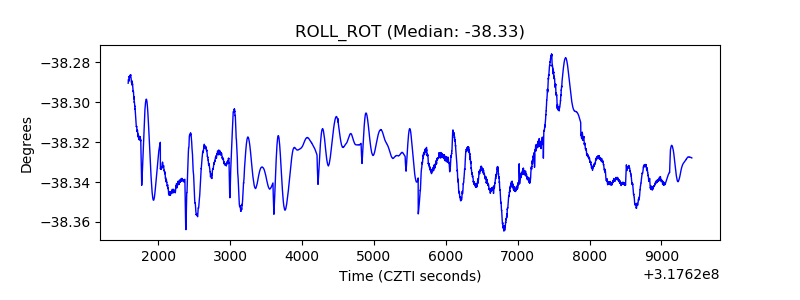 |
| _Roll_DEC | 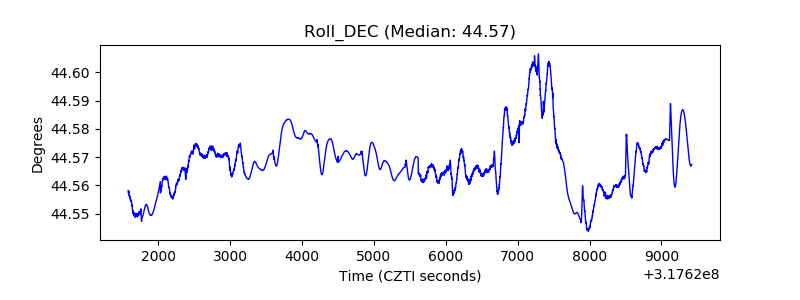 |
| _Roll_RA | 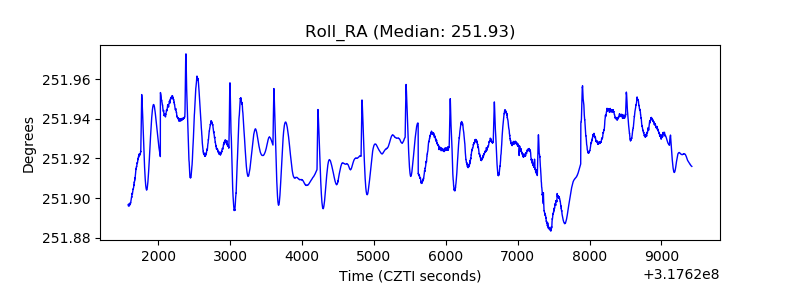 |
| Veto Counter | 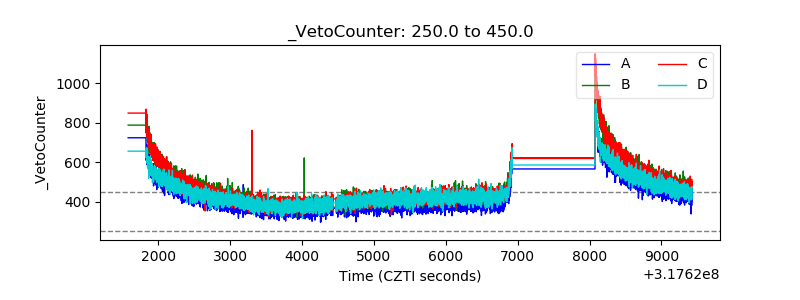 |