| Param | Original file | Final file |
|---|---|---|
| Filename | modeM0/AS1A07_138T09_9000003458_23390cztM0_level2.evt | modeM0/AS1A07_138T09_9000003458_23390cztM0_level2_quad_clean.evt |
| Size (bytes) | 824,808,960 | 150,102,720 |
| Size | 786.6 MB | 143.1 MB |
| Events in quadrant A | 5,061,829 | 987,571 |
| Events in quadrant B | 5,636,305 | 1,004,321 |
| Events in quadrant C | 6,522,969 | 944,531 |
| Events in quadrant D | 7,072,564 | 907,306 |
| Mode SS | |||
|---|---|---|---|
| Quadrant | BADHDUFLAG | Total packets | Discarded packets |
| A | 0 | 220 | 8 |
| B | 0 | 220 | 14 |
| C | 0 | 220 | 14 |
| D | 0 | 219 | 8 |
| Mode M9 | |||
|---|---|---|---|
| Quadrant | BADHDUFLAG | Total packets | Discarded packets |
| A | 0 | 24 | 3 |
| B | 0 | 24 | 1 |
| C | 0 | 23 | 2 |
| D | 0 | 25 | 2 |
| Mode M0 | |||
|---|---|---|---|
| Quadrant | BADHDUFLAG | Total packets | Discarded packets |
| A | 0 | 22131 | 980 |
| B | 0 | 23963 | 1052 |
| C | 0 | 26531 | 1058 |
| D | 0 | 29301 | 1674 |
| Quadrant | Total seconds | Saturated seconds | Saturation percentage |
|---|---|---|---|
| A | 10157 | 102 | 1.004234% |
| B | 10141 | 197 | 1.942609% |
| C | 10127 | 330 | 3.258616% |
| D | 10090 | 627 | 6.214073% |
Noise dominated data is calculated using 1-second bins in cleaned event files. If a bin has >2000 counts, and if more than 50% of those come from <1% of pixels, then it is considered to be noise-dominated and hence unusable.
| Quadrant | # 1 sec bins | Bins with >0 counts | Bins with >2000 counts | High rate bins dominated by noise | Noise dominated (total time) | Noise dominated (detector-on time) | Marked lightcurve |
|---|---|---|---|---|---|---|---|
| A | 13126 | 10289 | 0 | 0 | 0.00% | 0.00% | 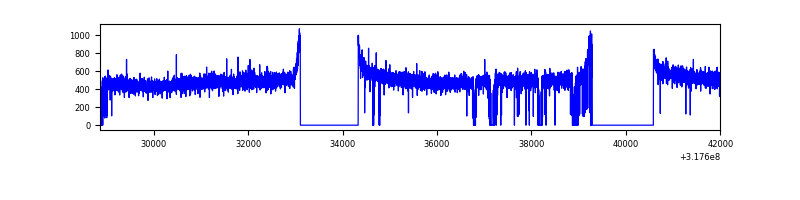 |
| B | 13106 | 10278 | 80 | 80 | 0.61% | 0.78% | 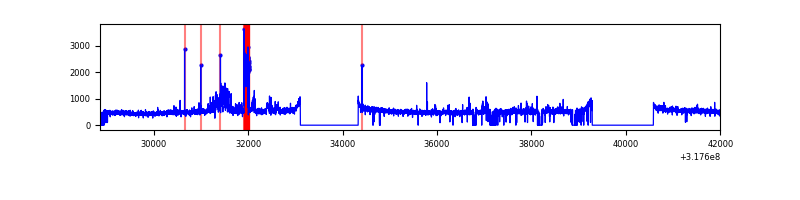 |
| C | 13126 | 10279 | 138 | 138 | 1.05% | 1.34% | 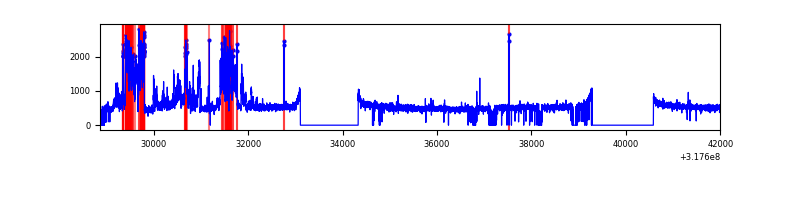 |
| D | 13120 | 10232 | 512 | 512 | 3.90% | 5.00% |  |
Top three noisy pixels from each quadrant. If the there are fewer than three noisy pixels in the level2.evt file, extra rows are filled as -1
| Pixel properties | Quadrant properties | ||||||
|---|---|---|---|---|---|---|---|
| Quadrant | DetID | PixID | Counts | Sigma | Mean | Median | Sigma |
| A | 13 | 254 | 15472 | 54.93 | 1313 | 1285 | 258.3 |
| A | 0 | 226 | 11635 | 40.07 | 1313 | 1285 | 258.3 |
| A | 3 | 137 | 10677 | 36.36 | 1313 | 1285 | 258.3 |
| B | 4 | 200 | 290305 | 1208.93 | 1291 | 1265 | 239.1 |
| B | 0 | 190 | 182987 | 760.07 | 1291 | 1265 | 239.1 |
| B | 0 | 189 | 81149 | 334.12 | 1291 | 1265 | 239.1 |
| C | 10 | 9 | 1436432 | 5084.74 | 1241 | 1251 | 282.3 |
| C | 14 | 238 | 200848 | 707.16 | 1241 | 1251 | 282.3 |
| C | 7 | 247 | 18998 | 62.88 | 1241 | 1251 | 282.3 |
| D | 1 | 52 | 2282548 | 7823.49 | 1233 | 1199 | 291.6 |
| D | 12 | 233 | 57422 | 192.81 | 1233 | 1199 | 291.6 |
| D | 2 | 234 | 39619 | 131.75 | 1233 | 1199 | 291.6 |
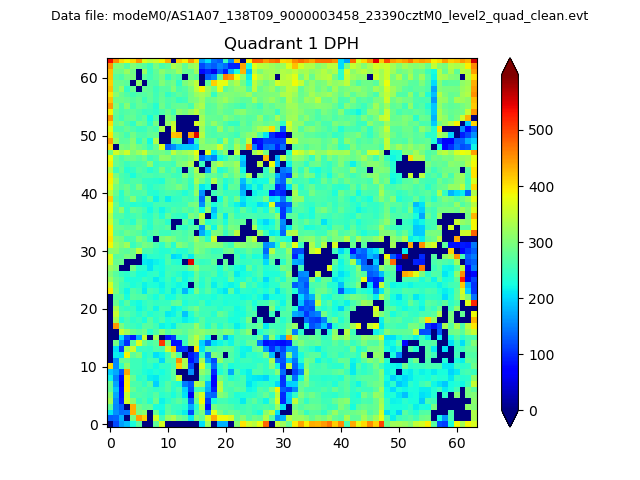
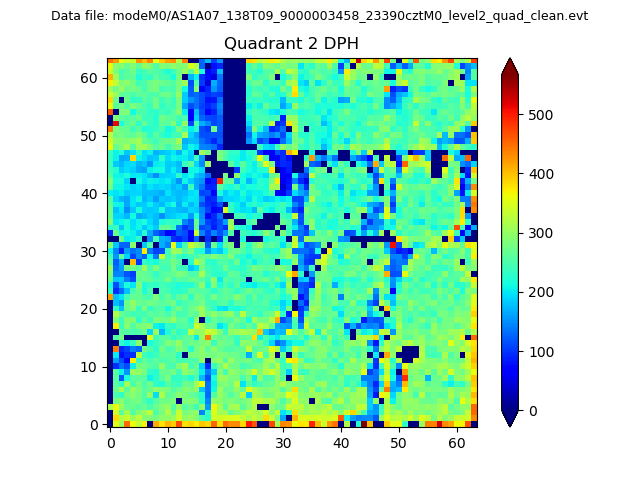
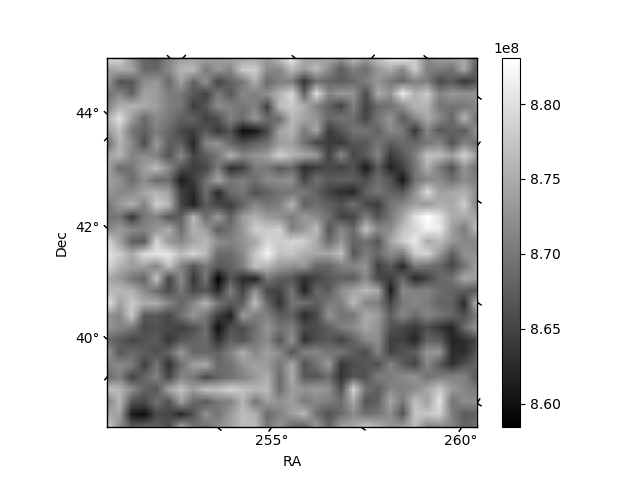
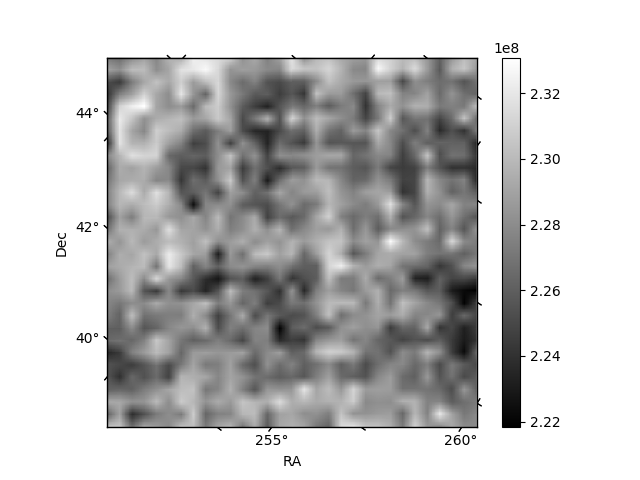
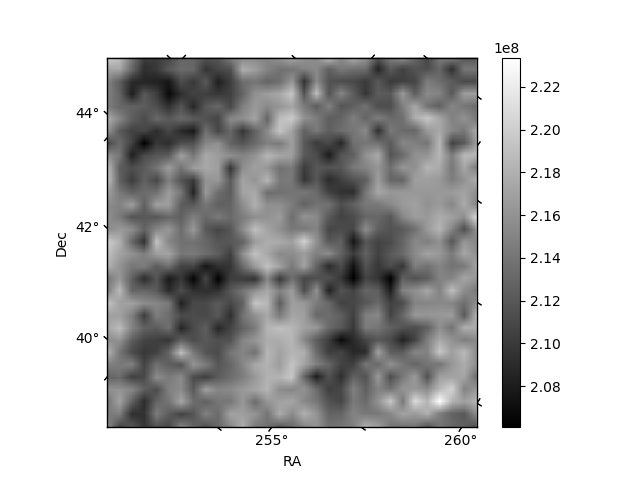
Histogram calculated using DETX and DETY for each event in the final _common_clean file
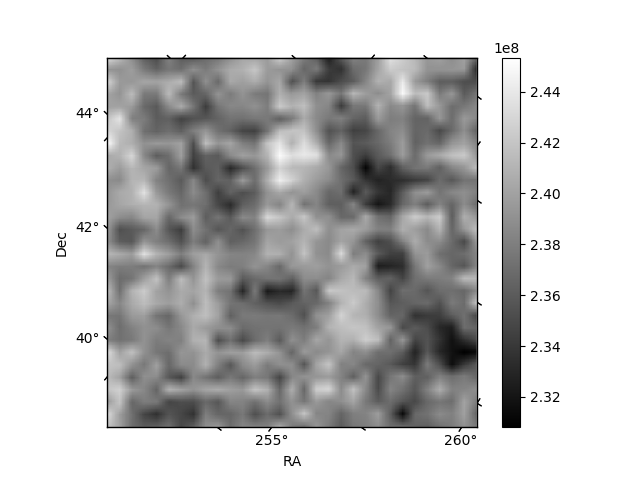
| Quadrant A | 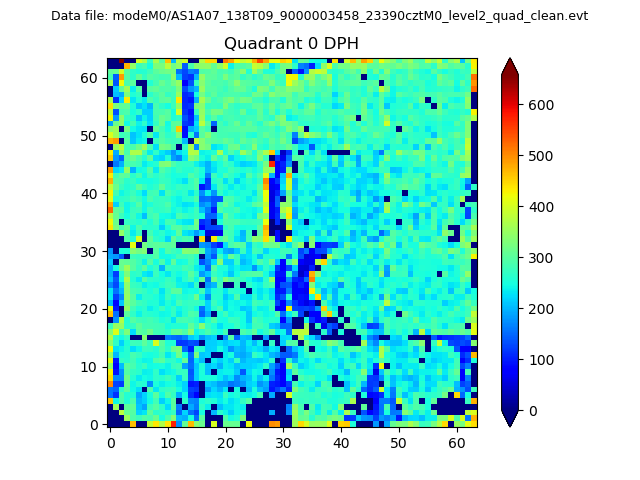 |
 |
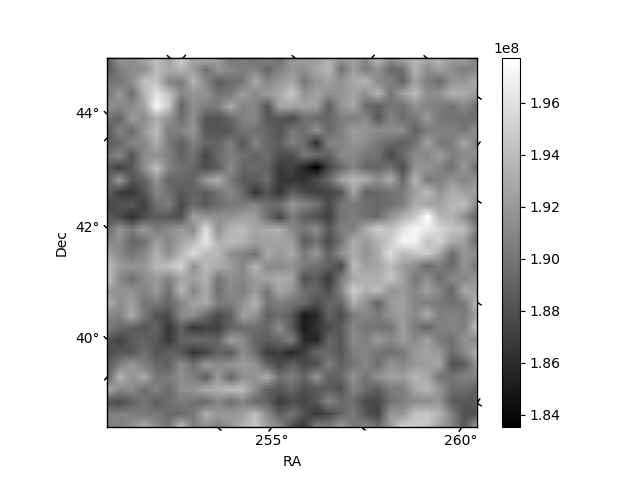
Quadrant B |
|---|---|---|---|
| Quadrant D | 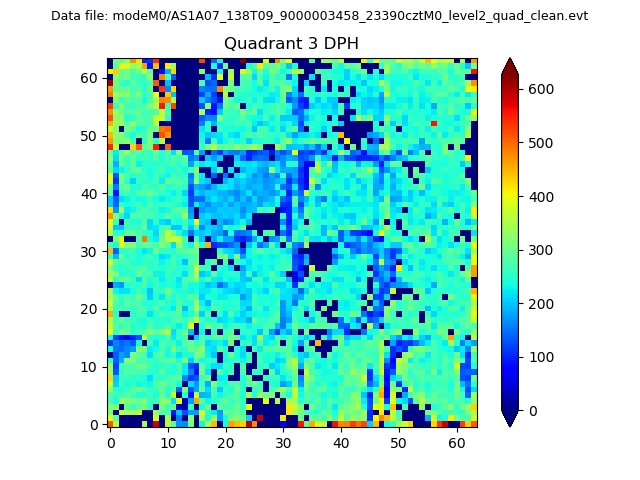 |
 |
Quadrant C |
| Plot type | Count rate plots | Images |
|---|---|---|
| Comparison with Poisson distribution Blue bars denote a histogram of data divided into 1 sec bins. Red curve is a Poisson curve with rate = median count rate of data. |
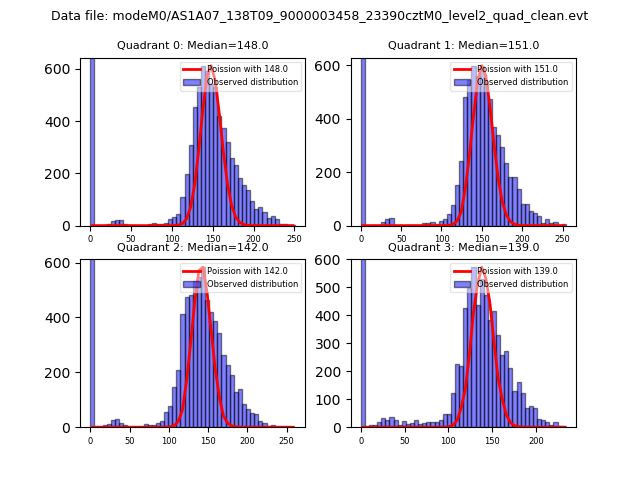 |
 |
| Quadrant-wise count rates Data is divided into 100 sec bins |
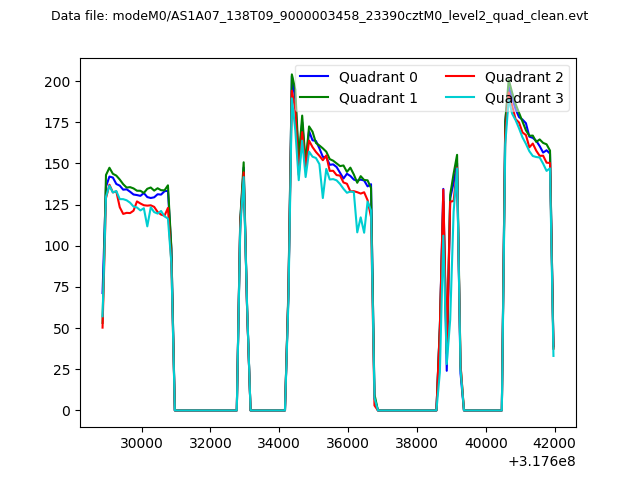 |
|
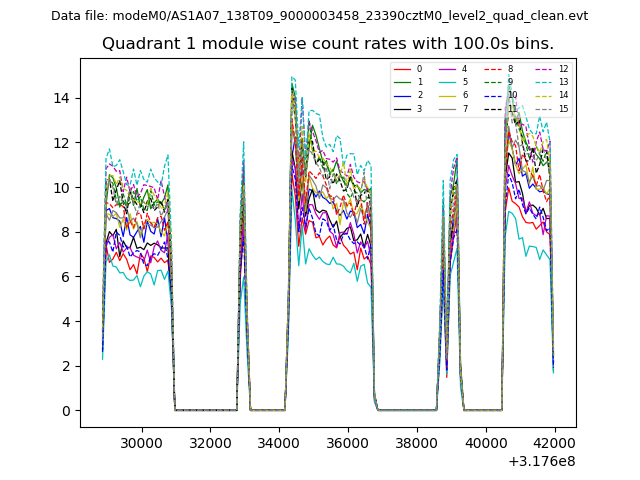
| Module-wise count rates for Quadrant A Data is divided into 100 sec bins |
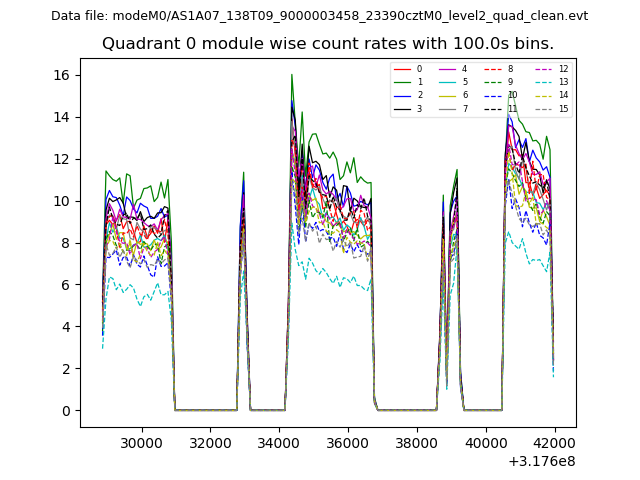 |
 |
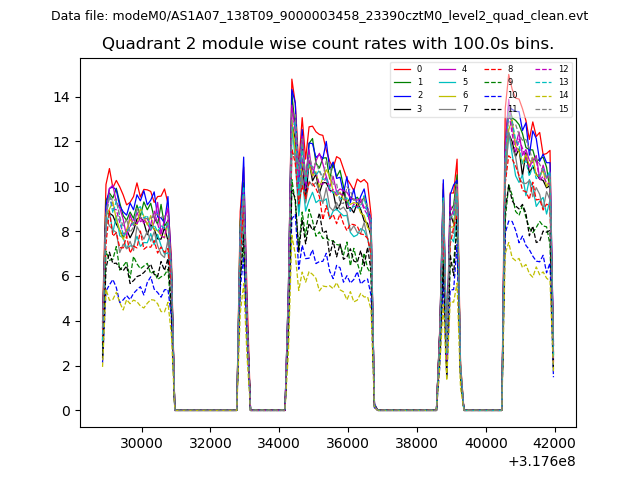
| Module-wise count rates for Quadrant B Data is divided into 100 sec bins |
 |
 |
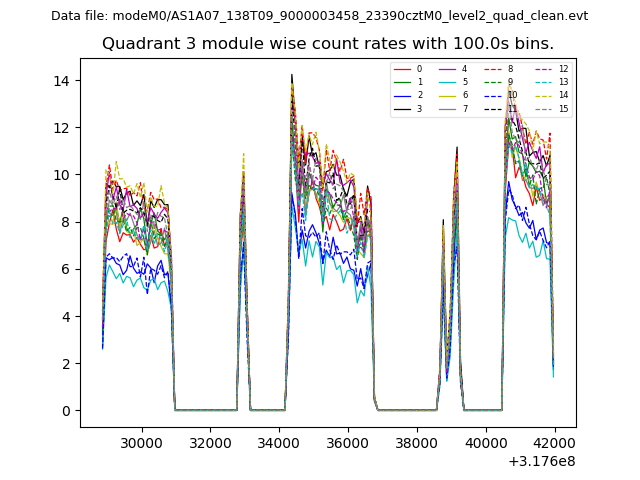
| Module-wise count rates for Quadrant C Data is divided into 100 sec bins |
 |
 |
| Module-wise count rates for Quadrant D Data is divided into 100 sec bins |
 |
 |
| Parameter | Plot |
|---|---|
| CZT HV Monitor | 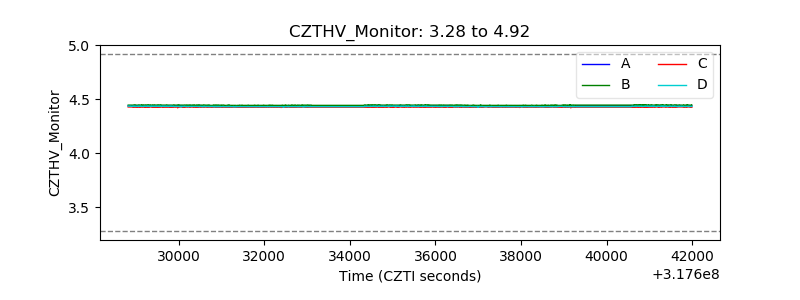 |
| D_VDD | 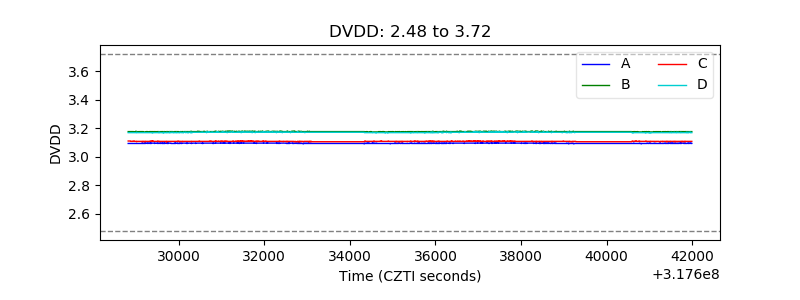 |
| Temperature 1 | 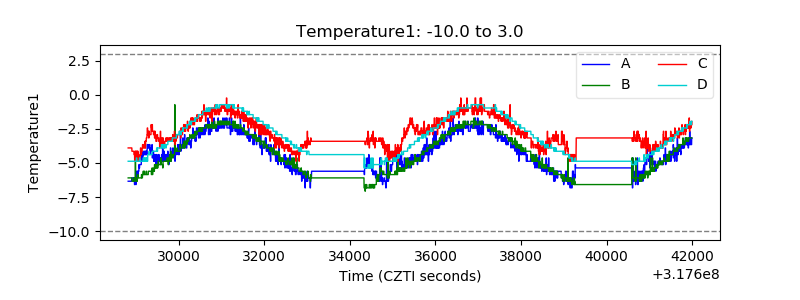 |
| Veto HV Monitor | 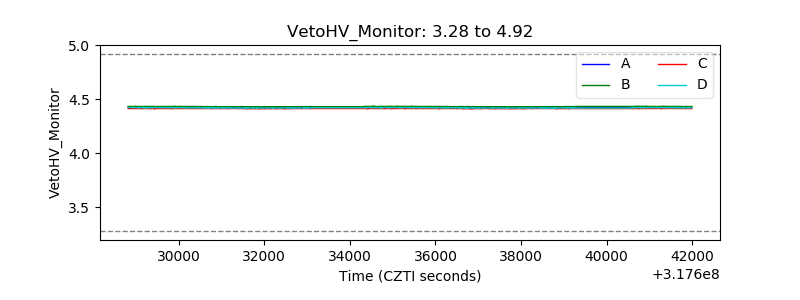 |
| Veto LLD | 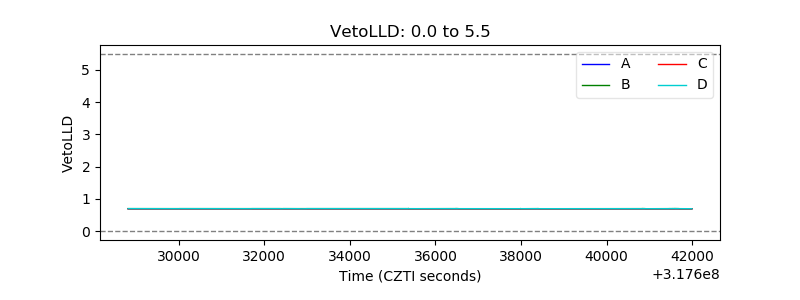 |
| Alpha Counter | 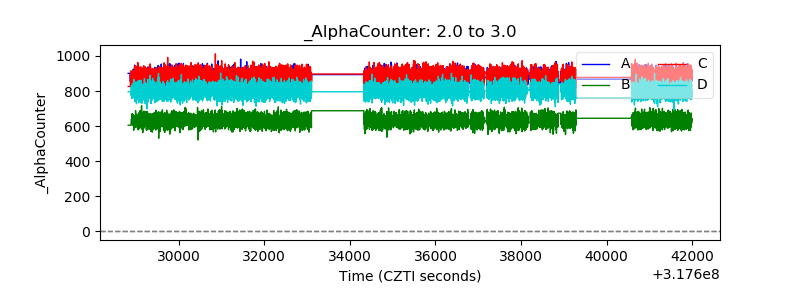 |
| _CPM_Rate | 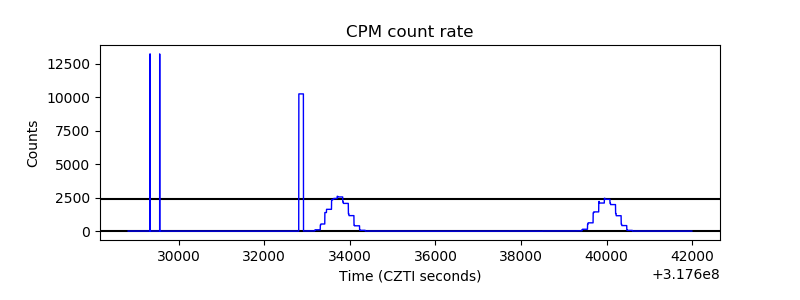 |
| CZT Counter | 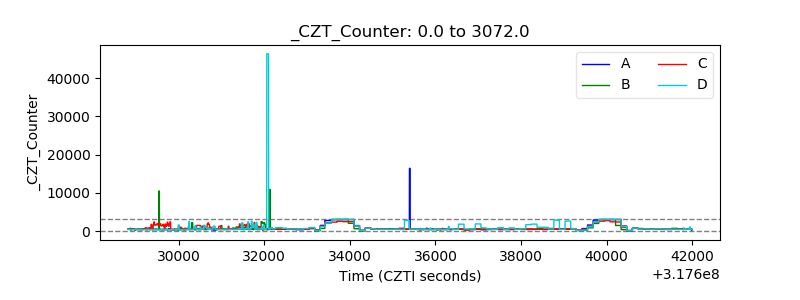 |
| +2.5 Volts monitor |  |
| +5 Volts monitor |  |
| _ROLL_ROT | 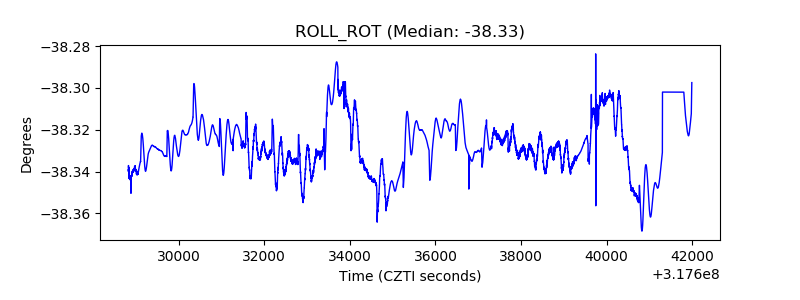 |
| _Roll_DEC | 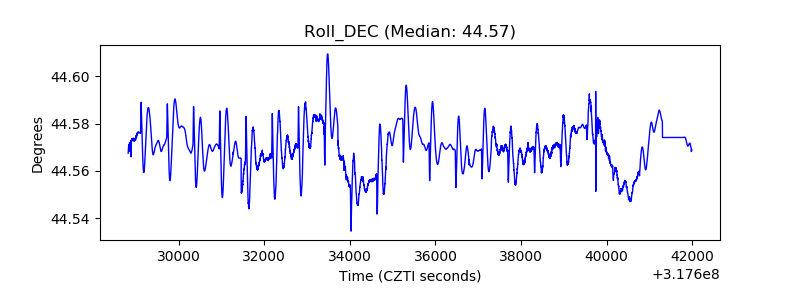 |
| _Roll_RA | 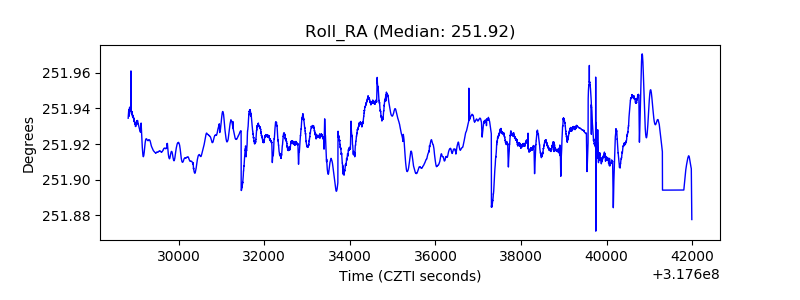 |
| Veto Counter | 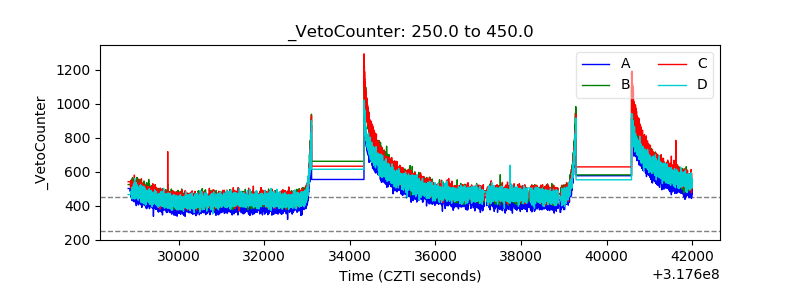 |